US Energy bar Market by Distribution Channel, Product, and Type Forecast and Analysis - 2024-2028

US Energy bar Market by Distribution Channel, Product, and Type Forecast and Analysis - 2024-2028

Published: Feb 2024 147 Pages SKU: IRTNTR77449

Market Overview at a Glance

$879.59 Mn
Market Opportunity
4.6%
CAGR
3.74
YoY growth 2023-2024(%)

US Energy Bar Market Size 2024-2028 

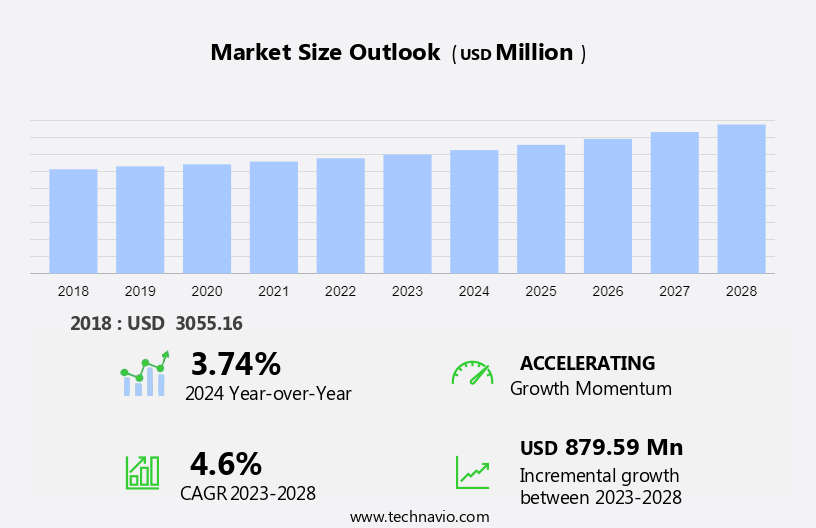
The US energy bar market size is forecast to increase by USD 879.59 billion at a CAGR of 4.6% between 2023 and 2028. The energy bar market in the US is experiencing significant growth, driven by the increasing demand for convenient and nutritious sports nutrition solutions. Consumers are increasingly turning to energy bars as a quick and easy source of sustenance for active lifestyles. Oats, nuts, and seeds are popular ingredients in energy bars due to their high fiber content and energy density. However, the market faces challenges such as the easy availability of substitutes, including fresh fruits and vegetables, and the perception that energy bars contain excessive amounts of sugar. To address this, many manufacturers are focusing on producing bars with reduced sugar content and micronutrient-rich ingredients to cater to health-conscious consumers. Online retailing is also a growing trend in the energy bar market, making these products more accessible than ever before.

Energy bar Market in US Size

 Request Free Sample

The energy bars market in the US is witnessing significant growth due to increasing consumption patterns of convenience foods, especially among urban consumers. These bars, made with ingredients like granola, oats, nuts, seeds, and a minimal amount of sugar, cater to the demand for healthy, on-the-go snacking options. Micronutrients and essential nutrients are the key selling points for energy bars, making them a popular choice for individuals focused on wellness & fitness. The sports nutrition industry also contributes to the market's growth, with athletes and tournament organizers relying on these supplemental bars for energy and nutritional support.

The retail sector, including wellness & fitness facilities and online distributors, plays a crucial role in the distribution of energy bars. Online retailing has gained traction due to its convenience, allowing consumers to purchase these bars from the comfort of their homes. However, concerns regarding health issues like heart disease, obesity, blood cholesterol, and diabetes continue to influence consumer preferences. Energy bars, with their nutrient-dense ingredients, offer a viable alternative to traditional snacks, making them a preferred choice for health-conscious consumers.

Market Segmentation

The market research report provides comprehensive data (region-wise segment analysis), with forecasts and estimates in "USD million" for the period 2024-2028, as well as historical data from 2018-2022 for the following segments.

  • Distribution Channel
    • Offline
    • Online
  • Product
    • Conventional energy bars
    • Organic energy bars
  • Type
    • Protein bars
    • Nutrition bars
    • Cereal bars
    • Fiber bars
  • Geography
    • US

By Distribution Channel Insights

The offline segment is estimated to witness significant growth during the forecast period. The energy bar market in the US is witnessing significant growth, particularly in the convenience food sector. Consumption patterns have shifted towards on-the-go snacking, making energy bars an ideal choice for health-conscious consumers. Supermarkets and hypermarkets dominate the retail landscape for energy bars in the US. These large-format stores offer a wide range of products, making it convenient for customers to purchase energy bars alongside their other grocery needs. Organized retail channels, including supermarkets, hypermarkets, convenience stores, and discount stores, are driving sales in the energy bar market. Consumers prefer these retail formats due to their extensive product offerings and discounts, which incentivize purchases.

Despite their smaller capacity, convenience stores and discount stores also contribute to the market's growth by catering to consumers seeking quick, on-the-go snacking options. Overall, the retail sector plays a crucial role in the increasing popularity and consumption of energy bars in the US.

Energy bar Market in US Size

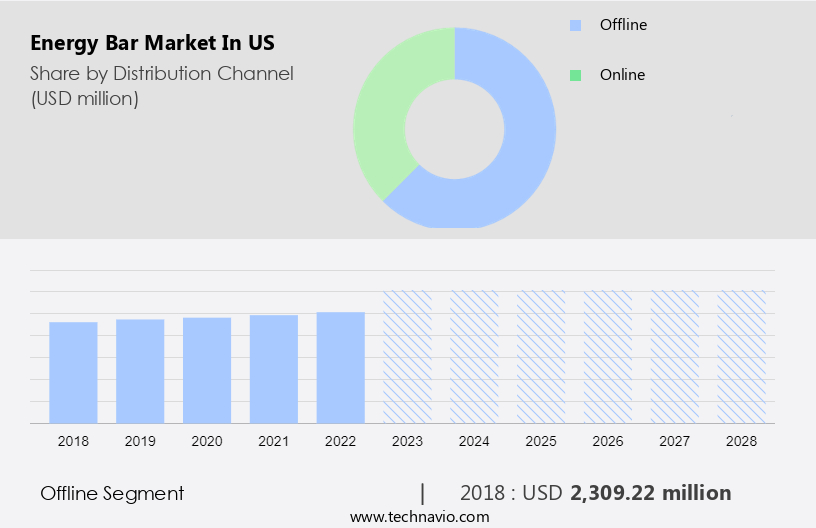
Get a glance at the market share of various segments Request Free Sample

The offline segment accounted for USD 2.31 billion in 2018 and showed a gradual increase during the forecast period.

Our market researchers analyzed the data with 2023 as the base year, along with the key drivers, trends, and challenges. A holistic analysis of drivers will help companies refine their marketing strategies to gain a competitive advantage.

Market Driver

Increasing demand for sports nutrition is the key driver of the market. The US market for energy bars continues to gain traction, fueled by a growing consumer base consisting of athletes and fitness enthusiasts. These individuals seek to maintain optimal energy levels through a balanced diet, rich in carbohydrates, protein, healthy fats, vitamins, and minerals. Energy bars, along with sports drinks and shakes, serve as essential supplements to this diet. The demographic landscape of energy bar consumers is evolving, moving away from traditional core and casual users towards lifestyle and mobile users. Core users comprise professional athletes, while casual users include recreational athletes. Lifestyle users are individuals who embrace active lifestyle cultures, and mobile users invest in technology-driven solutions such as fitness apps, trackers, and wearables.

Oats, nuts, seeds, and a minimal amount of sugar are common ingredients in energy bars, providing essential micronutrients to support the nutritional needs of this consumer base.

Market Trends

Increasing sales of energy bars through online retailing is the upcoming trend in the market. The US energy bar market is experiencing notable growth, fueled by several factors. These include the expanding urban population, the increasing number of millennials, and the rise in disposable income. Online grocery sales, including energy bars, have gained significant traction due to their elimination of supply chain intermediaries, resulting in increased value. Busy consumers who value the convenience of shopping from home are increasingly turning to online platforms for energy bars. These platforms offer a wider selection of brands, flavors, and formulations, catering to diverse preferences and dietary needs.

Market Challenge

The easy availability of substitutes for energy bars is a key challenge affecting the market growth. Energy bars, crafted from oats, nuts, and seeds, cater to the growing demand for quick energy boosters among Americans engaged in physical and outdoor activities. These consumers prioritize functional and convenient foods, such as snack bars, during travel or while participating in sports and outdoor pursuits. Taste, wholesome ingredients, and organic materials are essential factors influencing their purchasing decisions. However, energy bars may face competition from alternative snacks like trail mix, nut and seed mixtures, and smoothies, due to their varying ingredient compositions. Energy bars often contain more sugar than other snack options, which may not align with some individuals' dietary preferences or nutritional requirements.

Consequently, the selection of energy bar substitutes is vast, enabling consumers to meet their unique energy needs and dietary constraints.

Exclusive Customer Landscape

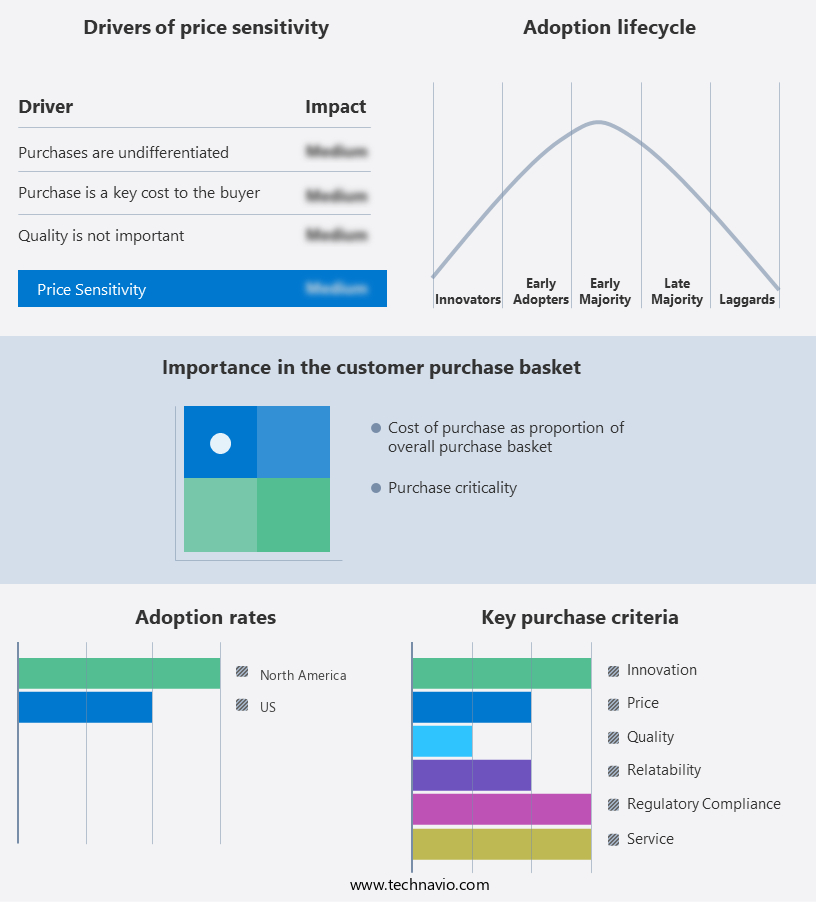
The market forecasting report includes the adoption lifecycle of the market, covering from the innovator's stage to the laggard's stage. It focuses on adoption rates in different regions based on penetration. Furthermore, the report also includes key purchase criteria and drivers of price sensitivity to help companies evaluate and develop their market growth analysis strategies.

Energy bar Market in US Share by Geography

 Customer Landscape

Key Companies & Market Insights

Companies are implementing various strategies, such as strategic alliances, partnerships, mergers and acquisitions, geographical expansion, and product/service launches, to enhance their presence in the market.

Abbott Laboratories: The company offers energy bars such as Zoneperfect classic bars. They also offer Glucerna Snack Bars and Abbott Zone Perfect Classic Fudge Graham Nutrition Bars.

The market research and growth report includes detailed analyses of the competitive landscape of the market and information about key companies, including:

  • Better Carob
  • Element Bars Inc.
  • Empact Bars
  • Garuka Bars
  • General Mills Inc.
  • Hormel Foods Corp.
  • Kates Real Food
  • Kellogg Co.
  • Lotus Bakeries NV
  • Mars Inc.
  • Mondelez International Inc.
  • Nestle SA
  • NuGo Nutrition
  • Post Holdings Inc.
  • PROBAR LLC
  • The Balance Bar Co.
  • The Simply Good Foods Co.
  • Torq Performance Nutrition
  • PepsiCo Inc.

Qualitative and quantitative analysis of companies has been conducted to help clients understand the wider business environment as well as the strengths and weaknesses of key market players. Data is qualitatively analyzed to categorize companies as pure play, category-focused, industry-focused, and diversified; it is quantitatively analyzed to categorize companies as dominant, leading, strong, tentative, and weak.

Research Analyst Overview

The energy bar market in the US is witnessing significant growth due to the increasing preference for convenient, on-the-go snacking options among urban consumers. These bars are popularly consumed as supplemental sources of proteins, nutrients, and micronutrients, making them an ideal choice for individuals following a balanced diet. Key Ingredients: Energy bars are typically made from oats, nuts, seeds, and a combination of sugars. These ingredients provide instant energy and help sustain energy levels throughout the day. Health Conscious Consumers: The rising awareness of health and wellness is driving the demand for energy bars in the US. Consumers are increasingly opting for products with healthy ingredients, such as those that are gluten-free, vegan, low fat, low calories, and contain no added sugars or sweeteners. With the rise of fitness awareness, gyms are increasingly promoting healthy foods and on-the-go snack options to support members in maintaining their wellness goals.

Sports Nutrition Industry: Energy bars are a staple in the sports nutrition industry, with tournament organizers and sports clubs recommending them as essential fuel for athletes. These bars are also popular among fitness enthusiasts and gym-goers, making the offline channel a significant distribution point. This trend is particularly popular among consumers who lead busy lifestyles and prefer to have their orders delivered directly to their doorstep. Food Trends: Product innovations in the energy bar market include the inclusion of heart-healthy ingredients, such as those that help reduce the risk of heart disease, obesity, and diabetes. Additionally, the market is witnessing a growing trend towards energy bars that cater to specific dietary requirements, such as those that are vegan or low in sugar.

Market Scope

Report Coverage

Details

Page number

147

Base year

2023

Historic period

2018-2022

Forecast period

2024-2028

Growth momentum & CAGR

Accelerate at a CAGR of 4.6%

Market Growth 2024-2028

USD 879.59 million

Market structure

Fragmented

YoY growth 2023-2024(%)

3.74

Key companies profiled

Abbott Laboratories, Better Carob, Element Bars Inc., Empact Bars, Garuka Bars, General Mills Inc., Hormel Foods Corp., Kates Real Food, Kellogg Co., Lotus Bakeries NV, Mars Inc., Mondelez International Inc., Nestle SA, NuGo Nutrition, Post Holdings Inc., PROBAR LLC, The Balance Bar Co., The Simply Good Foods Co., Torq Performance Nutrition, and PepsiCo Inc.

Market dynamics

Parent market analysis, market growth inducers and obstacles, market forecast, fast-growing and slow-growing segment analysis, COVID-19 impact and recovery analysis and future consumer dynamics, market condition analysis for the forecast period

Customization purview

If our market report has not included the data that you are looking for, you can reach out to our analysts and get segments customized.

Competitive landscape

Leading Companies, Market Positioning of Companies, Competitive Strategies, and Industry Risks

Request Free Sample

What are the Key Data Covered in this Market Report?

  • CAGR of the market during the forecast period
  • Detailed information on factors that will drive the market growth and forecasting between 2024 and 2028
  • Precise estimation of the size of the market  and its contribution of the market in focus to the parent market
  • Accurate predictions about upcoming market growth and trends and changes in consumer behaviour
  • Growth of the market across US
  • Thorough analysis of the market's competitive landscape and detailed information about companies
  • Comprehensive analysis of factors that will challenge the growth of market companies

We can help! Our analysts can customize this market research report to meet your requirements Get in touch

1 Executive Summary

  • 1.1 Market overview
    • Exhibit 01: Executive Summary – Chart on Market Overview
    • Exhibit 02: Executive Summary – Data Table on Market Overview
    • Exhibit 03: Executive Summary – Chart on Country Market Characteristics
    • Exhibit 04: Executive Summary – Chart on Market Segmentation by Distribution Channel
    • Exhibit 05: Executive Summary – Chart on Market Segmentation by Product
    • Exhibit 06: Executive Summary – Chart on Market Segmentation by Type
    • Exhibit 07: Executive Summary – Chart on Vendor Market Positioning

2 Market Landscape

  • 2.1 Market ecosystem
    • Exhibit 08: Parent market
    • Exhibit 09: Market Characteristics

3 Market Sizing

  • 3.1 Market definition
    • Exhibit 10: Offerings of vendors included in the market definition
  • 3.2 Market segment analysis
    • Exhibit 11: Market segments
  • 3.3 Market size 2023
    • 3.4 Market outlook: Forecast for 2023-2028
      • Exhibit 12: Chart on US - Market size and forecast 2023-2028 ($ million)
      • Exhibit 13: Data Table on US - Market size and forecast 2023-2028 ($ million)
      • Exhibit 14: Chart on US: Year-over-year growth 2023-2028 (%)
      • Exhibit 15: Data Table on US: Year-over-year growth 2023-2028 (%)

    4 Historic Market Size

    • 4.1 Energy bar market in US 2018 - 2022
      • Exhibit 16: Historic Market Size – Data Table on energy bar market in US 2018 - 2022 ($ million)
    • 4.2 Distribution Channel Segment Analysis 2018 - 2022
      • Exhibit 17: Historic Market Size – Distribution Channel Segment 2018 - 2022 ($ million)
    • 4.3 Product Segment Analysis 2018 - 2022
      • Exhibit 18: Historic Market Size – Product Segment 2018 - 2022 ($ million)
    • 4.4 Type Segment Analysis 2018 - 2022
      • Exhibit 19: Historic Market Size – Type Segment 2018 - 2022 ($ million)

    5 Five Forces Analysis

    • 5.1 Five forces summary
      • Exhibit 20: Five forces analysis - Comparison between 2023 and 2028
    • 5.2 Bargaining power of buyers
      • Exhibit 21: Chart on Bargaining power of buyers – Impact of key factors 2023 and 2028
    • 5.3 Bargaining power of suppliers
      • Exhibit 22: Bargaining power of suppliers – Impact of key factors in 2023 and 2028
    • 5.4 Threat of new entrants
      • Exhibit 23: Threat of new entrants – Impact of key factors in 2023 and 2028
    • 5.5 Threat of substitutes
      • Exhibit 24: Threat of substitutes – Impact of key factors in 2023 and 2028
    • 5.6 Threat of rivalry
      • Exhibit 25: Threat of rivalry – Impact of key factors in 2023 and 2028
    • 5.7 Market condition
      • Exhibit 26: Chart on Market condition - Five forces 2023 and 2028

    6 Market Segmentation by Distribution Channel

    • 6.1 Market segments
      • Exhibit 27: Chart on Distribution Channel - Market share 2023-2028 (%)
      • Exhibit 28: Data Table on Distribution Channel - Market share 2023-2028 (%)
    • 6.2 Comparison by Distribution Channel
      • Exhibit 29: Chart on Comparison by Distribution Channel
      • Exhibit 30: Data Table on Comparison by Distribution Channel
    • 6.3 Offline - Market size and forecast 2023-2028
      • Exhibit 31: Chart on Offline - Market size and forecast 2023-2028 ($ million)
      • Exhibit 32: Data Table on Offline - Market size and forecast 2023-2028 ($ million)
      • Exhibit 33: Chart on Offline - Year-over-year growth 2023-2028 (%)
      • Exhibit 34: Data Table on Offline - Year-over-year growth 2023-2028 (%)
    • 6.4 Online - Market size and forecast 2023-2028
      • Exhibit 35: Chart on Online - Market size and forecast 2023-2028 ($ million)
      • Exhibit 36: Data Table on Online - Market size and forecast 2023-2028 ($ million)
      • Exhibit 37: Chart on Online - Year-over-year growth 2023-2028 (%)
      • Exhibit 38: Data Table on Online - Year-over-year growth 2023-2028 (%)
    • 6.5 Market opportunity by Distribution Channel
      • Exhibit 39: Market opportunity by Distribution Channel ($ million)
      • Exhibit 40: Data Table on Market opportunity by Distribution Channel ($ million)

    7 Market Segmentation by Product

    • 7.1 Market segments
      • Exhibit 41: Chart on Product - Market share 2023-2028 (%)
      • Exhibit 42: Data Table on Product - Market share 2023-2028 (%)
    • 7.2 Comparison by Product
      • Exhibit 43: Chart on Comparison by Product
      • Exhibit 44: Data Table on Comparison by Product
    • 7.3 Conventional energy bars - Market size and forecast 2023-2028
      • Exhibit 45: Chart on Conventional energy bars - Market size and forecast 2023-2028 ($ million)
      • Exhibit 46: Data Table on Conventional energy bars - Market size and forecast 2023-2028 ($ million)
      • Exhibit 47: Chart on Conventional energy bars - Year-over-year growth 2023-2028 (%)
      • Exhibit 48: Data Table on Conventional energy bars - Year-over-year growth 2023-2028 (%)
    • 7.4 Organic energy bars - Market size and forecast 2023-2028
      • Exhibit 49: Chart on Organic energy bars - Market size and forecast 2023-2028 ($ million)
      • Exhibit 50: Data Table on Organic energy bars - Market size and forecast 2023-2028 ($ million)
      • Exhibit 51: Chart on Organic energy bars - Year-over-year growth 2023-2028 (%)
      • Exhibit 52: Data Table on Organic energy bars - Year-over-year growth 2023-2028 (%)
    • 7.5 Market opportunity by Product
      • Exhibit 53: Market opportunity by Product ($ million)
      • Exhibit 54: Data Table on Market opportunity by Product ($ million)

    8 Market Segmentation by Type

    • 8.1 Market segments
      • Exhibit 55: Chart on Type - Market share 2023-2028 (%)
      • Exhibit 56: Data Table on Type - Market share 2023-2028 (%)
    • 8.2 Comparison by Type
      • Exhibit 57: Chart on Comparison by Type
      • Exhibit 58: Data Table on Comparison by Type
    • 8.3 Protein bars - Market size and forecast 2023-2028
      • Exhibit 59: Chart on Protein bars - Market size and forecast 2023-2028 ($ million)
      • Exhibit 60: Data Table on Protein bars - Market size and forecast 2023-2028 ($ million)
      • Exhibit 61: Chart on Protein bars - Year-over-year growth 2023-2028 (%)
      • Exhibit 62: Data Table on Protein bars - Year-over-year growth 2023-2028 (%)
    • 8.4 Nutrition bars - Market size and forecast 2023-2028
      • Exhibit 63: Chart on Nutrition bars - Market size and forecast 2023-2028 ($ million)
      • Exhibit 64: Data Table on Nutrition bars - Market size and forecast 2023-2028 ($ million)
      • Exhibit 65: Chart on Nutrition bars - Year-over-year growth 2023-2028 (%)
      • Exhibit 66: Data Table on Nutrition bars - Year-over-year growth 2023-2028 (%)
    • 8.5 Cereal bars - Market size and forecast 2023-2028
      • Exhibit 67: Chart on Cereal bars - Market size and forecast 2023-2028 ($ million)
      • Exhibit 68: Data Table on Cereal bars - Market size and forecast 2023-2028 ($ million)
      • Exhibit 69: Chart on Cereal bars - Year-over-year growth 2023-2028 (%)
      • Exhibit 70: Data Table on Cereal bars - Year-over-year growth 2023-2028 (%)
    • 8.6 Fiber bars - Market size and forecast 2023-2028
      • Exhibit 71: Chart on Fiber bars - Market size and forecast 2023-2028 ($ million)
      • Exhibit 72: Data Table on Fiber bars - Market size and forecast 2023-2028 ($ million)
      • Exhibit 73: Chart on Fiber bars - Year-over-year growth 2023-2028 (%)
      • Exhibit 74: Data Table on Fiber bars - Year-over-year growth 2023-2028 (%)
    • 8.7 Market opportunity by Type
      • Exhibit 75: Market opportunity by Type ($ million)
      • Exhibit 76: Data Table on Market opportunity by Type ($ million)

    9 Customer Landscape

    • 9.1 Customer landscape overview
      • Exhibit 77: Analysis of price sensitivity, lifecycle, customer purchase basket, adoption rates, and purchase criteria

    10 Drivers, Challenges, and Trends

    • 10.1 Market drivers
      • 10.2 Market challenges
        • 10.3 Impact of drivers and challenges
          • Exhibit 78: Impact of drivers and challenges in 2023 and 2028
        • 10.4 Market trends

          11 Vendor Landscape

          • 11.1 Overview
            • 11.2 Vendor landscape
              • Exhibit 79: Overview on Criticality of inputs and Factors of differentiation
            • 11.3 Landscape disruption
              • Exhibit 80: Overview on factors of disruption
            • 11.4 Industry risks
              • Exhibit 81: Impact of key risks on business

            12 Vendor Analysis

            • 12.1 Vendors covered
              • Exhibit 82: Vendors covered
            • 12.2 Market positioning of vendors
              • Exhibit 83: Matrix on vendor position and classification
            • 12.3 Abbott Laboratories
              • Exhibit 84: Abbott Laboratories - Overview
              • Exhibit 85: Abbott Laboratories - Business segments
              • Exhibit 86: Abbott Laboratories - Key news
              • Exhibit 87: Abbott Laboratories - Key offerings
              • Exhibit 88: Abbott Laboratories - Segment focus
            • 12.4 Empact Bars
              • Exhibit 89: Empact Bars - Overview
              • Exhibit 90: Empact Bars - Product / Service
              • Exhibit 91: Empact Bars - Key offerings
            • 12.5 Garuka Bars
              • Exhibit 92: Garuka Bars - Overview
              • Exhibit 93: Garuka Bars - Product / Service
              • Exhibit 94: Garuka Bars - Key offerings
            • 12.6 General Mills Inc.
              • Exhibit 95: General Mills Inc. - Overview
              • Exhibit 96: General Mills Inc. - Business segments
              • Exhibit 97: General Mills Inc. - Key news
              • Exhibit 98: General Mills Inc. - Key offerings
              • Exhibit 99: General Mills Inc. - Segment focus
            • 12.7 Hormel Foods Corp.
              • Exhibit 100: Hormel Foods Corp. - Overview
              • Exhibit 101: Hormel Foods Corp. - Business segments
              • Exhibit 102: Hormel Foods Corp. - Key news
              • Exhibit 103: Hormel Foods Corp. - Key offerings
              • Exhibit 104: Hormel Foods Corp. - Segment focus
            • 12.8 Kates Real Food
              • Exhibit 105: Kates Real Food - Overview
              • Exhibit 106: Kates Real Food - Product / Service
              • Exhibit 107: Kates Real Food - Key offerings
            • 12.9 Kellogg Co.
              • Exhibit 108: Kellogg Co. - Overview
              • Exhibit 109: Kellogg Co. - Business segments
              • Exhibit 110: Kellogg Co. - Key news
              • Exhibit 111: Kellogg Co. - Key offerings
              • Exhibit 112: Kellogg Co. - Segment focus
            • 12.10 Lotus Bakeries NV
              • Exhibit 113: Lotus Bakeries NV - Overview
              • Exhibit 114: Lotus Bakeries NV - Product / Service
              • Exhibit 115: Lotus Bakeries NV - Key offerings
            • 12.11 Mars Inc.
              • Exhibit 116: Mars Inc. - Overview
              • Exhibit 117: Mars Inc. - Product / Service
              • Exhibit 118: Mars Inc. - Key news
              • Exhibit 119: Mars Inc. - Key offerings
            • 12.12 Mondelez International Inc.
              • Exhibit 120: Mondelez International Inc. - Overview
              • Exhibit 121: Mondelez International Inc. - Business segments
              • Exhibit 122: Mondelez International Inc. - Key news
              • Exhibit 123: Mondelez International Inc. - Key offerings
              • Exhibit 124: Mondelez International Inc. - Segment focus
            • 12.13 Nestle SA
              • Exhibit 125: Nestle SA - Overview
              • Exhibit 126: Nestle SA - Business segments
              • Exhibit 127: Nestle SA - Key news
              • Exhibit 128: Nestle SA - Key offerings
              • Exhibit 129: Nestle SA - Segment focus
            • 12.14 NuGo Nutrition
              • Exhibit 130: NuGo Nutrition - Overview
              • Exhibit 131: NuGo Nutrition - Product / Service
              • Exhibit 132: NuGo Nutrition - Key offerings
            • 12.15 PepsiCo Inc.
              • Exhibit 133: PepsiCo Inc. - Overview
              • Exhibit 134: PepsiCo Inc. - Business segments
              • Exhibit 135: PepsiCo Inc. - Key news
              • Exhibit 136: PepsiCo Inc. - Key offerings
              • Exhibit 137: PepsiCo Inc. - Segment focus
            • 12.16 Post Holdings Inc.
              • Exhibit 138: Post Holdings Inc. - Overview
              • Exhibit 139: Post Holdings Inc. - Business segments
              • Exhibit 140: Post Holdings Inc. - Key offerings
              • Exhibit 141: Post Holdings Inc. - Segment focus
            • 12.17 The Simply Good Foods Co.
              • Exhibit 142: The Simply Good Foods Co. - Overview
              • Exhibit 143: The Simply Good Foods Co. - Product / Service
              • Exhibit 144: The Simply Good Foods Co. - Key offerings

            13 Appendix

            • 13.1 Scope of the report
              • 13.2 Inclusions and exclusions checklist
                • Exhibit 145: Inclusions checklist
                • Exhibit 146: Exclusions checklist
              • 13.3 Currency conversion rates for US$
                • Exhibit 147: Currency conversion rates for US$
              • 13.4 Research methodology
                • Exhibit 148: Research methodology
                • Exhibit 149: Validation techniques employed for market sizing
                • Exhibit 150: Information sources
              • 13.5 List of abbreviations
                • Exhibit 151: List of abbreviations

              Research Methodology

              Technavio presents a detailed picture of the market by way of study, synthesis, and summation of data from multiple sources. The analysts have presented the various facets of the market with a particular focus on identifying the key industry influencers. The data thus presented is comprehensive, reliable, and the result of extensive research, both primary and secondary.

              INFORMATION SOURCES

              Primary sources

              • Manufacturers and suppliers
              • Channel partners
              • Industry experts
              • Strategic decision makers

              Secondary sources

              • Industry journals and periodicals
              • Government data
              • Financial reports of key industry players
              • Historical data
              • Press releases

              DATA ANALYSIS

              Data Synthesis

              • Collation of data
              • Estimation of key figures
              • Analysis of derived insights

              Data Validation

              • Triangulation with data models
              • Reference against proprietary databases
              • Corroboration with industry experts

              REPORT WRITING

              Qualitative

              • Market drivers
              • Market challenges
              • Market trends
              • Five forces analysis

              Quantitative

              • Market size and forecast
              • Market segmentation
              • Geographical insights
              • Competitive landscape

              Interested in this report?

              Get your sample now to see our research methodology and insights!

              Download Now

              Frequently Asked Questions

              Energy barin US market growth will increase by $ 879.59 mn during 2024-2028.

              The Energy barin US market is expected to grow at a CAGR of 4.6% during 2024-2028.

              Energy barin US market is segmented by Distribution Channel( Offline, Online) Product( Conventional energy bars, Organic energy bars) Type( Protein bars, Nutrition bars, Cereal bars, Fiber bars)

              Abbott Laboratories, Better Carob, Element Bars Inc., Empact Bars, Garuka Bars, General Mills Inc., Hormel Foods Corp., Kates Real Food, Kellogg Co., Lotus Bakeries NV, Mars Inc., Mondelez International Inc., Nestle SA, NuGo Nutrition, Post Holdings Inc., PROBAR LLC, The Balance Bar Co., The Simply Good Foods Co., Torq Performance Nutrition, PepsiCo Inc. are a few of the key vendors in the Energy barin US market.

              North America will register the highest growth rate of 100% among the other regions. Therefore, the Energy barin US market in North America is expected to garner significant business opportunities for the vendors during the forecast period.

              US, North America

              • Increasing demand for sports nutritionThe sports nutrition industry in the US is expanding rapidly due to an increasing consumer base is the driving factor this market.
              • which includes professional athletes and fitness enthusiasts. A balanced diet that includes carbohydrates is the driving factor this market.
              • dietary protein is the driving factor this market.
              • dietary fat is the driving factor this market.
              • vitamins is the driving factor this market.
              • and minerals meets the basic energy needs of athletes. Aside from the regular intake of dietary nutrients is the driving factor this market.
              • sports supplements such as shakes is the driving factor this market.
              • energy bars is the driving factor this market.
              • and other drinks are consumed as part of an enriched and fortified diet. The markets demographics are shifting away from core and casual users and toward lifestyle users. Professional athletes are considered core users is the driving factor this market.
              • whereas recreational athletes are classified as casual users. Energy bar patrons who participate in active lifestyle cultures are classified as lifestyle users is the driving factor this market.
              • while those who invest in technology-based solutions such as apps is the driving factor this market.
              • trackers is the driving factor this market.
              • and wearables are classified as mobile users. This expansion of the consumer group enables sports nutrition vendors to provide personalized solutions to their end-users via a diverse range of nutrition products. Energy bars and ready-to-drink products are essential sports nutrient products. Among these products is the driving factor this market.
              • protein powder accounts for the first position in terms of sales value. However is the driving factor this market.
              • energy bars showcase significant growth in the sports nutrition industry. The sales growth of sports energy bars is primarily attributed to the contributing factor that athletes seek multifunctional and better-tasting food supplements. Besides is the driving factor this market.
              • an increasing number of children are participating in athletic and sports activities is the driving factor this market.
              • which is contributing to the growth of the energy bar market in US. Therefore is the driving factor this market.
              • the increasing demand for sports nutrition is anticipated to drive the demand for energy bars is the driving factor this market.
              • which is the driving factor this market.
              • in turn is the driving factor this market.
              • will drive the growth of the energy bar market in US during the forecast period. is the driving factor this market.

              The Energy barin US market vendors should focus on grabbing business opportunities from the Offline segment as it accounted for the largest market share in the base year.
              RIA - Research AI Assistant
              Ask RIA