US Medical Display Monitors Market Size 2025-2029
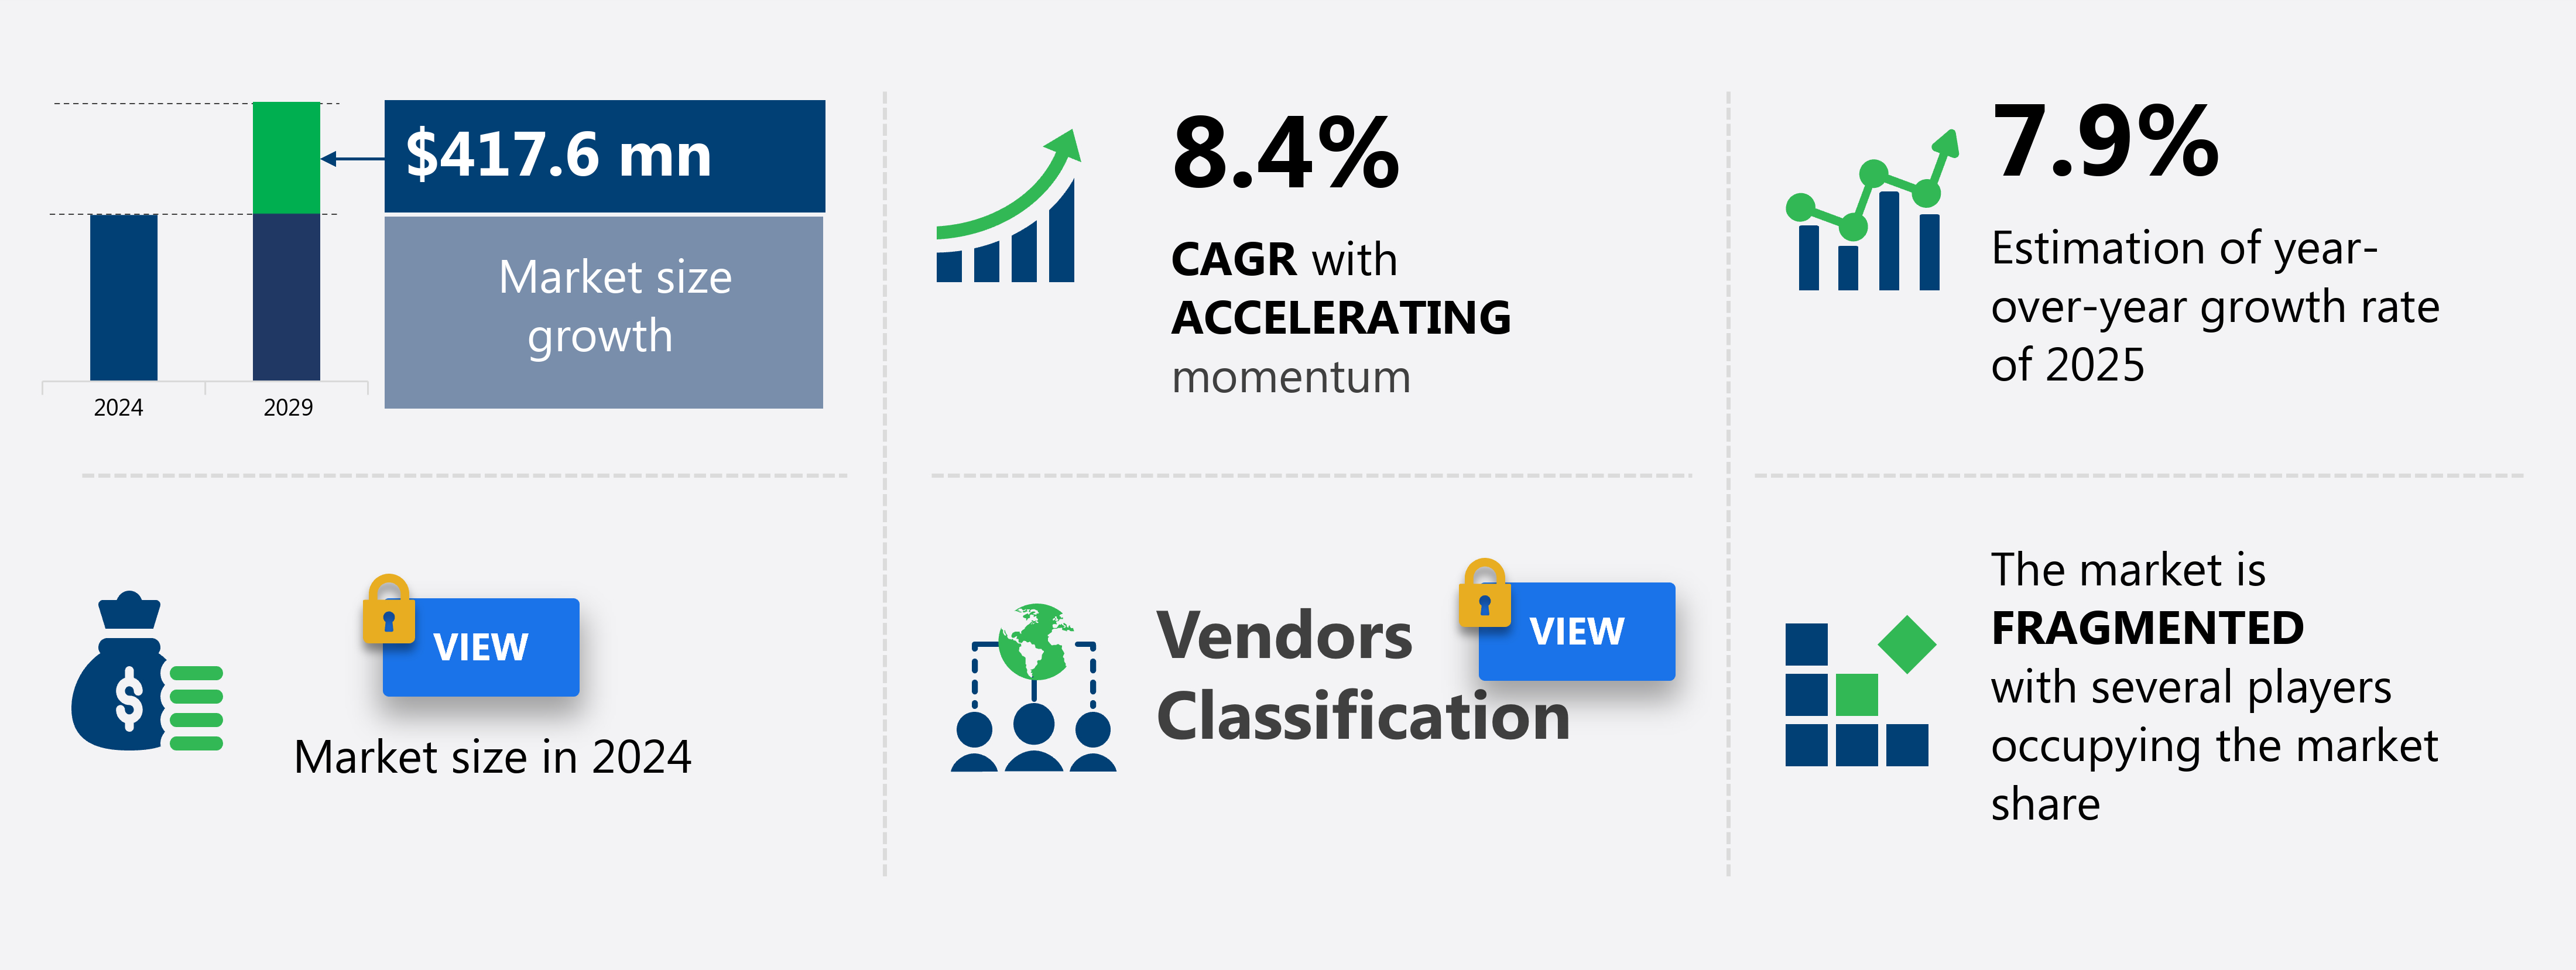
The US medical display monitors market size is forecast to increase by USD 417.6 million at a CAGR of 8.4% between 2024 and 2029.
- The Medical Display Monitors Market in the US is experiencing significant growth, driven by the increasing number of medical establishments and the rising demand for multimodality displays. These monitors enable medical professionals to access and analyze various medical images and data from different modalities in one place, enhancing diagnostic accuracy and efficiency. However, the high price of medical display monitors poses a significant challenge for market growth. Despite the cost, the potential benefits of these advanced displays make them an essential investment for healthcare providers seeking to improve patient care and outcomes. To capitalize on this market opportunity, companies must focus on developing cost-effective solutions while maintaining image quality and functionality.
- Additionally, collaborations and partnerships with medical equipment manufacturers and healthcare providers can help expand market reach and create new opportunities. Overall, the Medical Display Monitors Market in the US presents a promising landscape for innovation and growth, with a focus on cost-effective, multimodality solutions.
What will be the size of the US Medical Display Monitors Market during the forecast period?
Explore in-depth regional segment analysis with market size data - historical 2019-2023 and forecasts 2025-2029 - in the full report.
Request Free Sample
- The Medical Display Monitors market in the US is characterized by continuous advancements in technology and design. These monitors employ various display driver ICs and hardware acceleration techniques to ensure high image detail sharpness and display luminance levels. Data encryption methods and security features are integral to safeguarding sensitive patient data. User interface design is a significant focus, with stylus input support and touchscreen technology enabling intuitive interaction. Monitor thermal control and panel surface treatment ensure durability and longevity, with failure rate analysis and remote diagnostics facilitating efficient maintenance. Integrated speakers, microphone functionality, and ambient light sensors cater to multimedia applications, while remote control options and on-screen display menus enhance user convenience.
- Software compatibility, data transfer protocols, and power efficiency metrics are essential considerations for seamless integration into healthcare systems. Monitor lifespan is extended through advanced signal processing units and input signal converters. Multi-touch capabilities, video processing boards, image compression methods, and color accuracy testing further enhance functionality. Operating system support and color accuracy testing ensure compatibility with various clinical applications.
How is this market segmented?
The market research report provides comprehensive data (region-wise segment analysis), with forecasts and estimates in "USD million" for the period 2025-2029, as well as historical data from 2019-2023 for the following segments.
- Type
- Greyscale
- Color
- Technology
- LED
- OLED
- CCFL
- Application
- General radiology
- Mammography
- Surgery
- Others
- Product Type
- 2.1 to 4 MP
- 4.1 to 8 MP
- Up to 2 MP
- 8 MP and above
- End-user
- Hospitals
- Diagnostic imaging centers
- Specialty clinics
- Ambulatory surgical centers
- Others
- Geography
- North America
- US
- North America
By Type Insights
The greyscale segment is estimated to witness significant growth during the forecast period.
In the US medical display monitors market, grayscale monitors hold a substantial share due to their ease of use and effectiveness in the medical sector. Grayscale displays offer a range of shades from 4,096 to 65,536, enabling clear visualization of diagnostic images. The healthcare industry's increasing focus on improving workflow efficiency and ensuring accurate surgical procedures fuels the demand for these monitors. The prevalence of chronic diseases such as cancer and cardiovascular diseases further boosts the market's growth. Hospitals and surgical centers integrate medical-grade display monitors to enhance convenience and benefits. These monitors ensure optimal image viewing, particularly in operation theatres, contributing to faster and more precise diagnoses and surgical procedures.
Monitor resolution specs and viewing angle performance are crucial factors in medical display monitors. High-resolution displays provide clearer images, while wide viewing angles ensure consistent image quality from various angles. Display calibration tools help maintain image accuracy, while input lag measurement and refresh rate capability ensure smooth image rendering. Anti-glare screen filters reduce reflections, and image processing pipelines enhance image quality. Connectivity interfaces such as DisplayPort, HDMI, and USB facilitate seamless integration with various medical devices and systems. DICOM calibration and HL7 connectivity ensure compatibility with medical imaging systems, while VESA mount compatibility offers flexibility in mounting options.
Brightness uniformity and color gamut accuracy are essential for accurate image representation. IPS panel displays offer wide viewing angles and consistent color accuracy, making them popular in medical applications. OLED display technology provides high contrast ratios and energy efficiency, while PACS integration support streamlines workflows. Gamma correction curves and color temperature settings ensure image accuracy and consistency. LED backlight technology offers energy efficiency and a long lifespan. Pixel density measurement, adjustable monitor height, and ergonomic stand design enhance user experience and productivity. Radiology workstations integrate multiple monitors for comprehensive image viewing and analysis. Medical display monitors' power consumption rating is a crucial consideration for energy efficiency and cost savings.
Surgical display systems offer high brightness and contrast for optimal image viewing during procedures.
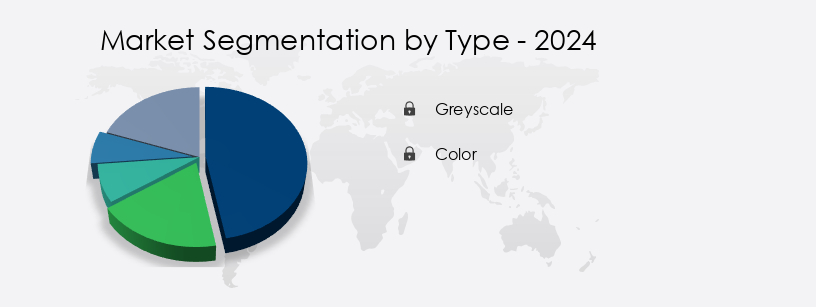
The Greyscale segment was valued at USD 527.70 million in 2019 and showed a gradual increase during the forecast period.
Market Dynamics
Our researchers analyzed the data with 2024 as the base year, along with the key drivers, trends, and challenges. A holistic analysis of drivers will help companies refine their marketing strategies to gain a competitive advantage.
What are the US Medical Display Monitors Market drivers leading to the rise in adoption of the Industry?
- The increasing prevalence of medical establishments serves as the primary catalyst for market growth.
- The global aging population is projected to significantly increase, with an estimated 82 million Americans aged 65 and above by 2050. This demographic shift, known as the silver wave, is driven by the baby boomer generation. As this population grows, the demand for medical facilities and infrastructure also increases. In response, investments in medical technology, particularly medical display monitors for medical image viewing, are on the rise. Medical display monitors are essential tools for healthcare professionals, enabling accurate and efficient diagnosis and treatment. These monitors come with various advanced features, such as power consumption rating, OLED display technology, PACS integration support, gamma correction curve, color temperature settings, and LED backlight technology, to meet the specific requirements of medical applications.
- DICOM Part 14 compliance is also a crucial factor in selecting medical display monitors, ensuring interoperability and data consistency. Surgical display systems are another type of medical display monitors that offer high-resolution images and advanced features, such as real-time image processing and multi-modality support. These systems are particularly useful in surgical procedures, where accurate and timely visualization of medical images is critical. In conclusion, the increasing aging population and the resulting demand for medical facilities and infrastructure are driving the growth of the medical display monitor market. Advanced features, such as OLED display technology, PACS integration support, and surgical display systems, are enhancing the capabilities of medical display monitors and improving patient outcomes.
What are the US Medical Display Monitors Market trends shaping the Industry?
- The increasing preference for multimodal displays represents a significant market trend. This trend is driven by the growing demand for advanced technologies that can effectively convey information using various modes, such as text, graphics, and audio.
- The medical display monitors market in the US is experiencing significant growth due to the increasing demand for advanced imaging solutions in healthcare. Radiology workstations, a key application area for these displays, require high pixel density measurements for accurate image interpretation. Multifunctional displays, which support both color and grayscale performance, are increasingly preferred in this field. These displays offer adjustable monitor heights, ergonomic stand designs, HDMI interface support, and USB connectivity options, enhancing user experience and productivity. Contrast ratio metrics and LCD panel technology ensure optimal image quality.
- The ability to calibrate image brightness, contrast, resolution, and grayscale settings allows for precise analysis of CT and MRI scans. These advanced features enable medical practitioners to make informed decisions in real-time, ultimately improving patient care.
How does US Medical Display Monitors Market faces challenges during its growth?
- The escalating cost of medical display monitors poses a significant challenge to the growth of the industry. In order to address this issue, innovations in technology and manufacturing processes are essential to make medical display monitors more affordable without compromising their quality and performance.
- Medical display monitors in the US market are recognized for their advanced features and stringent quality standards, which come at a premium price. These specialized monitors are essential for healthcare providers to ensure accurate diagnostics and high-quality patient care. The Barco Coronis Fusion MDCC-6530, a 6MP color LED display, and the LG Clinical Review Monitor, with an 8MP IPS display, are priced around USD 30,000 and USD 1,999, respectively. Larger displays used in Cath Labs and Hybrid Operating Rooms can cost up to USD 200,000 for a complete integration solution. The high costs are due to factors such as superior image quality, high resolution, and the ability to display multiple imaging applications simultaneously.
- Viewing angle performance, monitor resolution specs, and display calibration tools are crucial considerations for healthcare providers. Input lag measurement and refresh rate capability are also essential to ensure smooth image processing. Anti-glare screen filters are necessary to reduce reflections and improve visibility in various lighting conditions. Connectivity interfaces, including the DisplayPort interface, are important for seamless integration with various medical equipment and systems. These features contribute to the premium pricing of medical display monitors.
Exclusive US Medical Display Monitors Market Customer Landscape
The market forecasting report includes the adoption lifecycle of the market, covering from the innovator's stage to the laggard's stage. It focuses on adoption rates in different regions based on penetration. Furthermore, the report also includes key purchase criteria and drivers of price sensitivity to help companies evaluate and develop their market growth analysis strategies.
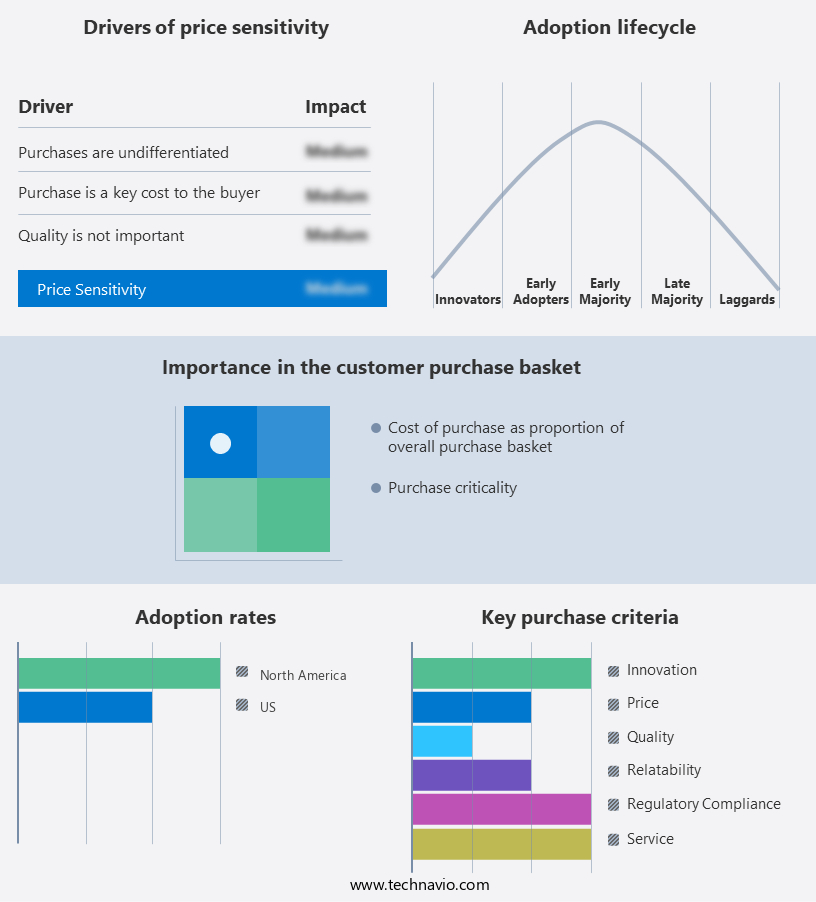
Customer Landscape
Key Companies & Market Insights
Companies are implementing various strategies, such as strategic alliances, market forecast partnerships, mergers and acquisitions, geographical expansion, and product/service launches, to enhance their presence in the market.
The market research and growth report includes detailed analyses of the competitive landscape of the market and information about key companies, including:
- Advantech Co. Ltd.
- ASUSTeK Computer Inc.
- Barco NV
- Dell Technologies Inc.
- Double Black Imaging
- Eizo Corp.
- FSN Medical Technologies
- FUJIFILM Holdings Corp.
- HP Inc.
- Koninklijke Philips NV
- LG Corp.
- Nanjing Jusha Commercial and Trading Co. Ltd.
- NDS Surgical Imaging
- Qisda Corp.
- Siemens Healthineers AG
- Sony Group Corp.
- TOTOKU INC
- ViewSonic Corp.
Qualitative and quantitative analysis of companies has been conducted to help clients understand the wider business environment as well as the strengths and weaknesses of key market players. Data is qualitatively analyzed to categorize companies as pure play, category-focused, industry-focused, and diversified; it is quantitatively analyzed to categorize companies as dominant, leading, strong, tentative, and weak.
Recent Development and News in Medical Display Monitors Market In US
- In January 2024, Barco, a global technology company, announced the launch of its new series of medical display monitors, the Nexxis MDM5222 and MDM5522, designed specifically for radiology and cardiology applications. These advanced monitors offer superior image quality and enhanced ergonomics (Barco Press Release, 2024).
- In March 2024, Philips and Cerner Corporation, two leading healthcare technology providers, entered into a strategic partnership to integrate Philips' medical display monitors into Cerner's electronic health record systems. This collaboration aims to improve clinical workflows and enhance the overall patient care experience (Philips Press Release, 2024).
- In May 2024, Planar Systems, a leading provider of display solutions, was acquired by Leyard Optoelectronic Co. Ltd, a Chinese technology company. This acquisition is expected to strengthen Leyard's presence in the medical display market and expand its product offerings (Leyard Press Release, 2024).
- In April 2025, the Food and Drug Administration (FDA) granted 510(k) clearance to Samsung's new series of medical display monitors, the SyncMaster 27T550. These monitors offer advanced features such as high resolution, wide color gamut, and calibration capabilities, making them suitable for various medical applications (Samsung Press Release, 2025).
Research Analyst Overview
The medical display monitor market in the US continues to evolve, driven by advancements in technology and the expanding application landscape. Monitor specifications, such as pixel density measurement and adjustable monitor height, are crucial factors in catering to the unique requirements of various sectors, including radiology and surgical applications. Radiology workstations demand high grayscale performance and HDMI interface support for seamless integration with imaging systems. Ergonomic stand designs and USB connectivity options ensure user comfort and convenience. Contrast ratio metrics and LCD panel technology are essential for delivering clear and accurate medical image viewing. Advancements in display calibration tools, input lag measurement, and refresh rate capability enhance the overall user experience.
Anti-glare screen filters, image processing pipelines, and connectivity interfaces, including DisplayPort, expand functionality and adaptability. Ongoing innovations include OLED display technology, PACS integration support, and DICOM calibration for improved color gamut accuracy and brightness uniformity. Surgical display systems leverage gamma correction curves and color temperature settings for precise image rendering. Power consumption ratings and LED backlight technology contribute to energy efficiency and cost savings. The medical display monitor market's continuous dynamism reflects the industry's commitment to delivering advanced solutions that cater to the evolving needs of healthcare professionals.
Dive into Technavio's robust research methodology, blending expert interviews, extensive data synthesis, and validated models for unparalleled Medical Display Monitors Market in US insights. See full methodology.
|
Market Scope |
|
|
Report Coverage |
Details |
|
Page number |
209 |
|
Base year |
2024 |
|
Historic period |
2019-2023 |
|
Forecast period |
2025-2029 |
|
Growth momentum & CAGR |
Accelerate at a CAGR of 8.4% |
|
Market growth 2025-2029 |
USD 417.6 million |
|
Market structure |
Fragmented |
|
YoY growth 2024-2025(%) |
7.9 |
|
Competitive landscape |
Leading Companies, Market Positioning of Companies, Competitive Strategies, and Industry Risks |
What are the Key Data Covered in this Market Research Report?
- CAGR of the market during the forecast period
- Detailed information on factors that will drive the market growth and forecasting between 2025 and 2029
- Precise estimation of the size of the market and its contribution of the market in focus to the parent market
- Accurate predictions about upcoming market growth and trends and changes in consumer behaviour
- Growth of the market across US
- Thorough analysis of the market's competitive landscape and detailed information about companies
- Comprehensive analysis of factors that will challenge the growth of market companies
We can help! Our analysts can customize this market research report to meet your requirements Get in touch
 RIA -
RIA - 
