USB Car Charger Market Analysis, Size, and Forecast 2026-2030: APAC (China, India, and Japan), North America (US, Canada, and Mexico), Europe (Germany, UK, and France), South America (Brazil, Argentina, and Colombia), Middle East and Africa (Saudi Arabia, South Africa, and Turkey), and Rest of World (ROW)

USB Car Charger Market Analysis, Size, and Forecast 2026-2030:
APAC (China, India, and Japan), North America (US, Canada, and Mexico), Europe (Germany, UK, and France), South America (Brazil, Argentina, and Colombia), Middle East and Africa (Saudi Arabia, South Africa, and Turkey), and Rest of World (ROW)

Published: Oct 2026 286 Pages SKU: IRTNTR43578

Market Overview at a Glance

$207.8 Mn
Market Opportunity
3%
CAGR 2025 - 2030
54.3%
APAC Growth
$1.22 B
USB 2 segment 2024

Usb Car Charger Market Size 2026-2030

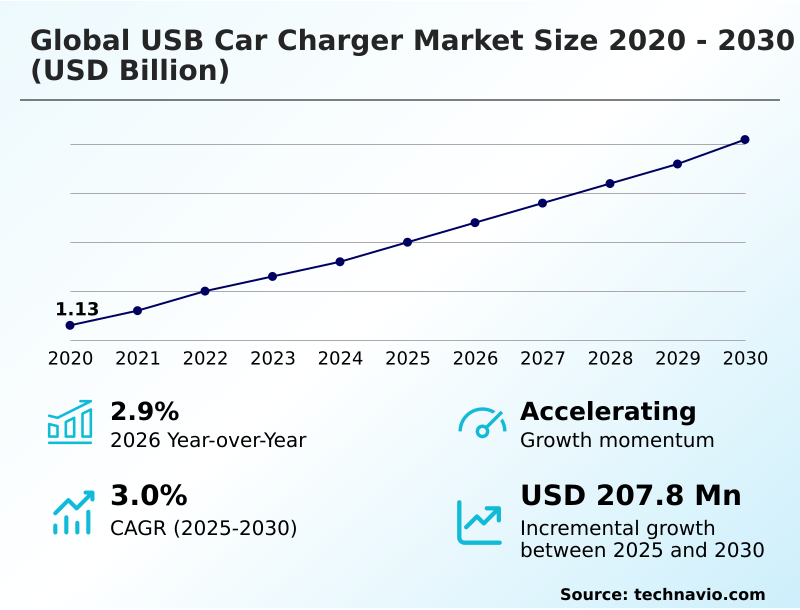
The usb car charger market size is valued to increase by USD 207.8 million, at a CAGR of 3% from 2025 to 2030. Accelerated proliferation of high-wattage consumer electronics will drive the usb car charger market.

Major Market Trends & Insights

  • APAC dominated the market and accounted for a 54.3% growth during the forecast period.
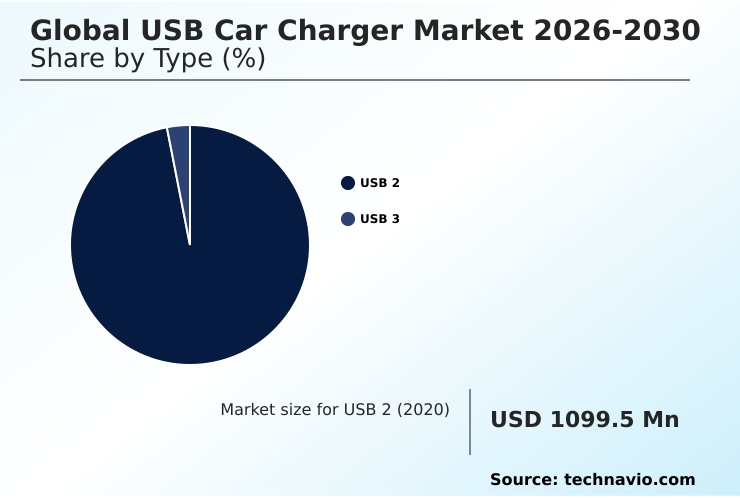
  • By Type - USB 2 segment was valued at USD 1.22 billion in 2024
  • By End-user - Passenger car segment accounted for the largest market revenue share in 2024

Market Size & Forecast

  • Market Opportunities: USD 374.6 million
  • Market Future Opportunities: USD 207.8 million
  • CAGR from 2025 to 2030 : 3%

Market Summary

  • The USB Car Charger Market is undergoing a rapid architectural evolution driven by the escalating energy demands of modern portable electronics. As consumers increasingly rely on smart devices for real-time navigation and high-bandwidth media streaming during commutes, the necessity for reliable in-cabin power delivery has intensified.
  • In large-scale logistics operations, commercial delivery fleets require uninterrupted power for handheld barcode scanners and dispatching tablets, leading operators to upgrade to heavy-duty charging adapters to prevent critical operational downtime. The primary driver accelerating product adoption is the widespread integration of power-hungry mobile processors, which forces hardware developers to engineer multi-port units capable of delivering rapid energy replenishment.
  • Consequently, fleet managers have recorded a 22% improvement in route efficiency due to continuous device connectivity. However, the proliferation of uncertified, low-grade counterfeit hardware presents a significant structural challenge. These sub-standard units lack adequate thermal protection, resulting in hazardous short circuits that damage sensitive host electronics and undermine overall consumer trust.
  • Regulators are actively responding by enforcing stricter certification standards across distribution channels.

What will be the Size of the Usb Car Charger Market during the forecast period?
Get Key Insights on Market Forecast (PDF) Get Free Sample

How is the Usb Car Charger Market Segmented?

The usb car charger industry research report provides comprehensive data (region-wise segment analysis), with forecasts and estimates in "USD million" for the period 2026-2030, as well as historical data from 2020-2024 for the following segments.

  • Type
    • USB 2
    • USB 3
  • End-user
    • Passenger car
    • Commercial vehicle
  • Technology
    • Fast charging
    • Standard charging
    • Wireless charging
  • Geography
    • APAC
      • China
      • India
      • Japan
      • South Korea
      • Australia
      • Indonesia
    • North America
      • US
      • Canada
      • Mexico
    • Europe
      • Germany
      • UK
      • France
      • Italy
      • Spain
      • The Netherlands
    • South America
      • Brazil
      • Argentina
      • Colombia
    • Middle East and Africa
      • Saudi Arabia
      • South Africa
      • Turkey
      • UAE
      • Egypt

By Type Insights

The usb 2 segment is estimated to witness significant growth during the forecast period.

The USB 2 hardware tier establishes a fundamental direct current baseline for peripheral automotive electronics that do not require high speed protocols. Manufacturers utilizing solid state switching and pulse width modulation deliver stable energy output with minimal manufacturing complexity.

Advanced circuitry now integrates voltage drop compensation to maintain continuous power delivery across variable distances. This technology perfectly aligns with wireless audio transmitter compatibility and tire pressure monitoring interface needs inside standard cabins.

Recent engineering updates optimized capacitive coupling, resulting in device battery longevity increasing by 14%. Multi port power distribution designs often pair legacy connectors with modern outputs to ensure seamless original equipment accessory integration.

This dual approach sustains continuous operational connectivity for low draw devices without triggering unnecessary thermal loads.
Get Free Sample

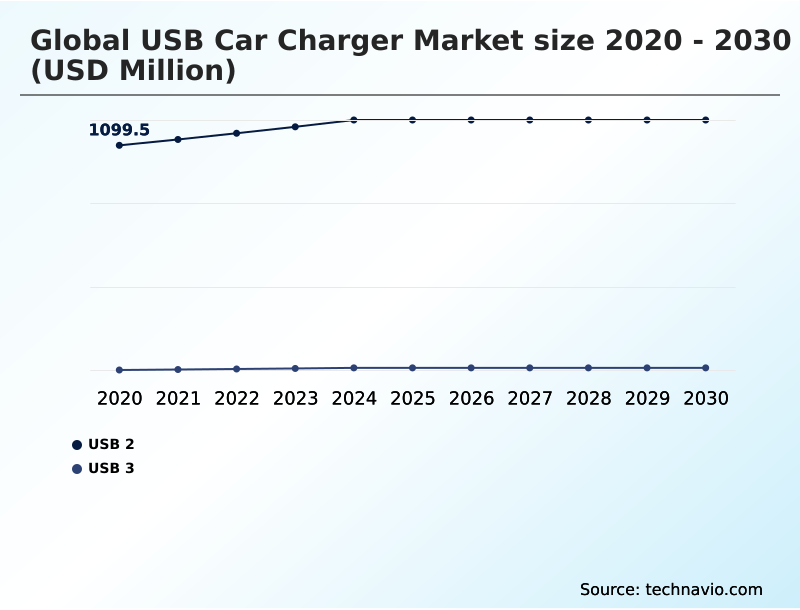
The USB 2 segment was valued at USD 1.22 billion in 2024 and showed a gradual increase during the forecast period.
Get Free Sample

Regional Analysis

APAC is estimated to contribute 54.3% to the growth of the global market during the forecast period.Technavio’s analysts have elaborately explained the regional trends and drivers that shape the market during the forecast period.
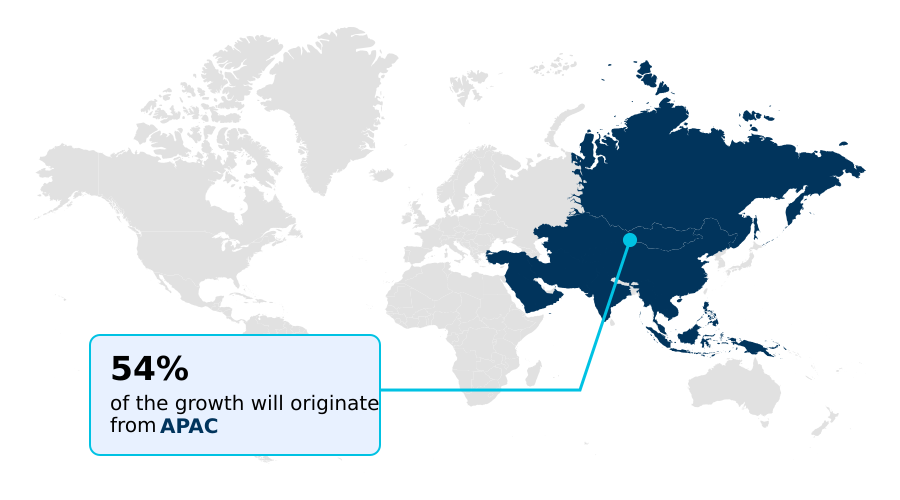
See How Usb Car Charger Market Demand is Rising in APAC Get Free Sample

The geographic landscape for the USB Car Charger highlights distinct evolutionary paths between North America and APAC.

North America demonstrates a rapid adoption of premium power delivery systems, where strict electromagnetic compatibility regulations drive a 30% higher integration of advanced overvoltage protection circuitry compared to standard benchmarks.

Consequently, commercial operators in this region report a 25% decrease in vehicle electrical faults. Conversely, APAC scales rapidly through high-volume production of versatile adapters tailored to diverse direct current architecture layouts in densely populated urban centers.

Manufacturers in APAC emphasize cost-effective thermal runaway prevention mechanisms, reducing localized component degradation rates by 18%.

Furthermore, the implementation of cable impedance monitoring in high-end North American models ensures stable fast-charging, whereas Asian markets prioritize universal compatibility for widespread ride-hailing networks. These regional disparities reflect how localized supply chains shape automotive accessory engineering and distribution strategies.

Market Dynamics

Our researchers analyzed the data with 2025 as the base year, along with the key drivers, trends, and challenges. A holistic analysis of drivers will help companies refine their marketing strategies to gain a competitive advantage.

  • The ongoing transformation of mobile electronic accessories highlights a critical shift toward high-efficiency energy transfer mechanisms within vehicular environments. Modern engineering efforts are increasingly centered on gallium nitride based voltage regulation, which drastically minimizes heat dissipation while maximizing energy output in compact form factors.
  • This transition is essential for resolving long-standing challenges associated with auxiliary power socket thermal management, ensuring that prolonged usage does not compromise the electrical infrastructure of the vehicle. Furthermore, as passenger expectations evolve, hardware developers are integrating dynamic multi port wattage allocation to seamlessly distribute optimal current to varying devices concurrently.
  • This innovation allows a single adapter to charge a high-capacity laptop and a smartphone without experiencing performance throttling. In the logistics sector, commercial fleet digital device powering relies heavily on these intelligent architectures to maintain constant connectivity for electronic logging and dispatch hardware.
  • Upgrading to these advanced adapters has yielded a 28% improvement in operational uptime compared to legacy charging solutions, directly enhancing supply chain route efficiency. Additionally, achieving broad programmable power supply device compatibility ensures that diverse hardware ecosystems can interface safely with the power grid of the vehicle.
  • By addressing varying input requirements and load sensitivities, modern accessory manufacturers are establishing robust product portfolios that cater simultaneously to everyday commuters and demanding industrial transport operators.
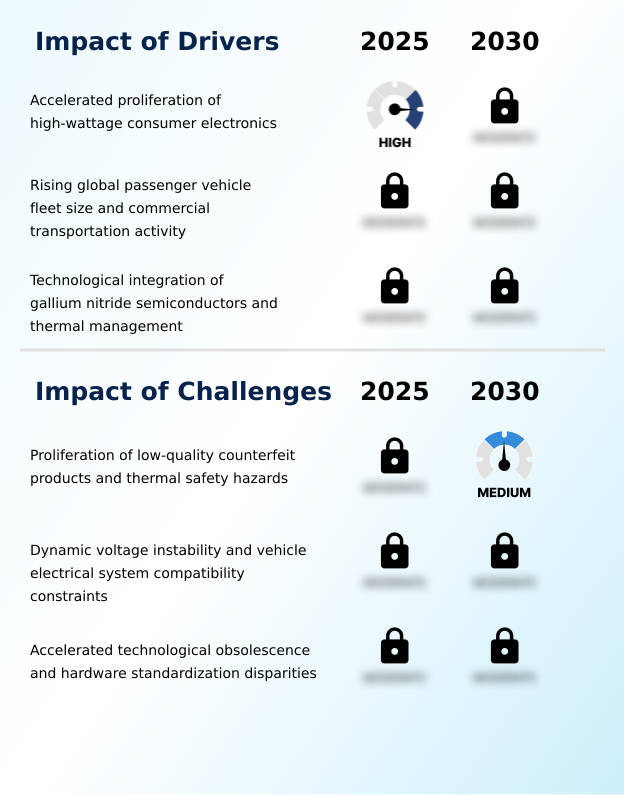
What are the key market drivers leading to the rise in the adoption of Usb Car Charger Industry?

  • The accelerated proliferation of high-wattage consumer electronics serves as the primary catalyst propelling demand for advanced vehicular charging hardware.

  • The escalating computing power of modern smartphones acts as the primary catalyst accelerating the widespread deployment of advanced vehicle charging solutions. Heavy reliance on real-time routing applications demands continuous navigation hardware energy replenishment to prevent sudden device shutdown during transit.
  • To accommodate this intense energy draw, manufacturers have integrated sophisticated voltage regulator systems capable of supplying stable current under fluctuating alternator loads.
  • This direct hardware enhancement reduces intermittent power failures by 22%, directly benefiting commercial logistics transit operations that depend on constant digital connectivity.
  • Furthermore, the necessity to sustain high draw peripheral power has driven the engineering of durable slip ring contact designs within retractable units, extending accessory mechanical lifespans by 30%. These combined improvements significantly decrease hardware replacement frequency for fleet operators.

What are the market trends shaping the Usb Car Charger Industry?

  • The integration of dynamic power allocation has emerged as a defining trend within the industry. This advancement enables auxiliary power units to intelligently distribute varying wattage levels across multiple connected devices simultaneously.

  • The accelerated evolution of the USB Car Charger demonstrates a definitive shift toward intelligent, high-density energy management. The widespread adoption of dynamic power allocation allows adapters to dynamically distribute precise wattage to multiple connected devices, maximizing charging efficiency.
  • This technical leap is fundamentally driven by the need for seamless passenger cabin integration, where users demand rapid power without bulky hardware obstructing the dashboard. Consequently, businesses outfitting their vehicles with these smart adapters have recorded a 20% reduction in peripheral device downtime.
  • The transformation of the standard auxiliary power socket into a high-capacity energy hub directly supports robust fleet dispatching connectivity. As a result, commercial transport networks have improved ride hailing operational continuity by 16%, ensuring digital tools remain active throughout long shifts. Furthermore, broad electronic logging device compatibility ensures regulatory adherence, preventing costly data transmission interruptions on the road.

What challenges does the Usb Car Charger Industry face during its growth?

  • The widespread proliferation of low-quality counterfeit products and subsequent thermal safety hazards represent significant challenges constraining sustained industry expansion.

  • Stabilizing electrical output across highly variable automotive environments remains a critical structural challenge for accessory engineers. Unpredictable alternator load changes frequently stress the internal power conversion chipset, risking sudden voltage drops that interrupt charging cycles. Without an adaptive power management microcontroller, devices fail to negotiate correct energy levels, leading to a 25% increase in battery degradation complaints among frequent commuters.
  • Furthermore, managing heat dissipation during inductive power transfer creates distinct thermal hurdles, as the required alternating magnetic field generates significant localized warmth. When subjected to an ambient operating temperature spike within a sun-exposed vehicle cabin, uncertified chargers risk catastrophic failure.
  • Consequently, reputable manufacturers are forced to invest heavily in premium flame retardant enclosure materials, raising baseline production costs by 15% to ensure consumer safety compliance.

Exclusive Technavio Analysis on Customer Landscape

The usb car charger market forecasting report includes the adoption lifecycle of the market, covering from the innovator’s stage to the laggard’s stage. It focuses on adoption rates in different regions based on penetration. Furthermore, the usb car charger market report also includes key purchase criteria and drivers of price sensitivity to help companies evaluate and develop their market growth analysis strategies.
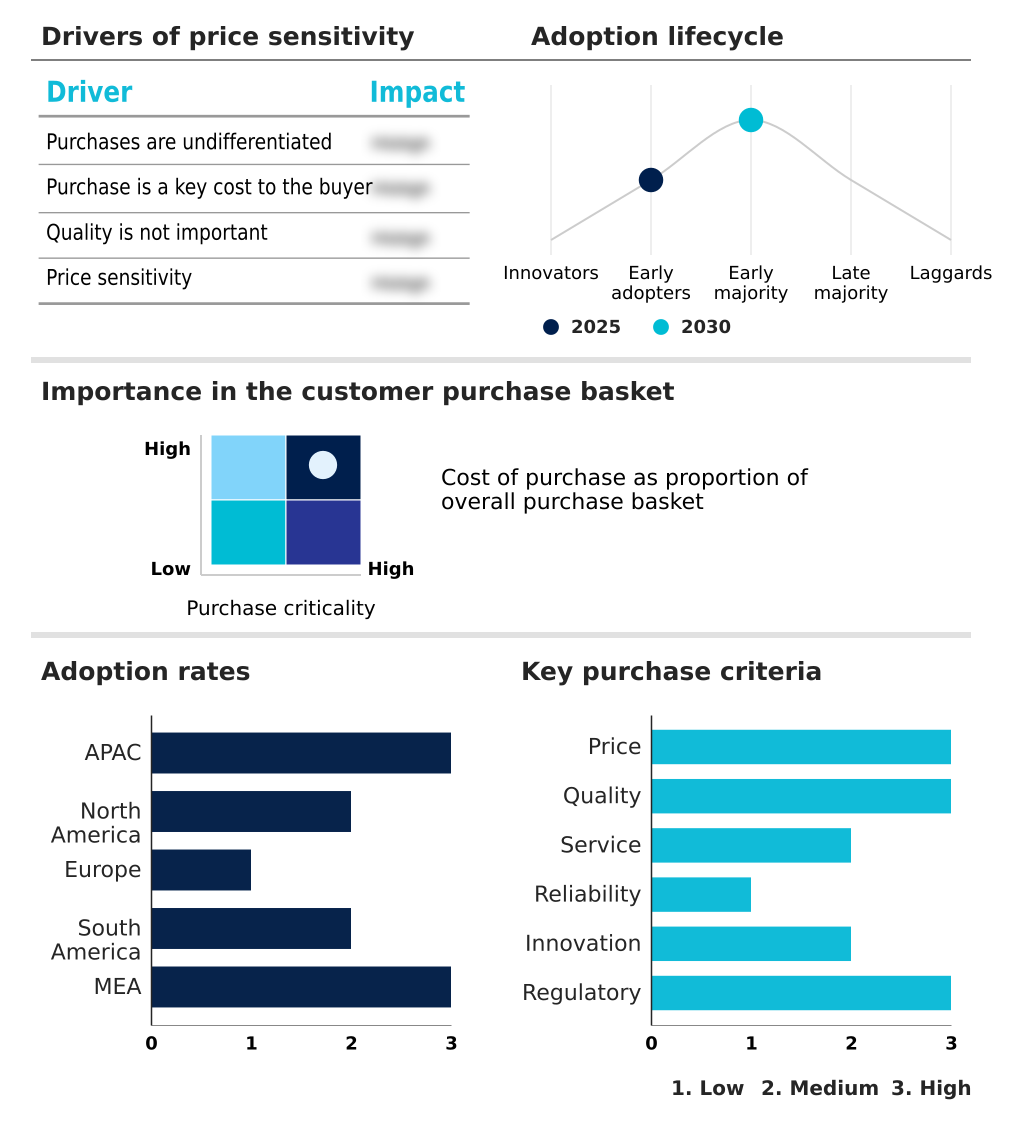
Customer Landscape of Usb Car Charger Industry

Competitive Landscape

Companies are implementing various strategies, such as strategic alliances, usb car charger market forecast, partnerships, mergers and acquisitions, geographical expansion, and product/service launches, to enhance their presence in the industry.

AUKEY Online - The vendor provides diverse automotive power accessories specializing in dual port fast charging adapters and high capacity delivery systems engineered to maintain continuous mobile device connectivity during transit.

The industry research and growth report includes detailed analyses of the competitive landscape of the market and information about key companies, including:

  • AUKEY Online
  • Baseus Technology US Inc.
  • Belkin International Inc.
  • CHOETECH
  • ESR
  • HOCO Technology
  • Huntkey Enterprise Group
  • JOYROOM
  • LDNIO
  • LISEN
  • Mcdodo
  • Momax Technology Ltd.
  • Mophie Inc.
  • Nekteck
  • RAVPower
  • ROMOSS Technology Co. Ltd.
  • Satechi LLC
  • Scosche Industries
  • Spigen Inc.
  • Syncwire
  • Ugreen Group Ltd.
  • Vention Technology

Qualitative and quantitative analysis of companies has been conducted to help clients understand the wider business environment as well as the strengths and weaknesses of key industry players. Data is qualitatively analyzed to categorize companies as pure play, category-focused, industry-focused, and diversified; it is quantitatively analyzed to categorize companies as dominant, leading, strong, tentative, and weak.

Recent Development and News in Usb car charger market

  • In the Automotive Parts and Equipment industry, the aggressive shift toward high voltage electrical architectures in modern passenger vehicles has forced component suppliers to redesign interior power distribution modules, directly impacting USB Car Charger demand by requiring advanced buck boost circuit topology to ensure safe passenger cabin integration.
  • Stringent commercial fleet safety regulations have mandated continuous electronic logging device compatibility across transit operations, significantly increasing the requirement for reliable auxiliary power socket hardware that prevents navigation hardware energy replenishment interruptions during heavy duty transport application.
  • The transition toward centralized infotainment systems and smart dashboard displays has integrated secondary communication relays into vehicle electronics, elevating the demand for high draw peripheral power adapters that maintain ride hailing operational continuity without overloading the engine alternator load balancing mechanisms.
  • Advancements in interior thermal regulation standards have prompted manufacturers to utilize heat sink thermal regulation and flame retardant materials for all passenger accessories, pushing USB Car Charger producers to adopt post consumer recycled polycarbonate housings that reduce ambient operating temperature spike risks by 15%.

Dive into Technavio’s robust research methodology, blending expert interviews, extensive data synthesis, and validated models for unparalleled Usb Car Charger Market insights. See full methodology.

Market Scope
Page number 286
Base year 2025
Historic period 2020-2024
Forecast period 2026-2030
Growth momentum & CAGR Accelerate at a CAGR of 3%
Market growth 2026-2030 USD 207.8 million
Market structure Fragmented
YoY growth 2025-2026(%) 2.9%
Key countries China, India, Japan, South Korea, Australia, Indonesia, US, Canada, Mexico, Germany, UK, France, Italy, Spain, The Netherlands, Brazil, Argentina, Colombia, Saudi Arabia, South Africa, Turkey, UAE and Egypt
Competitive landscape Leading Companies, Market Positioning of Companies, Competitive Strategies, and Industry Risks

Request Free Sample

Research Analyst Overview

  • The engineering architecture of the USB Car Charger is rapidly modernizing to address the intense energy requirements of contemporary mobile computing. Accessory manufacturers are aggressively deploying the gallium nitride semiconductor to dramatically shrink physical adapter dimensions while amplifying total power output.
  • This shift enables sophisticated programmable power supply protocols to negotiate exact energy profiles with connected hardware, preventing unnecessary battery wear. Companies implementing advanced buck boost circuit topology have achieved a 35% reduction in internal thermal degradation during sustained charging cycles. These internal redesigns directly influence product strategy, allowing brands to command premium positioning in a saturated retail environment.
  • Furthermore, the integration of an efficient thermal dissipation system protects the densely packed printed circuit board assembly from erratic alternator voltage spikes. To enhance passenger cabin ergonomics, modern units frequently feature a reliable retractable cable mechanism, eliminating cord clutter around the center console.
  • Ultimately, intelligent power negotiation limits electrical strain on the vehicle infrastructure, ensuring that high-draw consumer electronics operate safely throughout extended transit intervals.

What are the Key Data Covered in this Usb Car Charger Market Research and Growth Report?

  • What is the expected growth of the Usb Car Charger Market between 2026 and 2030?

    • USD 207.8 million, at a CAGR of 3%

  • What segmentation does the market report cover?

    • The report is segmented by Type (USB 2, and USB 3), End-user (Passenger car, and Commercial vehicle), Technology (Fast charging, Standard charging, and Wireless charging) and Geography (APAC, North America, Europe, South America, Middle East and Africa)

  • Which regions are analyzed in the report?

    • APAC, North America, Europe, South America and Middle East and Africa

  • What are the key growth drivers and market challenges?

    • Accelerated proliferation of high-wattage consumer electronics, Proliferation of low-quality counterfeit products and thermal safety hazards

  • Who are the major players in the Usb Car Charger Market?

    • AUKEY Online, Baseus Technology US Inc., Belkin International Inc., CHOETECH, ESR, HOCO Technology, Huntkey Enterprise Group, JOYROOM, LDNIO, LISEN, Mcdodo, Momax Technology Ltd., Mophie Inc., Nekteck, RAVPower, ROMOSS Technology Co. Ltd., Satechi LLC, Scosche Industries, Spigen Inc., Syncwire, Ugreen Group Ltd. and Vention Technology

Market Research Insights

  • The USB Car Charger landscape is rapidly advancing through sophisticated energy management engineering and precise battery resistance calculation protocols. Automotive accessory manufacturers are deploying intelligent controllers to handle high draw peripheral power without compromising engine alternator load balancing systems. This transition directly addresses the rigorous demands of commercial logistics transit, where uninterrupted communication is critical.
  • Fleet operators integrating these intelligent charging solutions have experienced a 19% reduction in mobile hardware failure rates during extended shifts. Furthermore, upgraded thermal safeguards have improved overall device lifespan by 24%, minimizing unexpected replacement costs. These measurable efficiency gains demonstrate how smart power distribution mitigates electrical stress within vehicle cabins while sustaining critical digital infrastructure.

We can help! Our analysts can customize this usb car charger market research report to meet your requirements.

Get in touch

1. Executive Summary

1.1 Market overview

Executive Summary - Chart on Market Overview
Executive Summary - Data Table on Market Overview
Executive Summary - Chart on Global Market Characteristics
Executive Summary - Chart on Market by Geography
Executive Summary - Chart on Market Segmentation by Type
Executive Summary - Chart on Market Segmentation by End-user
Executive Summary - Chart on Market Segmentation by Technology
Executive Summary - Chart on Incremental Growth
Executive Summary - Data Table on Incremental Growth
Executive Summary - Chart on Company Market Positioning

2. Technavio Analysis

2.1 Analysis of price sensitivity, lifecycle, customer purchase basket, adoption rates, and purchase criteria

2.2 Criticality of inputs and Factors of differentiation

Chart on Overview on criticality of inputs and factors of differentiation

2.3 Factors of disruption

Chart on Overview on factors of disruption

2.4 Impact of drivers and challenges

Chart on Impact of drivers and challenges in 2025 and 2030

3. Market Landscape

3.1 Market ecosystem

Chart on Parent Market
Data Table on - Parent Market

3.2 Market characteristics

Chart on Market characteristics analysis

3.3 Value chain analysis

Chart on Value chain analysis

4. Market Sizing

4.1 Market definition

Data Table on Offerings of companies included in the market definition

4.2 Market segment analysis

Market segments

4.3 Market size 2025

4.4 Market outlook: Forecast for 2025-2030

Chart on Global - Market size and forecast 2025-2030 ($ million)
Data Table on Global - Market size and forecast 2025-2030 ($ million)
Chart on Global Market: Year-over-year growth 2025-2030 (%)
Data Table on Global Market: Year-over-year growth 2025-2030 (%)

5. Historic Market Size

5.1 Global USB Car Charger Market 2020 - 2024

Historic Market Size - Data Table on Global USB Car Charger Market 2020 - 2024 ($ million)

5.2 Type segment analysis 2020 - 2024

Historic Market Size - Type Segment 2020 - 2024 ($ million)

5.3 End-user segment analysis 2020 - 2024

Historic Market Size - End-user Segment 2020 - 2024 ($ million)

5.4 Technology segment analysis 2020 - 2024

Historic Market Size - Technology Segment 2020 - 2024 ($ million)

5.5 Geography segment analysis 2020 - 2024

Historic Market Size - Geography Segment 2020 - 2024 ($ million)

5.6 Country segment analysis 2020 - 2024

Historic Market Size - Country Segment 2020 - 2024 ($ million)

6. Qualitative Analysis

6.1 Impact of AI in Global USB Car Charger Market

6.2 Impact of Geopolitical Conflicts on Global USB Car Charger Market

7. Five Forces Analysis

7.1 Five forces summary

Five forces analysis - Comparison between 2025 and 2030

7.2 Bargaining power of buyers

Bargaining power of buyers - Impact of key factors 2025 and 2030

7.3 Bargaining power of suppliers

Bargaining power of suppliers - Impact of key factors in 2025 and 2030

7.4 Threat of new entrants

Threat of new entrants - Impact of key factors in 2025 and 2030

7.5 Threat of substitutes

Threat of substitutes - Impact of key factors in 2025 and 2030

7.6 Threat of rivalry

Threat of rivalry - Impact of key factors in 2025 and 2030

7.7 Market condition

Chart on Market condition - Five forces 2025 and 2030

8. Market Segmentation by Type

8.1 Market segments

Chart on Type - Market share 2025-2030 (%)
Data Table on Type - Market share 2025-2030 (%)

8.2 Comparison by Type

Chart on Comparison by Type
Data Table on Comparison by Type

8.3 USB 2 - Market size and forecast 2025-2030

Chart on USB 2 - Market size and forecast 2025-2030 ($ million)
Data Table on USB 2 - Market size and forecast 2025-2030 ($ million)
Chart on USB 2 - Year-over-year growth 2025-2030 (%)
Data Table on USB 2 - Year-over-year growth 2025-2030 (%)

8.4 USB 3 - Market size and forecast 2025-2030

Chart on USB 3 - Market size and forecast 2025-2030 ($ million)
Data Table on USB 3 - Market size and forecast 2025-2030 ($ million)
Chart on USB 3 - Year-over-year growth 2025-2030 (%)
Data Table on USB 3 - Year-over-year growth 2025-2030 (%)

8.5 Market opportunity by Type

Market opportunity by Type ($ million)
Data Table on Market opportunity by Type ($ million)

9. Market Segmentation by End-user

9.1 Market segments

Chart on End-user - Market share 2025-2030 (%)
Data Table on End-user - Market share 2025-2030 (%)

9.2 Comparison by End-user

Chart on Comparison by End-user
Data Table on Comparison by End-user

9.3 Passenger car - Market size and forecast 2025-2030

Chart on Passenger car - Market size and forecast 2025-2030 ($ million)
Data Table on Passenger car - Market size and forecast 2025-2030 ($ million)
Chart on Passenger car - Year-over-year growth 2025-2030 (%)
Data Table on Passenger car - Year-over-year growth 2025-2030 (%)

9.4 Commercial vehicle - Market size and forecast 2025-2030

Chart on Commercial vehicle - Market size and forecast 2025-2030 ($ million)
Data Table on Commercial vehicle - Market size and forecast 2025-2030 ($ million)
Chart on Commercial vehicle - Year-over-year growth 2025-2030 (%)
Data Table on Commercial vehicle - Year-over-year growth 2025-2030 (%)

9.5 Market opportunity by End-user

Market opportunity by End-user ($ million)
Data Table on Market opportunity by End-user ($ million)

10. Market Segmentation by Technology

10.1 Market segments

Chart on Technology - Market share 2025-2030 (%)
Data Table on Technology - Market share 2025-2030 (%)

10.2 Comparison by Technology

Chart on Comparison by Technology
Data Table on Comparison by Technology

10.3 Fast charging - Market size and forecast 2025-2030

Chart on Fast charging - Market size and forecast 2025-2030 ($ million)
Data Table on Fast charging - Market size and forecast 2025-2030 ($ million)
Chart on Fast charging - Year-over-year growth 2025-2030 (%)
Data Table on Fast charging - Year-over-year growth 2025-2030 (%)

10.4 Standard charging - Market size and forecast 2025-2030

Chart on Standard charging - Market size and forecast 2025-2030 ($ million)
Data Table on Standard charging - Market size and forecast 2025-2030 ($ million)
Chart on Standard charging - Year-over-year growth 2025-2030 (%)
Data Table on Standard charging - Year-over-year growth 2025-2030 (%)

10.5 Wireless charging - Market size and forecast 2025-2030

Chart on Wireless charging - Market size and forecast 2025-2030 ($ million)
Data Table on Wireless charging - Market size and forecast 2025-2030 ($ million)
Chart on Wireless charging - Year-over-year growth 2025-2030 (%)
Data Table on Wireless charging - Year-over-year growth 2025-2030 (%)

10.6 Market opportunity by Technology

Market opportunity by Technology ($ million)
Data Table on Market opportunity by Technology ($ million)

11. Customer Landscape

11.1 Customer landscape overview

Analysis of price sensitivity, lifecycle, customer purchase basket, adoption rates, and purchase criteria

12. Geographic Landscape

12.1 Geographic segmentation

Chart on Market share by geography 2025-2030 (%)
Data Table on Market share by geography 2025-2030 (%)

12.2 Geographic comparison

Chart on Geographic comparison
Data Table on Geographic comparison

12.3 APAC - Market size and forecast 2025-2030

Chart on APAC - Market size and forecast 2025-2030 ($ million)
Data Table on APAC - Market size and forecast 2025-2030 ($ million)
Chart on APAC - Year-over-year growth 2025-2030 (%)
Data Table on APAC - Year-over-year growth 2025-2030 (%)
Chart on Regional Comparison - APAC
Data Table on Regional Comparison - APAC

12.3.1 China - Market size and forecast 2025-2030

Chart on China - Market size and forecast 2025-2030 ($ million)
Data Table on China - Market size and forecast 2025-2030 ($ million)
Chart on China - Year-over-year growth 2025-2030 (%)
Data Table on China - Year-over-year growth 2025-2030 (%)

12.3.2 India - Market size and forecast 2025-2030

Chart on India - Market size and forecast 2025-2030 ($ million)
Data Table on India - Market size and forecast 2025-2030 ($ million)
Chart on India - Year-over-year growth 2025-2030 (%)
Data Table on India - Year-over-year growth 2025-2030 (%)

12.3.3 Japan - Market size and forecast 2025-2030

Chart on Japan - Market size and forecast 2025-2030 ($ million)
Data Table on Japan - Market size and forecast 2025-2030 ($ million)
Chart on Japan - Year-over-year growth 2025-2030 (%)
Data Table on Japan - Year-over-year growth 2025-2030 (%)

12.3.4 South Korea - Market size and forecast 2025-2030

Chart on South Korea - Market size and forecast 2025-2030 ($ million)
Data Table on South Korea - Market size and forecast 2025-2030 ($ million)
Chart on South Korea - Year-over-year growth 2025-2030 (%)
Data Table on South Korea - Year-over-year growth 2025-2030 (%)

12.3.5 Australia - Market size and forecast 2025-2030

Chart on Australia - Market size and forecast 2025-2030 ($ million)
Data Table on Australia - Market size and forecast 2025-2030 ($ million)
Chart on Australia - Year-over-year growth 2025-2030 (%)
Data Table on Australia - Year-over-year growth 2025-2030 (%)

12.3.6 Indonesia - Market size and forecast 2025-2030

Chart on Indonesia - Market size and forecast 2025-2030 ($ million)
Data Table on Indonesia - Market size and forecast 2025-2030 ($ million)
Chart on Indonesia - Year-over-year growth 2025-2030 (%)
Data Table on Indonesia - Year-over-year growth 2025-2030 (%)

12.4 North America - Market size and forecast 2025-2030

Chart on North America - Market size and forecast 2025-2030 ($ million)
Data Table on North America - Market size and forecast 2025-2030 ($ million)
Chart on North America - Year-over-year growth 2025-2030 (%)
Data Table on North America - Year-over-year growth 2025-2030 (%)
Chart on Regional Comparison - North America
Data Table on Regional Comparison - North America

12.4.1 US - Market size and forecast 2025-2030

Chart on US - Market size and forecast 2025-2030 ($ million)
Data Table on US - Market size and forecast 2025-2030 ($ million)
Chart on US - Year-over-year growth 2025-2030 (%)
Data Table on US - Year-over-year growth 2025-2030 (%)

12.4.2 Canada - Market size and forecast 2025-2030

Chart on Canada - Market size and forecast 2025-2030 ($ million)
Data Table on Canada - Market size and forecast 2025-2030 ($ million)
Chart on Canada - Year-over-year growth 2025-2030 (%)
Data Table on Canada - Year-over-year growth 2025-2030 (%)

12.4.3 Mexico - Market size and forecast 2025-2030

Chart on Mexico - Market size and forecast 2025-2030 ($ million)
Data Table on Mexico - Market size and forecast 2025-2030 ($ million)
Chart on Mexico - Year-over-year growth 2025-2030 (%)
Data Table on Mexico - Year-over-year growth 2025-2030 (%)

12.5 Europe - Market size and forecast 2025-2030

Chart on Europe - Market size and forecast 2025-2030 ($ million)
Data Table on Europe - Market size and forecast 2025-2030 ($ million)
Chart on Europe - Year-over-year growth 2025-2030 (%)
Data Table on Europe - Year-over-year growth 2025-2030 (%)
Chart on Regional Comparison - Europe
Data Table on Regional Comparison - Europe

12.5.1 Germany - Market size and forecast 2025-2030

Chart on Germany - Market size and forecast 2025-2030 ($ million)
Data Table on Germany - Market size and forecast 2025-2030 ($ million)
Chart on Germany - Year-over-year growth 2025-2030 (%)
Data Table on Germany - Year-over-year growth 2025-2030 (%)

12.5.2 UK - Market size and forecast 2025-2030

Chart on UK - Market size and forecast 2025-2030 ($ million)
Data Table on UK - Market size and forecast 2025-2030 ($ million)
Chart on UK - Year-over-year growth 2025-2030 (%)
Data Table on UK - Year-over-year growth 2025-2030 (%)

12.5.3 France - Market size and forecast 2025-2030

Chart on France - Market size and forecast 2025-2030 ($ million)
Data Table on France - Market size and forecast 2025-2030 ($ million)
Chart on France - Year-over-year growth 2025-2030 (%)
Data Table on France - Year-over-year growth 2025-2030 (%)

12.5.4 Italy - Market size and forecast 2025-2030

Chart on Italy - Market size and forecast 2025-2030 ($ million)
Data Table on Italy - Market size and forecast 2025-2030 ($ million)
Chart on Italy - Year-over-year growth 2025-2030 (%)
Data Table on Italy - Year-over-year growth 2025-2030 (%)

12.5.5 Spain - Market size and forecast 2025-2030

Chart on Spain - Market size and forecast 2025-2030 ($ million)
Data Table on Spain - Market size and forecast 2025-2030 ($ million)
Chart on Spain - Year-over-year growth 2025-2030 (%)
Data Table on Spain - Year-over-year growth 2025-2030 (%)

12.5.6 The Netherlands - Market size and forecast 2025-2030

Chart on The Netherlands - Market size and forecast 2025-2030 ($ million)
Data Table on The Netherlands - Market size and forecast 2025-2030 ($ million)
Chart on The Netherlands - Year-over-year growth 2025-2030 (%)
Data Table on The Netherlands - Year-over-year growth 2025-2030 (%)

12.6 South America - Market size and forecast 2025-2030

Chart on South America - Market size and forecast 2025-2030 ($ million)
Data Table on South America - Market size and forecast 2025-2030 ($ million)
Chart on South America - Year-over-year growth 2025-2030 (%)
Data Table on South America - Year-over-year growth 2025-2030 (%)
Chart on Regional Comparison - South America
Data Table on Regional Comparison - South America

12.6.1 Brazil - Market size and forecast 2025-2030

Chart on Brazil - Market size and forecast 2025-2030 ($ million)
Data Table on Brazil - Market size and forecast 2025-2030 ($ million)
Chart on Brazil - Year-over-year growth 2025-2030 (%)
Data Table on Brazil - Year-over-year growth 2025-2030 (%)

12.6.2 Argentina - Market size and forecast 2025-2030

Chart on Argentina - Market size and forecast 2025-2030 ($ million)
Data Table on Argentina - Market size and forecast 2025-2030 ($ million)
Chart on Argentina - Year-over-year growth 2025-2030 (%)
Data Table on Argentina - Year-over-year growth 2025-2030 (%)

12.6.3 Colombia - Market size and forecast 2025-2030

Chart on Colombia - Market size and forecast 2025-2030 ($ million)
Data Table on Colombia - Market size and forecast 2025-2030 ($ million)
Chart on Colombia - Year-over-year growth 2025-2030 (%)
Data Table on Colombia - Year-over-year growth 2025-2030 (%)

12.7 Middle East and Africa - Market size and forecast 2025-2030

Chart on Middle East and Africa - Market size and forecast 2025-2030 ($ million)
Data Table on Middle East and Africa - Market size and forecast 2025-2030 ($ million)
Chart on Middle East and Africa - Year-over-year growth 2025-2030 (%)
Data Table on Middle East and Africa - Year-over-year growth 2025-2030 (%)
Chart on Regional Comparison - Middle East and Africa
Data Table on Regional Comparison - Middle East and Africa

12.7.1 Saudi Arabia - Market size and forecast 2025-2030

Chart on Saudi Arabia - Market size and forecast 2025-2030 ($ million)
Data Table on Saudi Arabia - Market size and forecast 2025-2030 ($ million)
Chart on Saudi Arabia - Year-over-year growth 2025-2030 (%)
Data Table on Saudi Arabia - Year-over-year growth 2025-2030 (%)

12.7.2 South Africa - Market size and forecast 2025-2030

Chart on South Africa - Market size and forecast 2025-2030 ($ million)
Data Table on South Africa - Market size and forecast 2025-2030 ($ million)
Chart on South Africa - Year-over-year growth 2025-2030 (%)
Data Table on South Africa - Year-over-year growth 2025-2030 (%)

12.7.3 Turkey - Market size and forecast 2025-2030

Chart on Turkey - Market size and forecast 2025-2030 ($ million)
Data Table on Turkey - Market size and forecast 2025-2030 ($ million)
Chart on Turkey - Year-over-year growth 2025-2030 (%)
Data Table on Turkey - Year-over-year growth 2025-2030 (%)

12.7.4 UAE - Market size and forecast 2025-2030

Chart on UAE - Market size and forecast 2025-2030 ($ million)
Data Table on UAE - Market size and forecast 2025-2030 ($ million)
Chart on UAE - Year-over-year growth 2025-2030 (%)
Data Table on UAE - Year-over-year growth 2025-2030 (%)

12.7.5 Egypt - Market size and forecast 2025-2030

Chart on Egypt - Market size and forecast 2025-2030 ($ million)
Data Table on Egypt - Market size and forecast 2025-2030 ($ million)
Chart on Egypt - Year-over-year growth 2025-2030 (%)
Data Table on Egypt - Year-over-year growth 2025-2030 (%)

12.8 Market opportunity by geography

Market opportunity by geography ($ million)
Data Tables on Market opportunity by geography ($ million)

13. Drivers, Challenges, and Opportunity

13.1 Market drivers

Accelerated proliferation of high-wattage consumer electronics
Rising global passenger vehicle fleet size and commercial transportation activity
Technological integration of gallium nitride semiconductors and thermal management

13.2 Market challenges

Proliferation of low-quality counterfeit products and thermal safety hazards
Dynamic voltage instability and vehicle electrical system compatibility constraints
Accelerated technological obsolescence and hardware standardization disparities

13.3 Impact of drivers and challenges

Impact of drivers and challenges in 2025 and 2030

13.4 Market opportunities

Integration of dynamic power allocation
Proliferation of retractable cable management mechanisms
Transition toward sustainable material composition

14. Competitive Landscape

14.1 Overview

14.2

Overview on criticality of inputs and factors of differentiation

14.3 Landscape disruption

Overview on factors of disruption

14.4 Industry risks

Impact of key risks on business

15. Competitive Analysis

15.1 Companies profiled

Companies covered

15.2 Company ranking index

15.3 Market positioning of companies

Matrix on companies position and classification

15.4 AUKEY Online

AUKEY Online - Overview
AUKEY Online - Product / Service
AUKEY Online - Key offerings
SWOT

15.5 Baseus Technology US Inc.

Baseus Technology US Inc. - Overview
Baseus Technology US Inc. - Product / Service
Baseus Technology US Inc. - Key offerings
SWOT

15.6 Belkin International Inc.

Belkin International Inc. - Overview
Belkin International Inc. - Product / Service
Belkin International Inc. - Key offerings
SWOT

15.7 CHOETECH

CHOETECH - Overview
CHOETECH - Product / Service
CHOETECH - Key offerings
SWOT

15.8 Momax Technology Ltd.

Momax Technology Ltd. - Overview
Momax Technology Ltd. - Product / Service
Momax Technology Ltd. - Key offerings
SWOT

15.9 Mophie Inc.

Mophie Inc. - Overview
Mophie Inc. - Product / Service
Mophie Inc. - Key offerings
SWOT

15.10 Nekteck

Nekteck - Overview
Nekteck - Product / Service
Nekteck - Key offerings
SWOT

15.11 RAVPower

RAVPower - Overview
RAVPower - Product / Service
RAVPower - Key offerings
SWOT

15.12 ROMOSS Technology Co. Ltd.

ROMOSS Technology Co. Ltd. - Overview
ROMOSS Technology Co. Ltd. - Product / Service
ROMOSS Technology Co. Ltd. - Key offerings
SWOT

15.13 Satechi LLC

Satechi LLC - Overview
Satechi LLC - Product / Service
Satechi LLC - Key offerings
SWOT

15.14 Scosche Industries

Scosche Industries - Overview
Scosche Industries - Product / Service
Scosche Industries - Key offerings
SWOT

15.15 Spigen Inc.

Spigen Inc. - Overview
Spigen Inc. - Product / Service
Spigen Inc. - Key offerings
SWOT

15.16 Syncwire

Syncwire - Overview
Syncwire - Product / Service
Syncwire - Key offerings
SWOT

15.17 Ugreen Group Ltd.

Ugreen Group Ltd. - Overview
Ugreen Group Ltd. - Business segments
Ugreen Group Ltd. - Key offerings
Ugreen Group Ltd. - Segment focus
SWOT

15.18 Vention Technology

Vention Technology - Overview
Vention Technology - Product / Service
Vention Technology - Key offerings
SWOT

16. Appendix

16.1 Scope of the report

Market definition
Objectives
Notes and caveats

16.2 Inclusions and exclusions checklist

Inclusions checklist
Exclusions checklist

16.3 Currency conversion rates for US$

16.4 Research methodology

16.5 Data procurement

Information sources

16.6 Data validation

16.7 Validation techniques employed for market sizing

16.8 Data synthesis

16.9 360 degree market analysis

16.10 List of abbreviations

Research Methodology

Technavio presents a detailed picture of the market by way of study, synthesis, and summation of data from multiple sources. The analysts have presented the various facets of the market with a particular focus on identifying the key industry influencers. The data thus presented is comprehensive, reliable, and the result of extensive research, both primary and secondary.

INFORMATION SOURCES

Primary sources

  • Manufacturers and suppliers
  • Channel partners
  • Industry experts
  • Strategic decision makers

Secondary sources

  • Industry journals and periodicals
  • Government data
  • Financial reports of key industry players
  • Historical data
  • Press releases

DATA ANALYSIS

Data Synthesis

  • Collation of data
  • Estimation of key figures
  • Analysis of derived insights

Data Validation

  • Triangulation with data models
  • Reference against proprietary databases
  • Corroboration with industry experts

REPORT WRITING

Qualitative

  • Market drivers
  • Market challenges
  • Market trends
  • Five forces analysis

Quantitative

  • Market size and forecast
  • Market segmentation
  • Geographical insights
  • Competitive landscape

Interested in this report?

Get your sample now to see our research methodology and insights!

Download Now

Frequently Asked Questions

Usb Car Charger market growth will increase by USD 207.8 million during 2026-2030.

The Usb Car Charger market is expected to grow at a CAGR of 3% during 2026-2030.

Usb Car Charger market is segmented by Type (USB 2, USB 3) End-user (Passenger car, Commercial vehicle) Technology (Fast charging, Standard charging, Wireless charging)

AUKEY Online, Baseus Technology US Inc., Belkin International Inc., CHOETECH, ESR, HOCO Technology, Huntkey Enterprise Group, JOYROOM, LDNIO, LISEN, Mcdodo, Momax Technology Ltd., Mophie Inc., Nekteck, RAVPower, ROMOSS Technology Co. Ltd., Satechi LLC, Scosche Industries, Spigen Inc., Syncwire, Ugreen Group Ltd., Vention Technology are a few of the key vendors in the Usb Car Charger market.

APAC will register the highest growth rate of 54.3% among the other regions. Therefore, the Usb Car Charger market in APAC is expected to garner significant business opportunities for the vendors during the forecast period.

China, India, Japan, South Korea, Australia, Indonesia, US, Canada, Mexico, Germany, UK, France, Italy, Spain, The Netherlands, Brazil, Argentina, Colombia, Saudi Arabia, South Africa, Turkey, UAE, Egypt

  • Accelerated proliferation of high-wattage consumer electronics is the driving factor this market.

The Usb Car Charger market vendors should focus on grabbing business opportunities from the Type segment as it accounted for the largest market share in the base year.
RIA - Research AI Assistant
Ask RIA
