
Used Aircraft Market Size 2026-2030
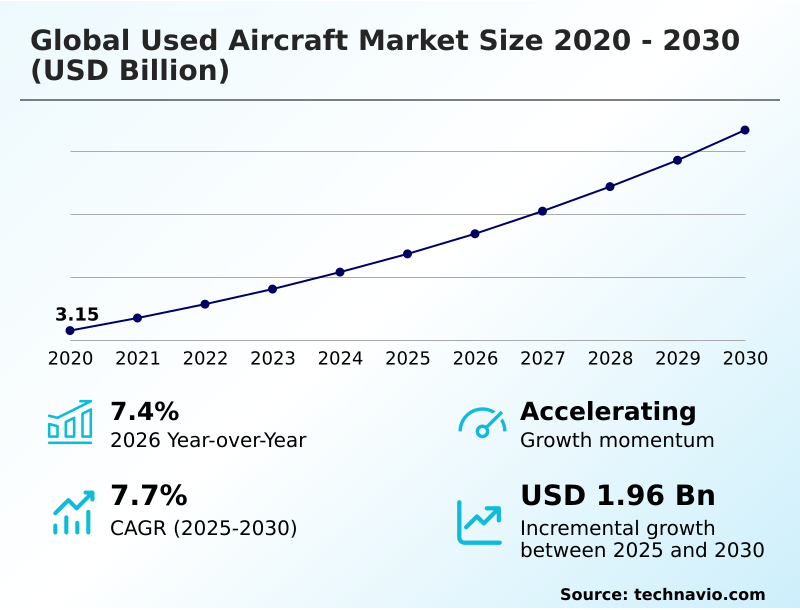
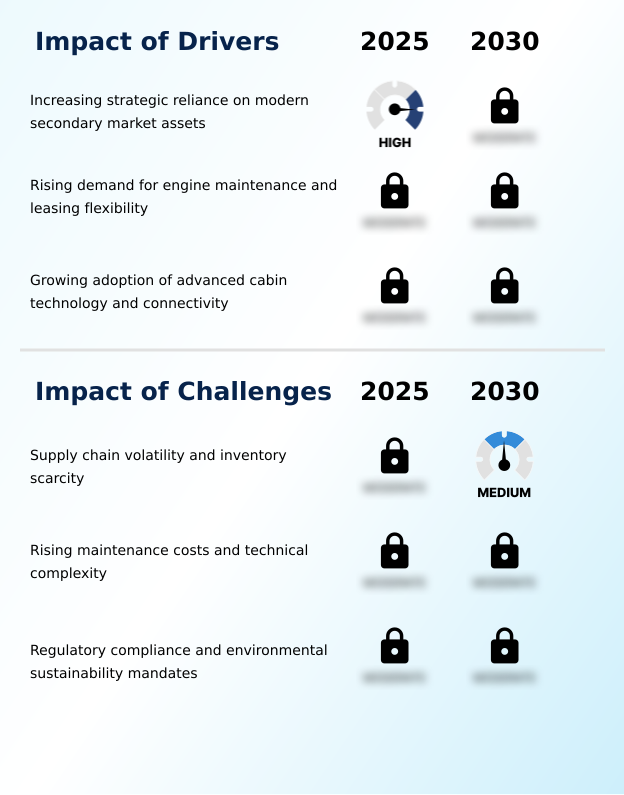
The used aircraft market size is valued to increase by USD 1.96 billion, at a CAGR of 7.7% from 2025 to 2030. Increasing strategic reliance on modern secondary market assets will drive the used aircraft market.
Major Market Trends & Insights
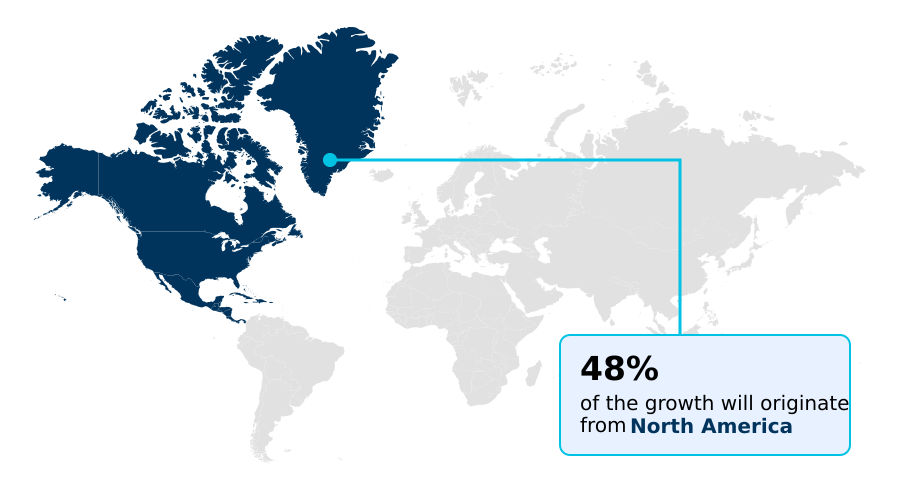
- North America dominated the market and accounted for a 47.5% growth during the forecast period.
- By Product - 0-15 years segment was valued at USD 1.76 billion in 2024
- By Application - Civil aviation segment accounted for the largest market revenue share in 2024
Market Size & Forecast
- Market Opportunities: USD 3.19 billion
- Market Future Opportunities: USD 1.96 billion
- CAGR from 2025 to 2030 : 7.7%
Market Summary
- The used aircraft market is a critical component of the aerospace ecosystem, providing airlines and private operators with cost-effective alternatives to new fleet acquisitions. This market is driven by the rising demand for air travel and the strategic need for established carriers to manage capacity amid supply chain delays for new models.
- A key business scenario involves a regional airline leveraging the secondary market to rapidly deploy narrow body aircraft, bypassing long OEM lead times and achieving immediate network expansion. This strategy is supported by sophisticated aircraft financing and aircraft leasing models. Innovations in engine leasing solutions and predictive maintenance are extending the operational life and economic viability of mid-life aircraft.
- However, challenges such as rising maintenance costs, a scarcity of high-quality inventory, and stringent aviation regulatory compliance for legacy airframes impact asset availability and total cost of ownership. The growing professionalization of aircraft remarketing, focusing on avionics upgrades and modern aircraft cabin technology, ensures that preowned business jets and commercial airliners remain competitive.
- The integration of digital asset monitoring and transparent maintenance records, like digital logbooks, is also reducing acquisition risk and enhancing aircraft residual value, making the secondary aircraft market an increasingly attractive and stable investment landscape.
What will be the Size of the Used Aircraft Market during the forecast period?
Get Key Insights on Market Forecast (PDF) Get Free Sample
How is the Used Aircraft Market Segmented?
The used aircraft industry research report provides comprehensive data (region-wise segment analysis), with forecasts and estimates in "USD million" for the period 2026-2030, as well as historical data from 2020-2024 for the following segments.
- Product
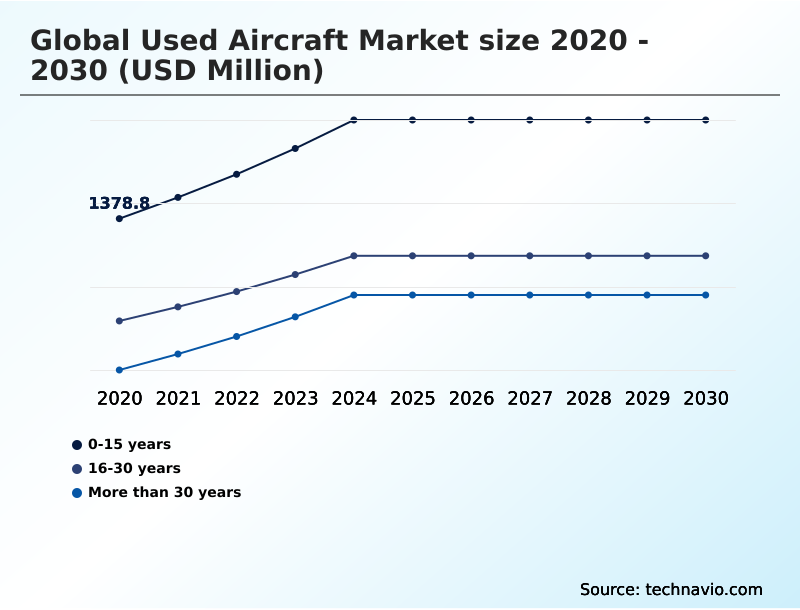
- 0-15 years
- 16-30 years
- More than 30 years
- Application
- Civil aviation
- Military aviation
- Others
- Aircraft type
- Fixed-wing aircraft
- Rotary-wing aircraft
- Others
- Geography
- North America
- US
- Canada
- Mexico
- Europe
- Germany
- UK
- France
- APAC
- China
- Japan
- India
- Middle East and Africa
- UAE
- Saudi Arabia
- South Africa
- South America
- Brazil
- Argentina
- Colombia
- Rest of World (ROW)
- North America
By Product Insights
The 0-15 years segment is estimated to witness significant growth during the forecast period.
The 0-15 years segment represents the most technologically advanced and sought-after portion of the secondary aerospace market.
Premium commercial airlines and corporate flight departments prioritize these assets for their operational reliability, modern avionics, and fuel efficiency, bypassing the long lead times of new deliveries.
Financial institutions favor these aircraft due to higher aircraft residual value and lower risk profiles. Demand is high for preowned business jets and modern narrow body aircraft.
The integration of sustainable aviation fuel capabilities in these younger models appeals to companies focused on aviation regulatory compliance.
Robust demand is shown by a recent 11% rise in average transaction prices for premium used twin-engine helicopters, indicating a strong appetite for high-quality, preowned assets and effective aviation asset management.
This segment, supported by OEM certified pre-owned programs and aircraft leasing, is crucial for fleet modernization.
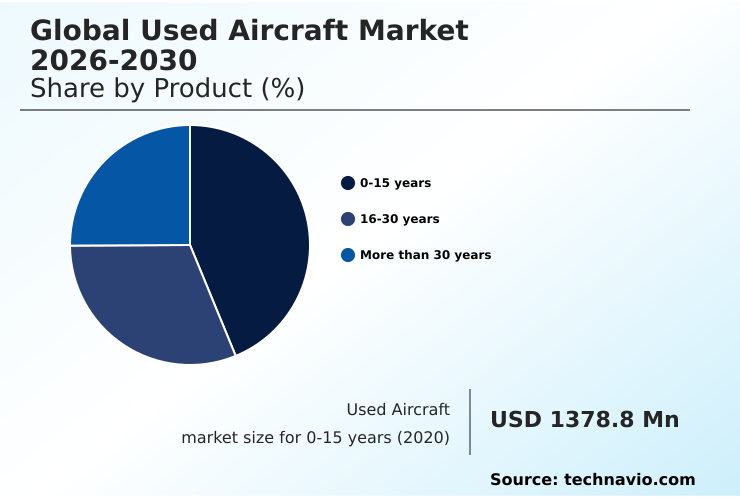
The 0-15 years segment was valued at USD 1.76 billion in 2024 and showed a gradual increase during the forecast period.
Regional Analysis
North America is estimated to contribute 47.5% to the growth of the global market during the forecast period.Technavio’s analysts have elaborately explained the regional trends and drivers that shape the market during the forecast period.
See How Used Aircraft Market Demand is Rising in North America Get Free Sample
The geographic landscape of the global used aircraft market is led by North America, which accounts for over 47% of the incremental growth, driven by a mature infrastructure for aircraft MRO services and aircraft financing.
Europe follows, with a strong focus on environmental noise regulations and fleet modernization. The APAC region is the fastest-growing secondary aircraft market, with air travel demand fueling the need for rapid capacity expansion.
Here, passenger to freighter conversions have increased, with some MROs reporting a 20% rise in conversion bookings to support logistics. This process is supported by a growing market for used serviceable material.
South America and MEA rely on the preowned market for cost-effective turboprop utility aircraft and narrow body aircraft to enhance connectivity.
Market Dynamics
Our researchers analyzed the data with 2025 as the base year, along with the key drivers, trends, and challenges. A holistic analysis of drivers will help companies refine their marketing strategies to gain a competitive advantage.
- Navigating the global used aircraft market 2026-2030 requires a deep understanding of its multifaceted financial and operational landscape. A primary consideration for potential buyers is the total cost of owning a used jet, which extends far beyond the initial purchase price to include maintenance, insurance, and hangarage.
- The passenger to freighter conversion process has become a significant value-add, with logistics companies closely analyzing the ROI of converting mid-life airbus a320 models versus acquiring purpose-built freighters. Financing for used commercial aircraft is a specialized field, where lenders scrutinize an asset's age, maintenance history documented in its digital logbook for aircraft history, and compliance with upcoming mandates.
- In emerging markets, the demand for the best used turboprop for short runways is high, as these aircraft provide essential connectivity. A key trend involves exploring avionics upgrade options for older jets to enhance safety and efficiency, making them compliant with modern airspace requirements. For operators, maintaining a mid-life airbus a320 involves strategic planning around heavy checks and engine overhauls.
- The impact of SAF on used aircraft value is a growing discussion, as environmental compliance becomes a critical factor in asset liquidity. Businesses often weigh leasing versus buying used aircraft to optimize capital allocation. Furthermore, finding reliable used helicopter parts and navigating regulatory hurdles for used aircraft sales are significant challenges.
- Professional business jet remarketing services are essential for maximizing returns, often highlighting trends in used aircraft cabin interiors to attract buyers. Finally, predictive maintenance for aging fleets is no longer a luxury but a necessity for ensuring airworthiness and managing operational costs effectively, a task more manageable with a thorough digital logbook for aircraft history.
- Sourcing reliable parts is easier than navigating regulatory hurdles, which can delay transactions by up to six months compared to domestic sales.
What are the key market drivers leading to the rise in the adoption of Used Aircraft Industry?
- The market is primarily driven by an increasing strategic reliance on modern secondary market assets, as operators seek immediate and cost-effective solutions to manage capacity requirements.
- A primary driver for the used aircraft market is the strategic reliance on secondary market assets to bypass new production delays, which exceed 36 months for some models. This allows for immediate capacity management and fleet modernization.
- The demand for flexible aircraft MRO services, especially engine leasing solutions, propels the secondary aircraft market by extending the life of mid-life aircraft and lowering annual maintenance budgets by up to 20%. Another significant driver is upgrading aircraft cabin technology.
- Retrofitting older airframes with high-speed connectivity and modern inflight entertainment systems is critical, with studies showing a 10% increase in customer satisfaction on upgraded aircraft.
What are the market trends shaping the Used Aircraft Industry?
- Advancements in predictive maintenance and digital asset monitoring are an upcoming market trend, enhancing the residual value and operational readiness of preowned airframes through data-driven decision-making.
- Key trends in the used aircraft market revolve around technological integration and asset management. The adoption of predictive maintenance and digital asset monitoring is paramount, with platforms leveraging AI to analyze real-time health data, reducing unscheduled maintenance by up to 25%. Innovations in engine leasing solutions and aircraft leasing offer financial flexibility, reducing overhaul costs by over 50%.
- The professionalization of business jet remarketing is also a major trend, where specialized firms manage the lifecycle from avionics upgrades to cabin refurbishments. This has stabilized the market for preowned business jets, with effective aviation asset management helping assets retain higher aircraft residual value.
What challenges does the Used Aircraft Industry face during its growth?
- Supply chain volatility and a scarcity of high-quality inventory present a key challenge, hindering market growth by inflating acquisition costs and limiting opportunities for fleet expansion.
- A significant challenge facing the used aircraft market is the inventory scarcity of high-quality assets, which has driven acquisition costs for some narrow body aircraft up by 15%. This is compounded by rising costs for airframe maintenance and the technical complexity of modern platforms, with MRO labor rates increasing by over 8%.
- Navigating complex aviation regulatory compliance, especially environmental noise regulations and mandates for sustainable aviation fuel, is a hurdle. The cost to bring legacy airframes into compliance can add 10-12% to the acquisition cost, forcing operators to meticulously evaluate total ownership cost against the benefits of lower initial capital outlay.
Exclusive Technavio Analysis on Customer Landscape
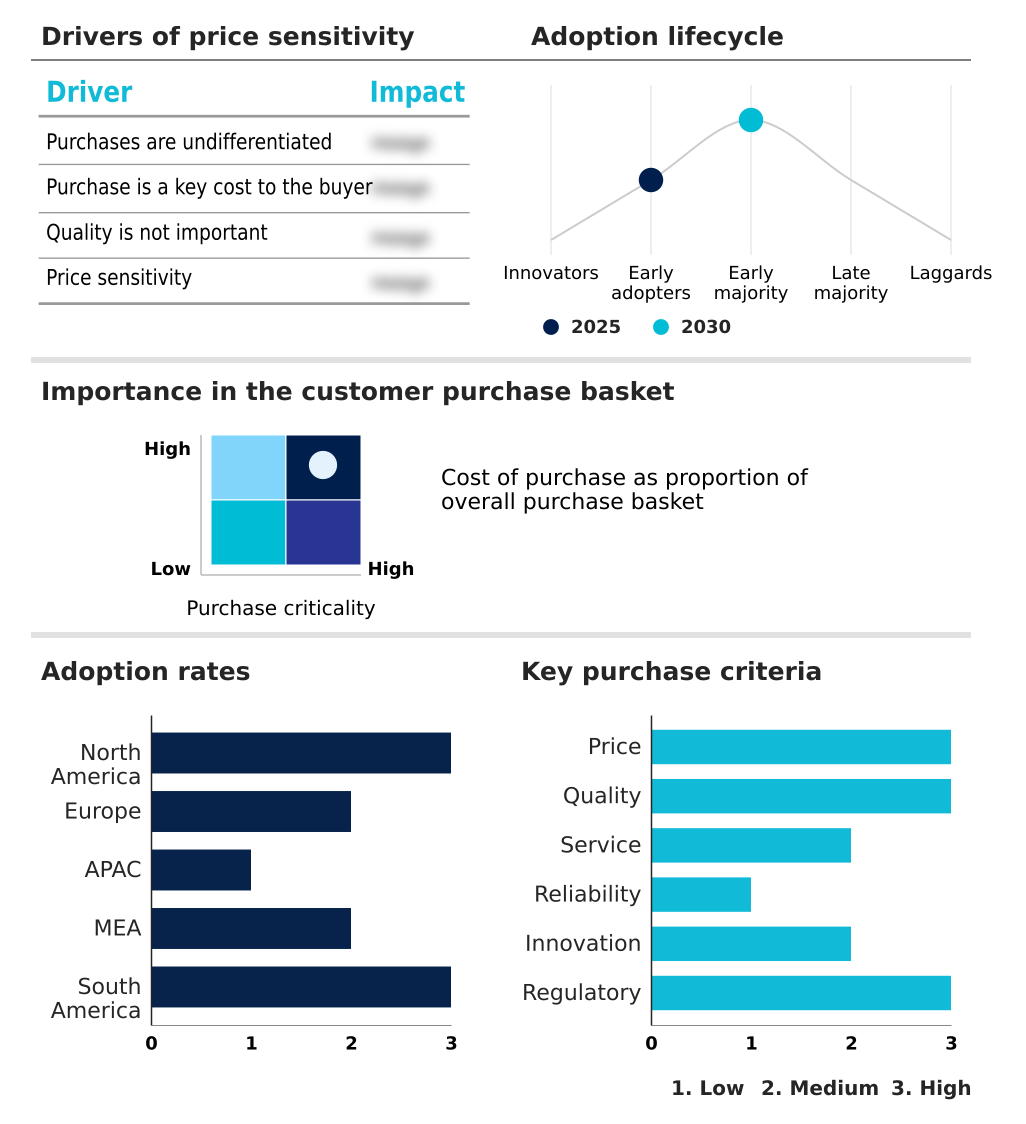
The used aircraft market forecasting report includes the adoption lifecycle of the market, covering from the innovator’s stage to the laggard’s stage. It focuses on adoption rates in different regions based on penetration. Furthermore, the used aircraft market report also includes key purchase criteria and drivers of price sensitivity to help companies evaluate and develop their market growth analysis strategies.
Customer Landscape of Used Aircraft Industry
Competitive Landscape
Companies are implementing various strategies, such as strategic alliances, used aircraft market forecast, partnerships, mergers and acquisitions, geographical expansion, and product/service launches, to enhance their presence in the industry.
AerCap Holdings NV - Provides pre-owned commercial and refurbished aircraft, supporting global fleet modernization with reliable secondary market assets and comprehensive solutions.
The industry research and growth report includes detailed analyses of the competitive landscape of the market and information about key companies, including:
- AerCap Holdings NV
- Airbus SE
- Aircastle Ltd.
- Aviation Capital Group
- Bombardier Inc.
- Breezer Aircraft GmbH and Co.
- Britten Norman
- Cirrus Design Corp.
- Dassault Aviation SA
- Deutsche Aircraft GmbH
- Diamond Aircraft Industries
- Embraer SA
- Jetcraft Corp.
- Lancair International LLC
- Piper Deutschland AG
- Textron Inc.
- Willis Lease Finance Corp.
Qualitative and quantitative analysis of companies has been conducted to help clients understand the wider business environment as well as the strengths and weaknesses of key industry players. Data is qualitatively analyzed to categorize companies as pure play, category-focused, industry-focused, and diversified; it is quantitatively analyzed to categorize companies as dominant, leading, strong, tentative, and weak.
Recent Development and News in Used aircraft market
- In May, 2024, Bombardier sold a majority stake in its used aircraft business to the aviation firm Air Atlanta Icelandic for a value of $500, highlighting specialized investment in the preowned business jet sector.
- In February, 2025, Lufthansa Technik and Hanwha Phasor signed a multiyear agreement to design and supply several hundred fuselage-mounted satellite communications radomes, underscoring the scale of cabin technology retrofits on used commercial aircraft.
- In April, 2025, the European Union Aviation Safety Agency approved the first used Airbus A320neo for entry into service, setting a new benchmark for the environmental certification of preowned assets.
- In August, 2025, the United States Air Force proposed a budget that included selling off the outdated F-15C and D fleet, illustrating how military organizations manage inventory cycles by transitioning platforms to the secondary market.
Dive into Technavio’s robust research methodology, blending expert interviews, extensive data synthesis, and validated models for unparalleled Used Aircraft Market insights. See full methodology.
| Market Scope | |
|---|---|
| Page number | 289 |
| Base year | 2025 |
| Historic period | 2020-2024 |
| Forecast period | 2026-2030 |
| Growth momentum & CAGR | Accelerate at a CAGR of 7.7% |
| Market growth 2026-2030 | USD 1963.1 million |
| Market structure | Fragmented |
| YoY growth 2025-2026(%) | 7.4% |
| Key countries | US, Canada, Mexico, Germany, UK, France, Italy, Spain, Russia, China, Japan, India, Australia, South Korea, Indonesia, UAE, Saudi Arabia, South Africa, Egypt, Israel, Brazil, Argentina and Colombia |
| Competitive landscape | Leading Companies, Market Positioning of Companies, Competitive Strategies, and Industry Risks |
Research Analyst Overview
- The used aircraft market is a highly dynamic environment, critical for managing fleet capacity and operational costs across the aviation industry. Beyond simply offering lower acquisition costs, the secondary market enables rapid strategic adjustments, a key boardroom consideration as new aircraft delivery backlogs persist.
- The availability of preowned business jets and narrow body aircraft allows operators to respond to market demand with an agility that new production cycles cannot match. A significant trend is the extension of asset life through sophisticated airframe maintenance and engine leasing solutions, which can defer capital expenditures by several years.
- Key activities include aircraft leasing, passenger to freighter conversions for logistics, and comprehensive avionics upgrades to maintain regulatory compliance. The focus on predictive maintenance and digital asset monitoring is transforming asset management, with some operators reporting a 20% reduction in unscheduled downtime.
- The market also sees value in aircraft teardowns for sourcing used serviceable materials, while aircraft remarketing and brokerage services facilitate the liquidity of everything from experimental aircraft to legacy airframes, all requiring stringent airworthiness certification.
What are the Key Data Covered in this Used Aircraft Market Research and Growth Report?
-
What is the expected growth of the Used Aircraft Market between 2026 and 2030?
-
USD 1.96 billion, at a CAGR of 7.7%
-
-
What segmentation does the market report cover?
-
The report is segmented by Product (0-15 years, 16-30 years, and More than 30 years), Application (Civil aviation, Military aviation, and Others), Aircraft Type (Fixed‑wing aircraft, Rotary‑wing aircraft, and Others) and Geography (North America, Europe, APAC, Middle East and Africa, South America)
-
-
Which regions are analyzed in the report?
-
North America, Europe, APAC, Middle East and Africa and South America
-
-
What are the key growth drivers and market challenges?
-
Increasing strategic reliance on modern secondary market assets, Supply chain volatility and inventory scarcity
-
-
Who are the major players in the Used Aircraft Market?
-
AerCap Holdings NV, Airbus SE, Aircastle Ltd., Aviation Capital Group, Bombardier Inc., Breezer Aircraft GmbH and Co., Britten Norman, Cirrus Design Corp., Dassault Aviation SA, Deutsche Aircraft GmbH, Diamond Aircraft Industries, Embraer SA, Jetcraft Corp., Lancair International LLC, Piper Deutschland AG, Textron Inc. and Willis Lease Finance Corp.
-
Market Research Insights
- The dynamics of the used aircraft market are shaped by a strategic push for aviation asset management and fleet modernization. Operators are leveraging the secondary aircraft market to bypass new production backlogs, which have extended delivery times by over 24 months for some popular models. This has intensified focus on mid-life aircraft, with comprehensive aircraft MRO services becoming critical.
- Investment in aircraft refurbishment for cabin technology and high-speed connectivity can increase an asset’s resale value by up to 15%. Furthermore, the adoption of used serviceable material in maintenance routines can reduce operational costs by as much as 25% compared to using new parts.
- The business aviation sector in particular benefits from these dynamics, accessing high-value assets through flexible aircraft financing options, while navigating complex aviation regulatory compliance and environmental noise regulations.
We can help! Our analysts can customize this used aircraft market research report to meet your requirements.
 RIA -
RIA - 
