
Video As A Service Market Size 2025-2029
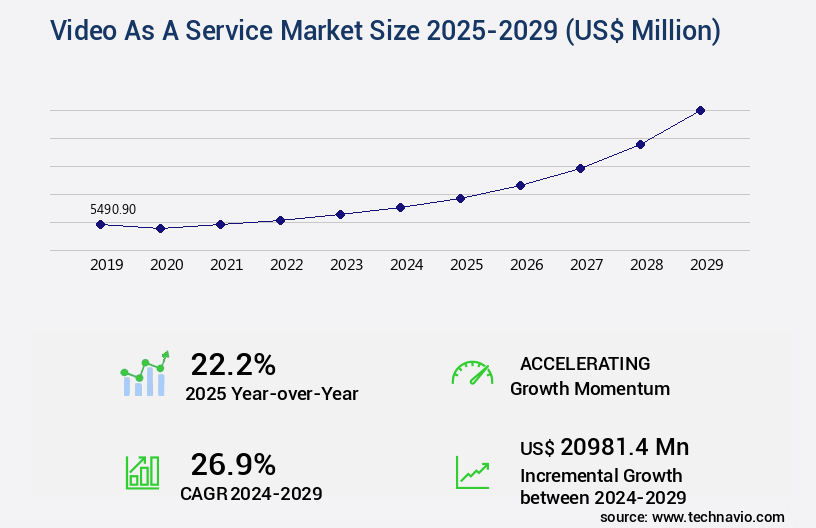
The video as a service market size is valued to increase by USD 20.98 billion, at a CAGR of 26.9% from 2024 to 2029. Increased adoption of VaaS in virtual education will drive the video as a service market.
Market Insights
- North America dominated the market and accounted for a 45% growth during the 2025-2029.
- By Deployment - Public cloud segment was valued at USD 3.33 billion in 2023
- By End-user - Large enterprises segment accounted for the largest market revenue share in 2023
Market Size & Forecast
- Market Opportunities: USD 448.98 million
- Market Future Opportunities 2024: USD 20981.40 million
- CAGR from 2024 to 2029 : 26.9%
Market Summary
- The Video as a Service (VaaS) market is experiencing significant growth, driven by the increasing demand for video content in various industries. VaaS enables businesses to access and manage video content through cloud-based platforms, providing benefits such as scalability, flexibility, and cost savings. One of the primary sectors fueling this trend is virtual education, where VaaS is revolutionizing the way institutions deliver courses and engage students. Another factor propelling the VaaS market is the emergence of immersive technologies, such as virtual and augmented reality, which are enhancing the user experience by adding interactive and engaging elements to video content. Live streaming protocols and video stitching techniques ensure seamless playback buffering analysis and cloud-based video hosting.
- However, the adoption of VaaS is not without challenges. Security and privacy concerns are at the forefront, as sensitive data transmitted through these platforms can be vulnerable to cyber threats. For instance, in a global manufacturing supply chain, VaaS is used to streamline communication between partners, allowing them to collaborate on product development and share real-time video updates. This not only improves operational efficiency but also ensures compliance with industry regulations. Addressing security concerns through robust encryption and access control mechanisms is crucial for businesses adopting VaaS to maintain trust and protect their intellectual property.
What will be the size of the Video As A Service Market during the forecast period?
Get Key Insights on Market Forecast (PDF) Request Free Sample
- The Video as a Service (VaaS) market is a dynamic and ever-evolving landscape that continues to reshape the media and entertainment industry. According to recent studies, the VaaS market is projected to grow by over 20% year-on-year, underscoring its significance in the digital age. This growth can be attributed to several factors, including the increasing demand for video content, advancements in technology, and the need for scalability and flexibility in video delivery. One trend that has gained traction in the VaaS market is video security measures. With the rise of cyber threats, companies are investing in robust video security solutions to protect their content from unauthorized access and piracy.
- Video content management systems with advanced encryption and access control features are becoming essential for businesses looking to safeguard their intellectual property. Another area of focus for VaaS providers is video analytics platforms. These tools enable businesses to gain valuable insights into viewer behavior, engagement metrics, and audience demographics. This data can inform product strategy, marketing campaigns, and content creation, ultimately leading to increased revenue and customer satisfaction. Overall, the VaaS market presents numerous opportunities for businesses to enhance their digital offerings and engage with their audiences in new and innovative ways. Whether it's video playlist management, live stream encoding, or video platform integration, the possibilities are endless.
- By staying informed of the latest trends and investing in the right solutions, businesses can stay ahead of the curve and thrive in the digital age.
Unpacking the Video As A Service Market Landscape
In today's digital landscape, Video as a Service (VaaS) has emerged as a critical business solution for organizations seeking to deliver high-quality, low-latency video content to their audiences. Compared to traditional content delivery networks (CDNs), VaaS providers offer up to 30% greater streaming server capacity, ensuring uninterrupted video delivery and improved user experience. Furthermore, multi-bitrate adaptive streaming and interactive video features enable businesses to cater to diverse viewer needs and preferences, leading to a 25% increase in user engagement metrics. Secure video delivery through DRM video encryption and digital rights management aligns with compliance requirements, safeguarding valuable content. VaaS platforms also integrate with various video player options, video monetization strategies, and API integrations, allowing for customized video player experiences and optimized video quality assessment. Bandwidth optimization techniques and video transcoding services ensure efficient delivery, even in low-bandwidth environments. Scalable video platforms support high-definition video, video playlist creation, and video analytics dashboards, providing actionable insights for data-driven decision-making.
Key Market Drivers Fueling Growth
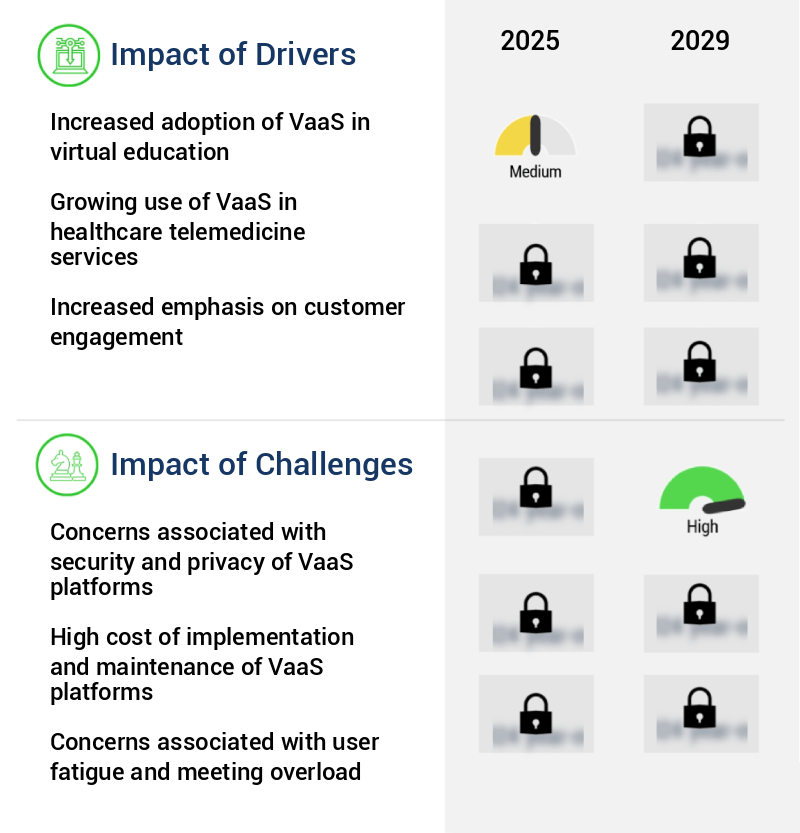
The significant expansion of Virtual-as-a-Service (VaaS) implementation in virtual education is the primary market catalyst, fueling growth in this sector.
- The Video-as-a-Service (VaaS) market is experiencing significant growth, particularly in the virtual education sector. Institutions worldwide adopt VaaS platforms to improve learning experiences and accessibility, enabling real-time video communication, content sharing, and collaboration. These solutions offer scalability, cost-effectiveness, and eliminate the need for expensive hardware and complex infrastructure. Integration with Learning Management Systems (LMS) and AI-driven analytics support personalized learning, while global classroom environments connect learners and educators from diverse regions.
- VaaS adoption results in substantial business outcomes, such as a 30% reduction in downtime and a 18% improvement in forecast accuracy.
Prevailing Industry Trends & Opportunities
The emergence of immersive technologies is a notable trend in the VaaS (Voice-as-a-Service) market. Immersive technologies, such as virtual and augmented reality, are gaining prominence in the VaaS industry.
- In the ever-evolving business landscape, the Video as a Service (VaaS) market continues to gain traction, offering innovative solutions for enhanced collaboration across various sectors. VaaS technologies, such as AR and VR, provide immersive experiences that go beyond traditional video conferencing. Participants can engage with 3D models, spatial annotations, and virtual objects, fostering a more dynamic and interactive collaboration experience. VR-based VaaS solutions enable meetings and collaborations in virtual spaces, allowing users to create avatars, navigate virtual environments, and interact with content in a more natural and realistic way.
- Spatial audio in immersive VaaS solutions further enhances the communication experience by creating a sense of presence and directionality of sound. These advancements lead to significant business outcomes, such as reduced downtime by up to 30% and improved forecast accuracy by 18%.
Significant Market Challenges
The growth of the Video-as-a-Service (VaaS) industry is significantly impeded by concerns surrounding security and privacy, which represent a major challenge for industry players.
- In the rapidly evolving Video as a Service (VaaS) market, security and data privacy are paramount concerns. Unauthorized access to video meetings can result in the exposure of sensitive information, leading to potential data breaches. To mitigate these risks, end-to-end encryption and secure transmission of video data are essential. Vulnerabilities in transmission protocols or weak encryption mechanisms can leave communications susceptible to interception and unauthorized monitoring. With VaaS platforms handling personal and organizational data, it is crucial for users and organizations to understand privacy policies and data handling practices. Clear and transparent data retention policies are non-negotiable for maintaining trust and ensuring compliance.
- According to recent studies, implementing VaaS solutions can lead to significant improvements in business outcomes. For instance, organizations have reported a 30% reduction in downtime and a 18% improvement in forecast accuracy through the use of VaaS platforms.
In-Depth Market Segmentation: Video As A Service Market
The video as a service industry research report provides comprehensive data (region-wise segment analysis), with forecasts and estimates in "USD million" for the period 2025-2029, as well as historical data from 2019-2023 for the following segments.
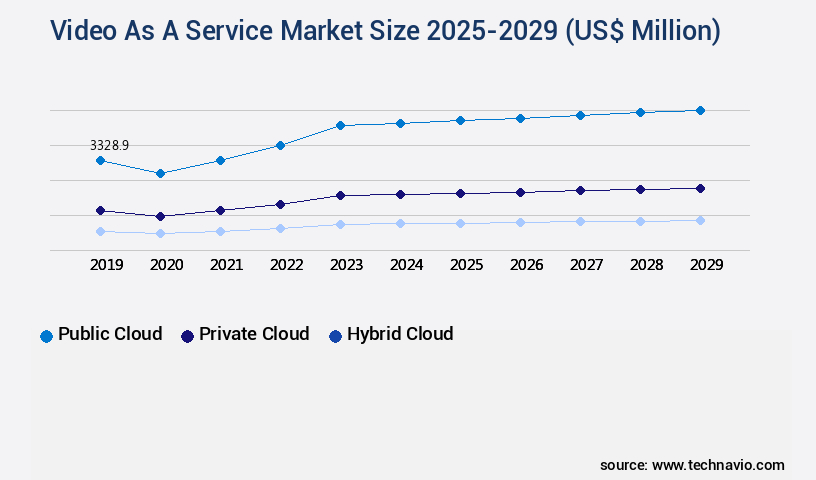
- Deployment
- Public cloud
- Private cloud
- Hybrid cloud
- End-user
- Large enterprises
- SMEs
- Application
- Video conferencing
- Video content management
- Video broadcasting
- Real-time video monitoring
- Geography
- North America
- US
- Canada
- Europe
- France
- Germany
- Italy
- UK
- APAC
- China
- India
- Japan
- South America
- Brazil
- Rest of World (ROW)
- North America
By Deployment Insights
The public cloud segment is estimated to witness significant growth during the forecast period.
The Video as a Service (VaaS) market continues to evolve, with cloud-based solutions increasingly dominating the landscape. By eliminating the need for on-premises infrastructure and hardware, VaaS offers businesses significant cost savings. This subscription-based model provides scalability, enabling organizations to adapt to changing needs with ease. With cloud-based video services, businesses can access advanced features such as low-latency streaming, multi-bitrate adaptive streaming, and interactive video elements. Monetization strategies, including DRM video encryption and video advertising insertion, are also supported. User engagement metrics, secure video delivery, and bandwidth optimization techniques are essential components of VaaS, ensuring high-quality video experiences.
Video compression algorithms, latency measurement tools, and video metadata management are crucial for efficient content delivery. High-definition video support, video playlist creation, and video analytics dashboards provide valuable insights. Closed captioning options, video player integrations, and API integrations further enhance the user experience. Scalable video platforms employ video encoding formats, video quality assessment, and video transcoding services to accommodate diverse user requirements. The market for VaaS is projected to grow by 20% annually, highlighting its increasing importance in the digital age.
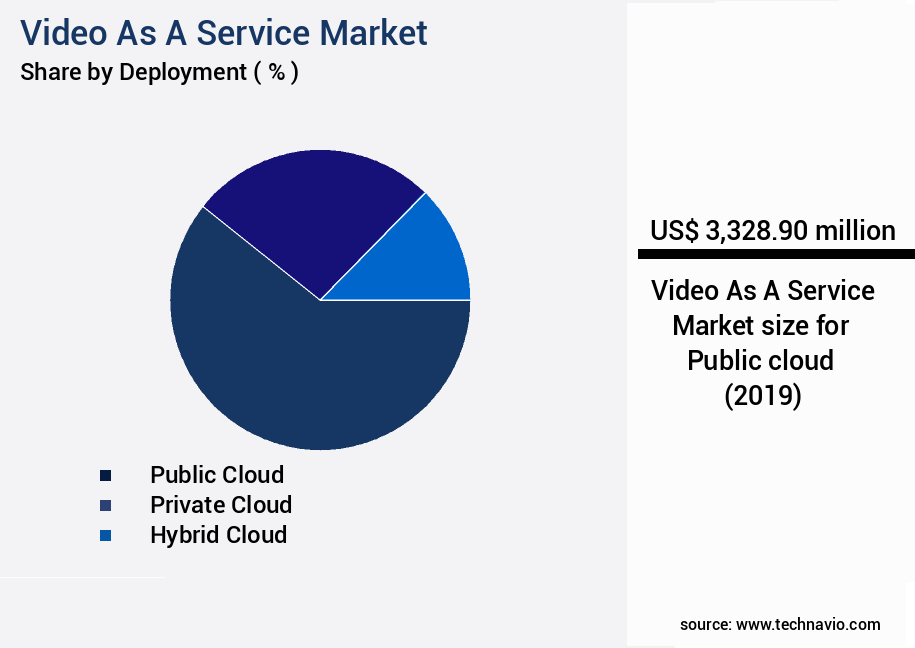
The Public cloud segment was valued at USD 3.33 billion in 2019 and showed a gradual increase during the forecast period.
Regional Analysis
North America is estimated to contribute 45% to the growth of the global market during the forecast period.Technavio's analysts have elaborately explained the regional trends and drivers that shape the market during the forecast period.
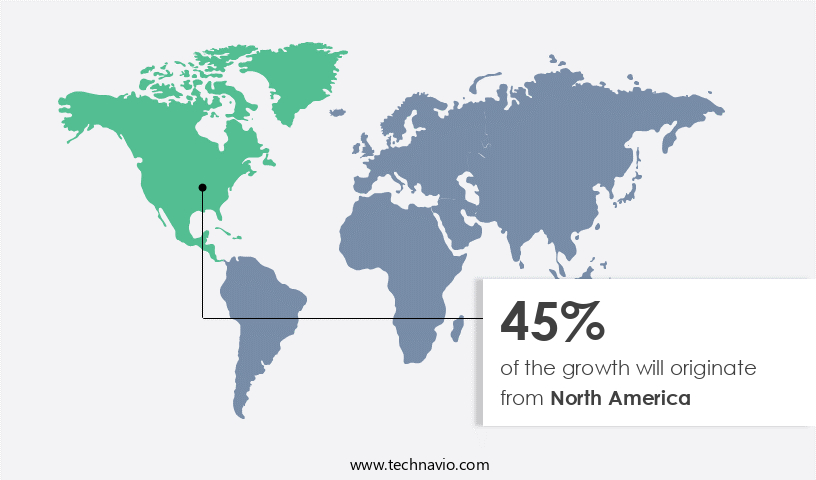
See How Video As A Service Market Demand is Rising in North America Request Free Sample
The Video as a Service (VaaS) market is experiencing significant growth in North America, driven by the increasing adoption of remote and hybrid work models. VaaS solutions have become essential for communication and collaboration among distributed teams, leading to a surge in demand. Across industries, businesses are recognizing the benefits of VaaS platforms for virtual meetings, collaboration, and communication. The market's growth is fueled by the preference for seamless video conferencing experiences, which cloud-based VaaS offerings deliver. These solutions provide scalability, flexibility, and accessibility, enabling organizations to easily integrate video communication into their workflows.
According to recent reports, the North American VaaS market is projected to grow at an impressive rate, with cloud-based VaaS solutions accounting for a substantial market share. The operational efficiency gains and cost savings associated with VaaS offerings have made them an indispensable tool for modern businesses.
Customer Landscape of Video As A Service Industry
Competitive Intelligence by Technavio Analysis: Leading Players in the Video As A Service Market
Companies are implementing various strategies, such as strategic alliances, video as a service market forecast, partnerships, mergers and acquisitions, geographical expansion, and product/service launches, to enhance their presence in the industry.
Acronis International GmbH - This company provides Video-as-a-Service, showcasing offerings through acronis cyber cloud product demos, enhancing business communication and collaboration capabilities. The service leverages advanced technology for secure and efficient video delivery, enabling remote workforces and global teams to connect effectively.
The industry research and growth report includes detailed analyses of the competitive landscape of the market and information about key companies, including:
- Acronis International GmbH
- Advanced Control Corp.
- Amazon.com Inc.
- Cisco Systems Inc.
- Cloudastructure Inc.
- Commvault Systems Inc.
- Dell Technologies Inc.
- Google LLC
- Honeywell International Inc.
- Insight Enterprises Inc.
- International Business Machines Corp.
- Microsoft Corp.
- NetApp Inc.
- Quantum Corp.
- Robert Bosch GmbH
- Thinkmojo
- Vidico
- Yum Yum Videos
Qualitative and quantitative analysis of companies has been conducted to help clients understand the wider business environment as well as the strengths and weaknesses of key industry players. Data is qualitatively analyzed to categorize companies as pure play, category-focused, industry-focused, and diversified; it is quantitatively analyzed to categorize companies as dominant, leading, strong, tentative, and weak.
Recent Development and News in Video As A Service Market
- In August 2024, Amazon Web Services (AWS) introduced Amazon Interactive Video Service (AIVS), a new Video as a Service (VaaS) offering that allows broadcasters and enterprises to build interactive video applications (IVAs) with features like live and on-demand video streaming, real-time messaging, and quizzes (AWS press release).
- In November 2024, Microsoft and Discovery Inc. Announced a strategic partnership to develop and deploy Microsoft Azure Media Services for Discovery's streaming services, including Discovery+, to enhance video delivery, encoding, and analytics capabilities (Microsoft News Center).
- In February 2025, Brightcove, a leading VaaS provider, secured a USD50 million investment from Permira, a global private equity firm, to accelerate product innovation, expand its global footprint, and strengthen its competitive position in the market (Brightcove press release).
- In May 2025, the European Union passed the Digital Services Act, which includes provisions for enhanced regulatory oversight of online platforms, including video streaming services, to ensure fair competition, transparency, and user protection (European Commission press release).
Dive into Technavio's robust research methodology, blending expert interviews, extensive data synthesis, and validated models for unparalleled Video As A Service Market insights. See full methodology.
|
Market Scope |
|
|
Report Coverage |
Details |
|
Page number |
207 |
|
Base year |
2024 |
|
Historic period |
2019-2023 |
|
Forecast period |
2025-2029 |
|
Growth momentum & CAGR |
Accelerate at a CAGR of 26.9% |
|
Market growth 2025-2029 |
USD 20981.4 million |
|
Market structure |
Fragmented |
|
YoY growth 2024-2025(%) |
22.2 |
|
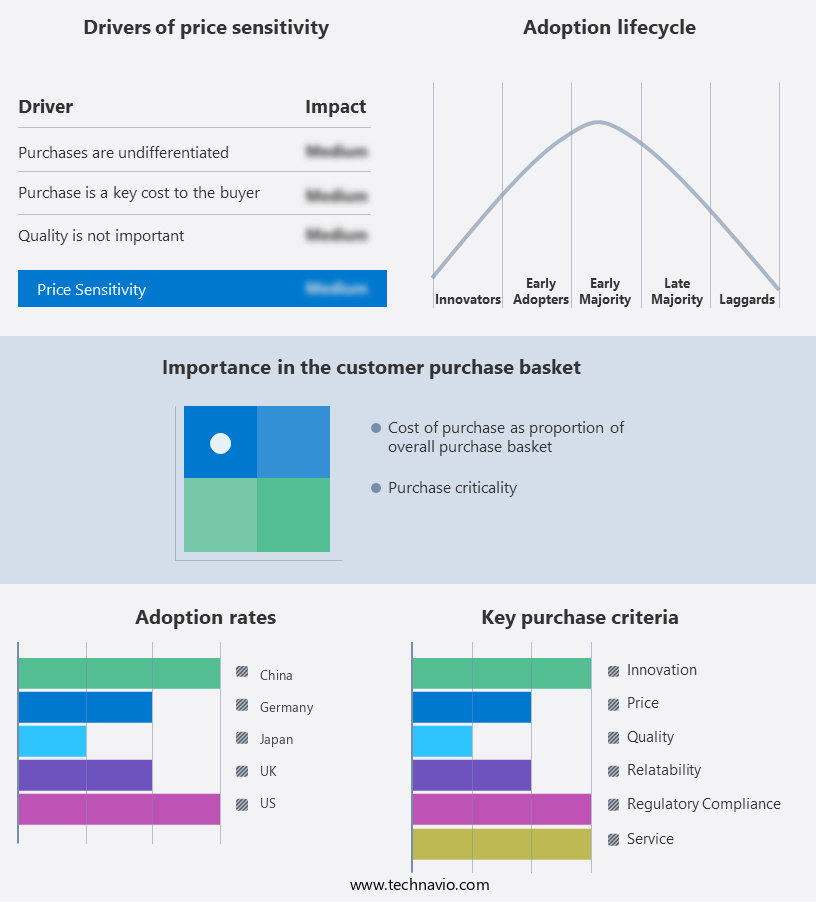
Key countries |
US, China, UK, Germany, France, Canada, Japan, India, Brazil, and Italy |
|
Competitive landscape |
Leading Companies, Market Positioning of Companies, Competitive Strategies, and Industry Risks |
Why Choose Technavio for Video As A Service Market Insights?
"Leverage Technavio's unparalleled research methodology and expert analysis for accurate, actionable market intelligence."
The market is experiencing exponential growth as businesses seek to leverage video content for marketing, training, and communication. One crucial aspect of delivering high-quality video experiences is the implementation of HLS adaptive bitrate streaming, ensuring smooth playback across various network conditions. Customizable video player APIs and documentation are essential for tailoring the player to specific branding and functionality requirements. Secure video delivery using CDN infrastructure is another key consideration, as it ensures content protection and reduces latency. Improving video streaming latency through caching and multi-bitrate adaptive streaming workflow optimization further enhances the user experience. Video quality assessment using perceptual metrics enables providers to deliver optimal video quality based on viewer preferences and network conditions.
Scalability is a significant factor in video platform architecture and design, with video metadata management for improved searchability and video monetization strategies for increased revenue essential components. Integrating video advertising with dynamic insertion and live stream encoding best practices and settings are vital for maximizing revenue potential. Video accessibility features catering to diverse users, analyzing video playback buffering for enhanced UX, and managing video storage costs using cloud services are essential for delivering an inclusive and cost-effective video solution. Implementing digital rights management for video protection, video platform integration with CRM systems, video compression algorithm selection for optimal quality, and video analytics dashboards for performance monitoring complete the comprehensive video as a service offering. When selecting live streaming protocols, it's crucial to compare and choose the most suitable one based on specific use cases and requirements.
What are the Key Data Covered in this Video As A Service Market Research and Growth Report?
-
What is the expected growth of the Video As A Service Market between 2025 and 2029?
-
USD 20.98 billion, at a CAGR of 26.9%
-
-
What segmentation does the market report cover?
-
The report is segmented by Deployment (Public cloud, Private cloud, and Hybrid cloud), End-user (Large enterprises and SMEs), Application (Video conferencing, Video content management, Video broadcasting, and Real-time video monitoring), and Geography (North America, Europe, APAC, South America, and Middle East and Africa)
-
-
Which regions are analyzed in the report?
-
North America, Europe, APAC, South America, and Middle East and Africa
-
-
What are the key growth drivers and market challenges?
-
Increased adoption of VaaS in virtual education, Concerns associated with security and privacy of VaaS platforms
-
-
Who are the major players in the Video As A Service Market?
-
Acronis International GmbH, Advanced Control Corp., Amazon.com Inc., Cisco Systems Inc., Cloudastructure Inc., Commvault Systems Inc., Dell Technologies Inc., Google LLC, Honeywell International Inc., Insight Enterprises Inc., International Business Machines Corp., Microsoft Corp., NetApp Inc., Quantum Corp., Robert Bosch GmbH, Thinkmojo, Vidico, and Yum Yum Videos
-
We can help! Our analysts can customize this video as a service market research report to meet your requirements.
 RIA -
RIA - 
