
UK VOIP Market Size 2025-2029
The UK VOIP market size is forecast to increase by USD 5.3 billion at a CAGR of 9.3% between 2024 and 2029.
- The Voice over Internet Protocol (VoIP) market is experiencing significant growth, driven by the increasing number of mobile computing devices and the emerging use of VOIP assistants. These trends reflect the broader shift towards remote work and digital communication, fueled by the COVID-19 pandemic and the increasing availability of high-speed internet. However, the market also faces challenges that could impact its growth potential. Regulatory hurdles, particularly regarding data privacy and security, can hinder adoption in certain industries and regions. Additionally, signaling issues, such as call quality and reliability, can deter businesses from fully embracing VOIP technology. With the advent of 5G technology, devices have become more homogeneous, enabling seamless virtual communication services.
- To capitalize on the market's opportunities and navigate these challenges effectively, companies must prioritize innovation, invest in robust security measures, and collaborate with regulatory bodies to ensure compliance. By doing so, they can differentiate themselves in a competitive landscape and position themselves as trusted providers of reliable and secure VOIP solutions. Artificial intelligence is also playing a pivotal role in enhancing communication efficiency and customer service.
What will be the size of the UK VOIP Market during the forecast period?

- In the dynamic VOIP market, IT services and network infrastructure play a pivotal role in ensuring seamless communication. Cloud computing has significantly influenced VOIP adoption, enabling businesses to access advanced call management features and scalability. Network security and data privacy are paramount concerns, with VOIP gateways providing essential security auditing and IP address management. Network implementation and optimization are ongoing processes, with network management tools facilitating call center analytics and disaster recovery planning. This cost-effective solution has led to the widespread adoption of VoIP services globally.
- IT support and network design are crucial for network architecture, while data backup and business continuity planning ensure uninterrupted operations. Network performance monitoring and data security are integral components of VoIP, safeguarding against potential threats and maintaining network uptime.
How is this market segmented?
The market research report provides comprehensive data (region-wise segment analysis), with forecasts and estimates in "USD billion" for the period 2025-2029, as well as historical data from 2019-2023 for the following segments.
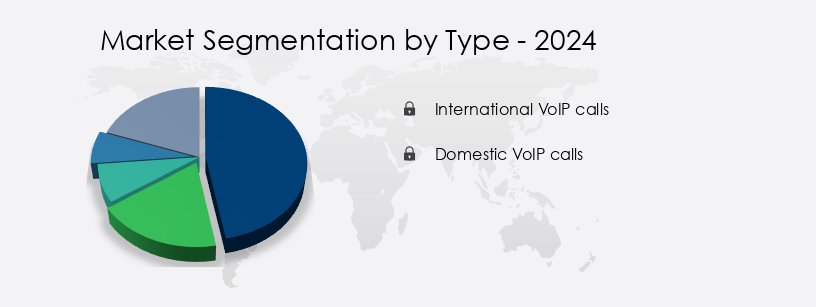
- Type
- International VOIP calls
- Domestic VOIP calls
- Method
- Computer to phone
- Computer to computer
- Phone to phone
- Deployment
- On-premises
- Cloud-based
- Geography
- Europe
- UK
- Europe
By Type Insights
The international VOIP calls segment is estimated to witness significant growth during the forecast period.
The VOIP market in the US is experiencing significant growth due to the increasing adoption of call center software and business VOIP services. This shift towards digital communication solutions offers numerous benefits, including cost savings, call transfer, disaster recovery, call routing, presence management, and business continuity. VOIP phones, cloud-based VoIP, subscription models, and mobile VOIP are becoming increasingly popular, enabling remote work and instant messaging. Unified communications solutions, such as IP PBX, video conferencing, and customer service tools, are also gaining traction. VOIP services offer superior call clarity and reliability, making them an attractive alternative to traditional phone systems. As competition intensifies among providers, businesses require actionable data and business plans to optimize their revenue, minimize revenue leakages, and enhance customer experience through automated payment solutions and data analytics.
SMBs and enterprises alike are embracing VOIP technology for its flexibility and scalability. Key VOIP entities, including RingCentral, Vonage, 8x8, Skype for Business, and Mitel, continue to innovate and dominate the market. SIP trunking, auto attendant, call recording, and fax over IP are additional features enhancing the VOIP experience. The VOIP market's evolution reflects the growing importance of unified, efficient, and cost-effective communication solutions for modern businesses.
Get a glance at the market share of various segments Request Free Sample
The International VOIP calls segment was valued at USD 4.30 billion in 2019 and showed a gradual increase during the forecast period.
Market Dynamics
Our researchers analyzed the data with 2024 as the base year, along with the key drivers, trends, and challenges. A holistic analysis of drivers will help companies refine their marketing strategies to gain a competitive advantage.
What are the key market drivers leading to the rise in the adoption of VOIP in UK Industry?
- The proliferation of mobile computing devices serves as the primary catalyst for market growth. The global shift towards remote work and increased reliance on technology for communication have improved the adoption of advanced telecommunication services, particularly VoIP. This technology enables video conferencing, customer service functionalities, and call hold features, among others, allowing businesses to streamline operations and enhance productivity. SIP trunking and auto attendant systems are also gaining traction, offering cost savings and improved call handling capabilities. Furthermore, the integration of fax over IP has eliminated the need for traditional fax machines, reducing clutter and streamlining document sharing.
- The demand for these services is fueled by the widespread availability of high-speed internet and the need for secure, , and communication solutions. Both businesses and individuals require high-speed, secure internet access to meet their professional and personal needs, making VOIP an essential tool for modern connectivity.
What are the market trends shaping the VOIP in UK Industry?
- The emerging trend in the market is the increasing utilization of VOIP assistants. As a professional and knowledgeable virtual assistant, I am committed to staying informed about the latest industry developments. VOIP assistants, with their advanced capabilities and cost-effective solutions, are becoming an essential tool for businesses and individuals alike. VoIP, or Voice over Internet Protocol, call center software has revolutionized business communications by offering cost savings and advanced features. This cloud-based technology enables call transfer, call clarity, and disaster recovery capabilities, making it an essential tool for businesses. The integration of AI systems, such as virtual assistants like Alexa, Siri, and Google Assistant, enhances user experience by automating tasks and providing quick responses. These assistants can handle complex queries and manage routine tasks, freeing up time for more strategic activities.
- Moreover, VoIP's call recording and transcription features offer significant time and cost savings by eliminating the need for manual data entry. The adoption of VOIP phones and call center software is a strategic investment for businesses seeking to streamline operations and improve customer service. The availability of flexible communication tools, such as voice calls, video conferencing, and instant messaging, has made communication more convenient and economical.
What challenges does the VOIP in UK Industry face during its growth?
- Signaling issues represent a significant challenge to the industry's growth, as outdated infrastructure and inadequate investment in technology hinder the efficient transmission of information and potentially limit market expansion. VOIP market evolution continues to transform digital communication, with H.323 and SIP as the leading signaling and monitoring protocols. They enable call setup, management, and termination, ensuring uninterrupted voice and video transmission over IP networks. However, these protocols lack built-in Quality of Service (QoS) guarantees and resource reservation, essential for maintaining high-quality communication. VOIP applications require frequent keep-alive messages to maintain active sessions, contributing to substantial signaling loads across networks. The need for secure VOIP solutions has escalated, leading to advancements in encryption and authentication mechanisms to secure communications. Subscription models, such as call routing, presence management, hosted VoIP, call forwarding, and mobile VoIP, have become increasingly popular.
- Call routing directs incoming calls to the most appropriate destination based on predefined rules, enhancing efficiency and customer experience. Presence management allows users to see the availability status of their contacts, enabling more effective communication. Hosted VOIP eliminates the need for on-premises infrastructure, reducing costs and simplifying management. Call forwarding enables users to redirect calls to alternative numbers, ensuring business continuity. Mobile VOIP extends VOIP functionality to mobile devices, enabling remote work and increased flexibility. Maintaining voice quality is crucial in VOIP applications, as poor quality can lead to customer dissatisfaction and decreased productivity.
Exclusive Customer Landscape
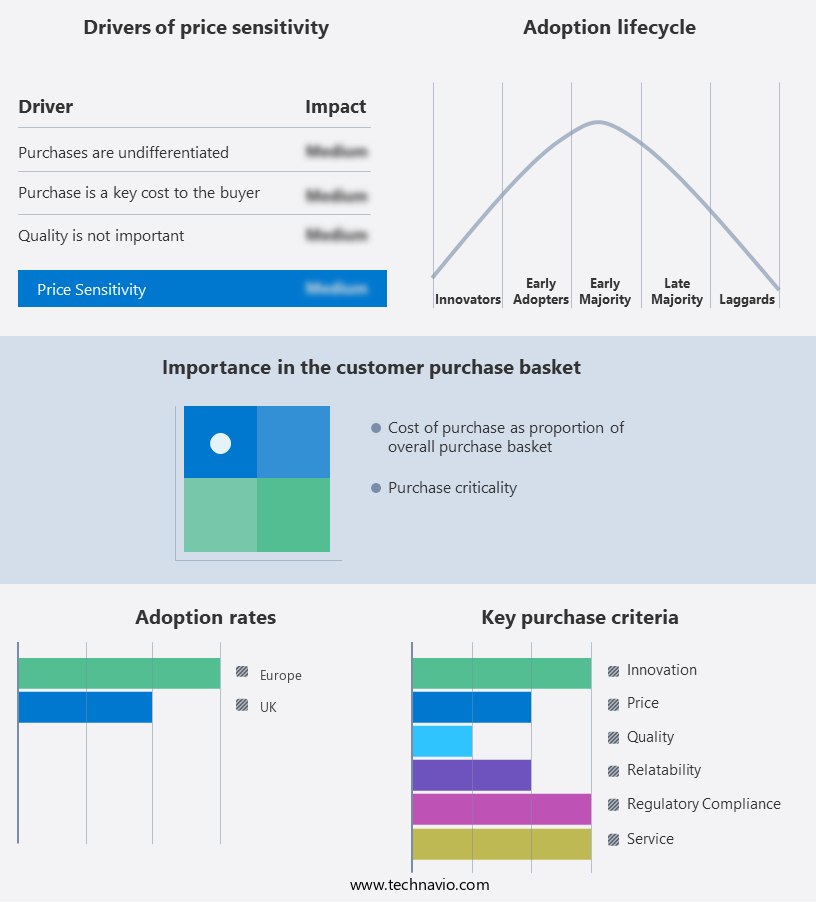
The VOIP market in UK forecasting report includes the adoption lifecycle of the market, covering from the innovator's stage to the laggard's stage. It focuses on adoption rates in different regions based on penetration. Furthermore, the VOIP market in UK report also includes key purchase criteria and drivers of price sensitivity to help companies evaluate and develop their market growth analysis strategies.
Customer Landscape
Key Companies & Market Insights
Companies are implementing various strategies, such as strategic alliances, VOIP market in UK forecast, partnerships, mergers and acquisitions, geographical expansion, and product/service launches, to enhance their presence in the industry.
3CX - A software-driven VOIP PBX solution, tailored for manufacturing industries, delivers flexibility and advanced communication capabilities.
The industry research and growth report includes detailed analyses of the competitive landscape of the market and information about key companies, including:
- 3CX
- Ascom Holding AG
- Avaya LLC
- Berry Telecom Ltd.
- BT Group Plc
- Bueno Technologies Inc.
- Cisco Systems Inc.
- Exponential-e Ltd.
- Focus Group
- iHub
- Microsoft Corp.
- Mitel Networks Corp.
- NEC Corp.
- Panasonic Holdings Corp.
- Plantronics Inc.
- Pragma Group
- sipgate GmbH
- Toshiba Corp.
- Vonage Holdings Corp.
- Yealink Network Technology Co. Ltd
Qualitative and quantitative analysis of companies has been conducted to help clients understand the wider business environment as well as the strengths and weaknesses of key industry players. Data is qualitatively analyzed to categorize companies as pure play, category-focused, industry-focused, and diversified; it is quantitatively analyzed to categorize companies as dominant, leading, strong, tentative, and weak.
Recent Development and News in VOIP Market In UK
- In February 2024, Microsoft Teams, a leading VOIP communication platform, announced the integration of Calling Plans for VOIP services, allowing businesses to make and receive calls using their Teams account without the need for additional phone systems (Microsoft Press Release). This expansion aimed to streamline communication solutions for businesses, merging instant messaging, video conferencing, and VOIP services into one platform.
- In November 2024, Twilio, a cloud communications platform provider, raised USD1 billion in a funding round, demonstrating significant investor confidence in the VOIP market's growth potential (TechCrunch). The funds were earmarked for research and development, as well as expanding their global presence and enhancing their platform offerings.
- In March 2025, the European Union passed the Digital Services Act, which included provisions for VOIP services to adhere to stricter regulations regarding user data protection and online safety (EU Commission Press Release). This regulatory development aimed to ensure user privacy and security in the digital communication landscape.
Research Analyst Overview
The VOIP market continues to evolve, driven by the ever-growing demand for flexible and cost-effective communication solutions. Call center software, business VoIP, call transfer, disaster recovery, and cost savings are integral components of this dynamic landscape. Cloud-based VOIP and subscription models enable businesses to streamline operations and enhance call routing and presence management. Hosted VOIP and SIP trunking offer superior voice quality, while remote work and mobile VOIP facilitate connectivity from anywhere. Unified communications, including instant messaging, video conferencing, and customer service, are transforming the way businesses interact. IP PBX and SMB VOIP cater to various business sizes, while on-premise VOIP and residential VOIP cater to unique needs. The software segment is further categorized into on-premise and cloud deployment, with innovative technologies like IoT, 5G, and convergent billing gaining traction.
Call forwarding, call recording, business continuity, and auto attendant are essential features ensuring uninterrupted communication. Fax over IP and voice quality are critical considerations, as is the integration of VOIP with traditional phone systems. The market's continuous unfolding is marked by innovation, with new applications and services continually emerging to meet evolving business needs.
Dive into Technavio's robust research methodology, blending expert interviews, extensive data synthesis, and validated models for unparalleled VOIP Market in UK insights. See full methodology.
|
Market Scope |
|
|
Report Coverage |
Details |
|
Page number |
159 |
|
Base year |
2024 |
|
Historic period |
2019-2023 |
|
Forecast period |
2025-2029 |
|
Growth momentum & CAGR |
Accelerate at a CAGR of 9.3% |
|
Market growth 2025-2029 |
USD 5.3 billion |
|
Market structure |
Fragmented |
|
YoY growth 2024-2025(%) |
8.4 |
|
Key countries |
UK |
|
Competitive landscape |
Leading Companies, Market Positioning of Companies, Competitive Strategies, and Industry Risks, |
What are the Key Data Covered in this VOIP Market in UK Research and Growth Report?
- CAGR of the VOIP in UK industry during the forecast period
- Detailed information on factors that will drive the growth and forecasting between 2025 and 2029
- Precise estimation of the size of the market and its contribution of the industry in focus to the parent market
- Accurate predictions about upcoming growth and trends and changes in consumer behaviour
- Growth of the market across UK
- Thorough analysis of the market's competitive landscape and detailed information about companies
- Comprehensive analysis of factors that will challenge the VOIP market in UK growth of industry companies
We can help! Our analysts can customize this VOIP market in UK research report to meet your requirements.
 RIA -
RIA - 
