Voltage Regulator Market Analysis APAC, North America, Europe, South America, Middle East and Africa - China, US, South Korea, Germany, Japan - Size and Forecast 2024-2028

Voltage Regulator Market Analysis APAC, North America, Europe, South America, Middle East and Africa - China, US, South Korea, Germany, Japan - Size and Forecast 2024-2028

Published: Jul 2024 192 Pages SKU: IRTNTR70482

Market Overview at a Glance

$12.03 B
Market Opportunity
7.53%
CAGR
6.86
YoY growth 2023-2024(%)

Voltage Regulator Market Size 2024-2028 

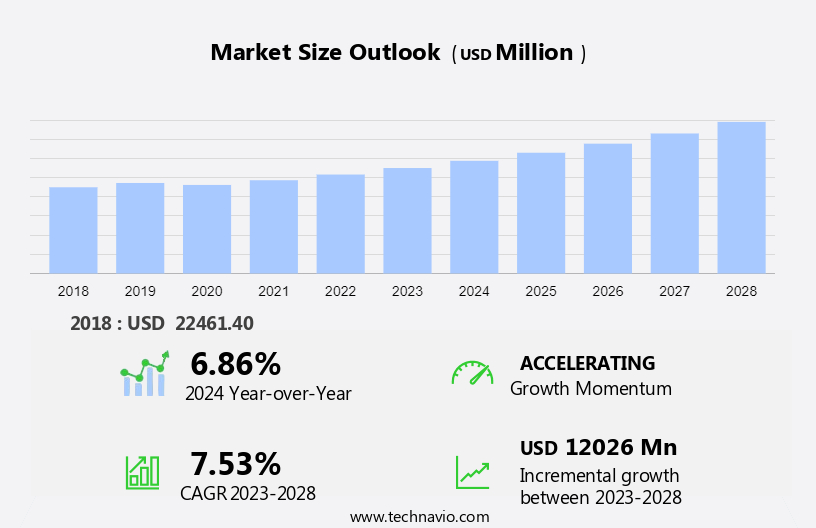
The voltage regulator market size is forecast to increase by USD 12.03 billion at a CAGR of 7.53% between 2023 and 2028.

  • The market is experiencing significant growth, driven by the rapid expansion of the Internet of Things (IoT) and the increasing popularity of smart wearables. These technologies require reliable voltage regulation to function optimally. Additionally, geopolitical factors, such as the US-China trade war, are impacting the market dynamics. Tariffs and trade restrictions are leading to supply chain disruptions and price fluctuations. Despite these challenges, the market is expected to continue growing due to the increasing demand for voltage regulators in various end-use industries, including telecommunications, consumer electronics, and automotive. The market is also witnessing technological advancements, such as the development of compact and high-efficiency voltage regulators, which are expected to further fuel market growth.

What will be the Size of the Market During the Forecast Period?

Voltage Regulator Market Size

 Request Free Sample

  • The market refers to the industry that produces and supplies voltage regulators for various electronic devices and electrical systems. Voltage regulators are essential components in circuits that ensure a stable power supply by maintaining a constant output voltage despite variations in input voltage and load conditions. They are used in various applications, including telecommunications, power supplies, and electrical systems. Voltage regulators come in different types, including shunt regulators, switching voltage regulators, linear voltage regulators, electro mechanical regulators, and ferro resonant regulators. The choice of regulator type depends on the specific application requirements, such as energy efficiency, energy consumption, tolerance range, and load conditions.
  • Voltage regulation technologies have evolved significantly over the years, with switching regulators and linear regulators being the most common types. Switching regulators offer higher efficiency and smaller size, while linear regulators provide better stability and accuracy. Voltage regulators play a crucial role in preventing overvoltage and undervoltage conditions in power networks. They ensure that the output voltage remains within the tolerance range, providing a stable power supply to the load. The market is expected to grow significantly due to the increasing demand for energy-efficient power supplies and stable power supplies in various industries.

How is this market segmented and which is the largest segment?

The market research report provides comprehensive data (region-wise segment analysis), with forecasts and estimates in "USD million" for the period 2024-2028, as well as historical data from 2018-2022 for the following segments.
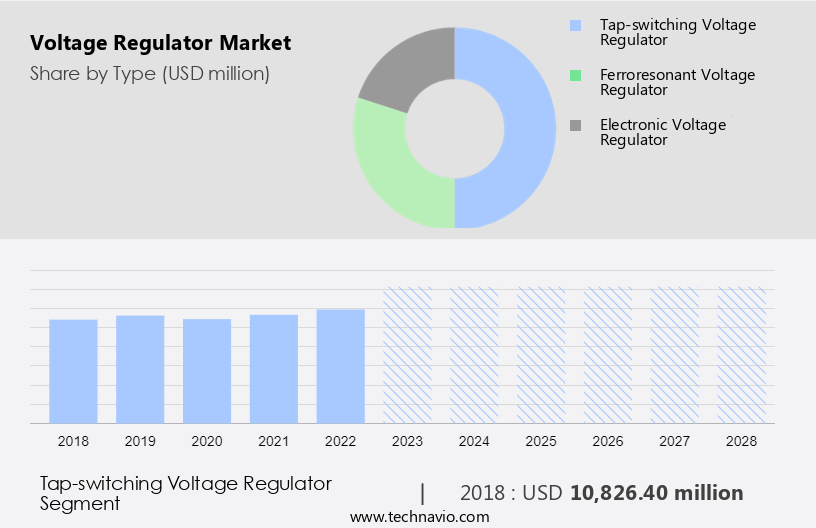
  • Type
    • Tap-switching voltage regulator
    • Ferroresonant voltage regulator
    • Electronic voltage regulator
  • End-user
    • Communications
    • Computer
    • Consumer electronics
    • Automotive
    • Others
  • Geography
    • APAC
      • China
      • Japan
      • South Korea
    • North America
      • US
    • Europe
      • Germany
    • South America
    • Middle East and Africa

By Type Insights

  • The tap-switching voltage regulator segment is estimated to witness significant growth during the forecast period.

Shunt regulators, a type of voltage regulation technology, provide a stable power supply by automatically adjusting voltage levels through the use of active components. These regulators differ from switching voltage regulators and linear voltage regulators in their mechanism, as they employ shunting of excess voltage to a grounded shunt resistor. This mechanism eliminates issues of voltage fluctuation, sag, and wave, while also mitigating transients, high-frequency impulses, and noise. Shunt regulators are particularly suitable for large-scale applications in power distribution networks, telecommunications, automobile, aerospace, and industrial sectors, where power management systems and electronic equipment require voltage control solutions. These applications often involve three-phase loads and larger kilo-volt ampere (KVA) sizes.

However, their size and cost make them less ideal for single-phase and lower KVA-rated applications. In the context of renewable energy sources such as solar and wind power, and the smart grid sector, shunt regulators play a crucial role in maintaining grid reliability and ensuring stable power supply. Intelligent equipment and communication technology in these sectors require precise voltage regulation, making shunt regulators a preferred choice. Additionally, in sectors like healthcare, shunt regulators ensure stable power supply for sensitive electronic gadgets like laptops, tablets, and portable electronics. Voltage regulation technologies, including static VAR compensators, linear regulators, switching regulators, electro mechanical regulators, and ferro resonant regulators, all contribute to the power grid infrastructure.

Voltage Regulator Market Size

Get a glance at the market report of share of various segments Request Free Sample

The tap-switching voltage regulator segment was valued at USD 10.83 billion in 2018 and showed a gradual increase during the forecast period.

Regional Analysis

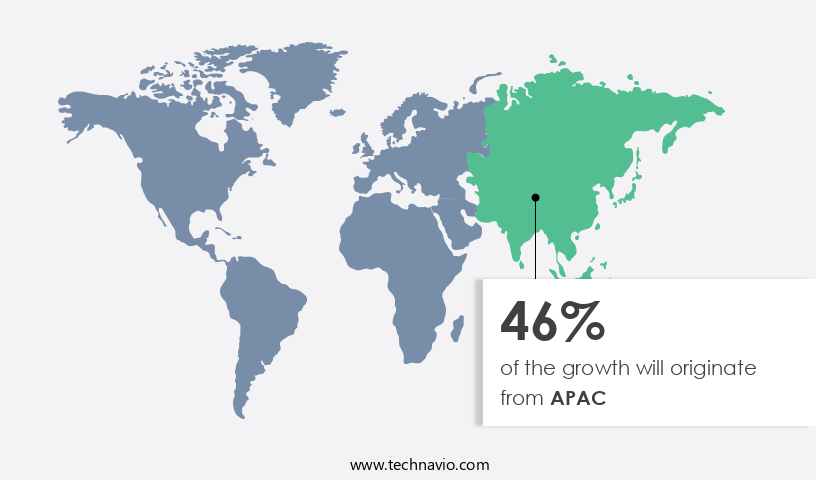
  • APAC is estimated to contribute 46% to the growth of the global market during the forecast period.

Technavio's analysts have elaborately explained the regional trends and drivers that shape the market during the forecast period.

Voltage Regulator Market Share by Geography

For more insights on the market share of various regions Request Free Sample

Voltage regulators are essential components in managing and maintaining stable power supplies for various electronic equipment and systems. Shunt regulators and switching voltage regulators are two primary types, with shunt regulators providing constant voltage by shunting excess current, while switching regulators use active control to regulate output voltage. Linear voltage regulators offer high accuracy but consume more power, while digital control mechanisms enable better precision and efficiency. Voltage regulation solutions are integral to numerous industries, including telecommunications, automobile, aerospace, healthcare, and renewable energy sources. IoT integration demands advanced voltage control mechanisms for power management systems in laptops, tablets, portable electronics, and smart grids.

Additionally, voltage regulation technologies are crucial for power distribution and grid reliability in sectors like telecommunications, smart grids, and power outage prevention. Static VAR compensators, linear regulators, switching regulators, electro mechanical regulators, and ferro resonant regulators are some voltage regulation technologies employed in power grids. Copper and aluminum are common conductors used in high voltage systems, while silicon is a primary material in semiconductor-based voltage regulators. Renewable energy sources like solar and wind power require efficient voltage regulation for optimal performance and grid integration.

Market Dynamics

Our researchers analyzed the data with 2023 as the base year, along with the key drivers, trends, and challenges. A holistic analysis of drivers will help companies refine their marketing strategies to gain a competitive advantage.

What are the key market drivers leading to the rise in adoption of Voltage Regulator Market?

The rapid growth of IoT is the key driver of the market.

  • The market encompasses various types of voltage regulation technologies, including linear, switching, electro mechanical, electronic tap switching, ferro resonant, single phase, and three phase. These regulators play a crucial role in the efficient operation of various applications, particularly in the context of the growing number of renewable energy installations. The Linear segment and Industrial segment are major contributors to the market, while the Telecommunications sector also presents significant growth opportunities.
  • Power converters, a key application area, are integral to the functioning of IoT devices, which are projected to reach 500 billion worldwide by 2030. Technological advancements in wired and wireless communication, telecommunication standards, and human-machine interface technologies are driving the demand for these devices. Voltage regulators ensure the stable and consistent power supply required by these devices, thereby facilitating their seamless integration into advanced technology-driven systems and solutions.

What are the market trends shaping the Voltage Regulator Market?

The growing popularity of smart wearables is the upcoming trend in the market.

  • The market is witnessing significant growth due to the increasing adoption in various industries, including renewable energy installations, industrial applications, and the telecommunications sector. Voltage regulators are essential components in power systems, ensuring stable voltage levels for efficient power transmission and utilization. Two major types of voltage regulators are linear and switching regulators. Linear regulators are commonly used in single-phase applications, while switching regulators are preferred for three-phase systems.
  • Advanced technologies such as electro mechanical, electronic tap switching, ferro resonant, and power converters are gaining popularity in the market. Industrial applications, particularly in manufacturing and power generation, account for a significant market share. The telecommunications sector also contributes significantly to the market growth due to the increasing demand for reliable power supplies in telecom infrastructure.

What challenges does Voltage Regulator Market face during the growth?

US-China trade war is a key challenge affecting market growth.

  • The market is witnessing significant growth, driven by the increasing demand from various end-use industries such as renewable energy installations, industrial applications, and telecommunications sector. Voltage regulators are essential components in power systems to maintain a constant voltage level. Two major types of voltage regulators are linear and switching regulators. Linear regulators are electro-mechanical devices, while switching regulators are electronic tap switching and ferro resonant. Single-phase and three-phase voltage regulators are used in different applications based on the power requirements. The industrial segment is a significant contributor to the market's growth due to the increasing demand for power converters in various industries.
  • The renewable energy sector is also expected to provide significant growth opportunities to the market due to the increasing adoption of solar and wind energy installations. The market is further segmented into single-phase and three-phase voltage regulators, with the three-phase segment holding a larger market share due to its extensive use in industrial applications. The market is expected to continue its growth trajectory in the coming years, driven by the increasing demand from various end-use industries and the ongoing technological advancements in power electronics.

Exclusive Customer Landscape

The market forecasting report includes the adoption lifecycle of the market, covering from the innovator's stage to the laggard's stage. It focuses on adoption rates in different regions based on penetration. Furthermore, the market report also includes key purchase criteria and drivers of price sensitivity to help companies evaluate and develop their market growth analysis strategies.
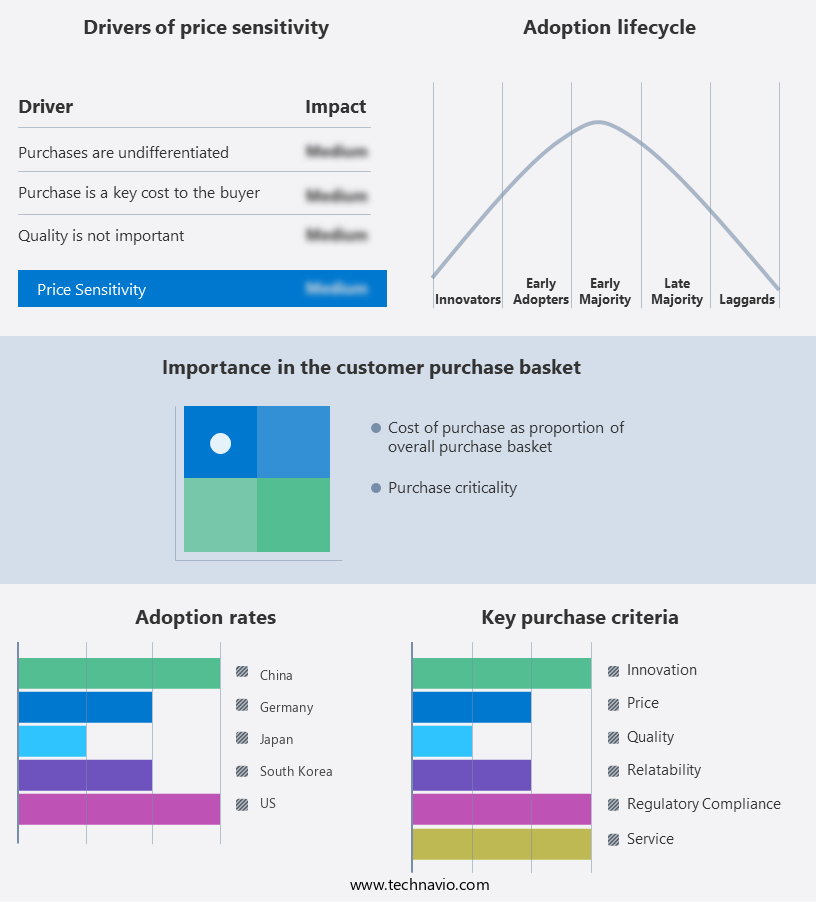
Voltage Regulator Market Share by Geography

 Customer Landscape

Key Companies & Market Insights

Companies are implementing various strategies, such as strategic alliances, market forecast, partnerships, mergers and acquisitions, geographical expansion, and product/service launches, to enhance their presence in the market. The market research and growth report includes detailed analyses of the competitive landscape of the market and information about key companies, including:

  • ABB Ltd.
  • Analog Devices Inc.
  • Diodes Inc.
  • Eaton Corp. Plc
  • General Electric Co.
  • Infineon Technologies AG
  • Microchip Technology Inc.
  • NXP Semiconductors NV
  • ON Semiconductor Corp.
  • Renesas Electronics Corp.
  • Ricoh Co. Ltd.
  • ROHM Co. Ltd.
  • Schweitzer Engineering Laboratories Inc.
  • Semtech Corp.
  • STMicroelectronics International N.V.
  • Texas Instruments Inc.
  • Torex Semiconductor Ltd.
  • Toshiba Corp.
  • VICOR CORPORATION
  • Vishay Intertechnology Inc.

Qualitative and quantitative analysis of companies has been conducted to help clients understand the wider business environment as well as the strengths and weaknesses of key market players. Data is qualitatively analyzed to categorize companies as pure play, category-focused, industry-focused, and diversified; it is quantitatively analyzed to categorize companies as dominant, leading, strong, tentative, and weak.

Research Analyst Overview

The market caters to the demand for maintaining a consistent output voltage in electronic devices, despite fluctuations in input voltage or load conditions. Voltage regulators are crucial components in various electronic circuits and power supplies, ensuring energy efficiency and minimizing energy consumption. They are extensively used in battery-powered devices, portable devices, and electronic equipment across numerous sectors. In the Renewable energy sector, voltage regulators play a significant role in solar and wind power generation systems, ensuring stable power output. Data centers, cloud computing, digital services, and IT infrastructure also rely on voltage regulators for uninterrupted power supply. Industrial automation, robotics, manufacturing, and IoT applications further expand the market's scope. Small businesses and industrial settings also utilize voltage regulators in smart homes, home automation systems, smart TVs, computers, gaming consoles, and other electrical systems. Voltage regulators protect against overvoltage and undervoltage conditions, ensuring the reliable functioning of electrical networks and power systems.

Market Scope

Report Coverage

Details

Page number

192

Base year

2023

Historic period

2018-2022

Forecast period

2024-2028

Growth momentum & CAGR

Accelerate at a CAGR of 7.53%

Market Growth 2024-2028

USD 12.03 billion

Market structure

Fragmented

YoY growth 2023-2024(%)

6.86

Key countries

China, US, South Korea, Germany, and Japan

Competitive landscape

Leading Companies, Market Positioning of Companies, Competitive Strategies, and Industry Risks

Request Free Sample

What are the Key Data Covered in this Market Research and Growth Report?

  • CAGR of the market during the forecast period
  • Detailed information on factors that will drive the market growth and forecasting between 2024 and 2028
  • Precise estimation of the size of the market  and its contribution of the market in focus to the parent market
  • Accurate predictions about upcoming market growth and trends and changes in consumer behaviour
  • Growth of the market across APAC, North America, Europe, South America, and Middle East and Africa
  • Thorough analysis of the market's competitive landscape and detailed information about companies
  • Comprehensive analysis of factors that will challenge the growth of market companies

We can help! Our analysts can customize this market research report to meet your requirements. Get in touch

1 Executive Summary

  • 1.1 Market overview
    • Executive Summary - Chart on Market Overview
    • Executive Summary - Data Table on Market Overview
    • Executive Summary - Chart on Global Market Characteristics
    • Executive Summary - Chart on Market by Geography
    • Executive Summary - Chart on Market Segmentation by Type
    • Executive Summary - Chart on Market Segmentation by End-user
    • Executive Summary - Chart on Incremental Growth
    • Executive Summary - Data Table on Incremental Growth
    • Executive Summary - Chart on Company Market Positioning

2 Market Landscape

  • 2.1 Market ecosystem
    • Parent Market
    • Data Table on - Parent Market
  • 2.2 Market characteristics
    • Market characteristics analysis
  • 2.3 Value chain analysis
    • Value Chain Analysis

3 Market Sizing

  • 3.1 Market definition
    • Offerings of companies included in the market definition
  • 3.2 Market segment analysis
    • Market segments
  • 3.3 Market size 2023
    • 3.4 Market outlook: Forecast for 2023-2028
      • Chart on Global - Market size and forecast 2023-2028 ($ million)
      • Data Table on Global - Market size and forecast 2023-2028 ($ million)
      • Chart on Global Market: Year-over-year growth 2023-2028 (%)
      • Data Table on Global Market: Year-over-year growth 2023-2028 (%)

    4 Historic Market Size

    • 4.1 Global Voltage Regulator Market 2018 - 2022
      • Historic Market Size - Data Table on Global Voltage Regulator Market 2018 - 2022 ($ million)
    • 4.2 Type segment analysis 2018 - 2022
      • Historic Market Size - Type Segment 2018 - 2022 ($ million)
    • 4.3 End-user segment analysis 2018 - 2022
      • Historic Market Size - End-user Segment 2018 - 2022 ($ million)
    • 4.4 Geography segment analysis 2018 - 2022
      • Historic Market Size - Geography Segment 2018 - 2022 ($ million)
    • 4.5 Country segment analysis 2018 - 2022
      • Historic Market Size - Country Segment 2018 - 2022 ($ million)

    5 Five Forces Analysis

    • 5.1 Five forces summary
      • Five forces analysis - Comparison between 2023 and 2028
    • 5.2 Bargaining power of buyers
      • Bargaining power of buyers - Impact of key factors 2023 and 2028
    • 5.3 Bargaining power of suppliers
      • Bargaining power of suppliers - Impact of key factors in 2023 and 2028
    • 5.4 Threat of new entrants
      • Threat of new entrants - Impact of key factors in 2023 and 2028
    • 5.5 Threat of substitutes
      • Threat of substitutes - Impact of key factors in 2023 and 2028
    • 5.6 Threat of rivalry
      • Threat of rivalry - Impact of key factors in 2023 and 2028
    • 5.7 Market condition
      • Chart on Market condition - Five forces 2023 and 2028

    6 Market Segmentation by Type

    • 6.1 Market segments
      • Chart on Type - Market share 2023-2028 (%)
      • Data Table on Type - Market share 2023-2028 (%)
    • 6.2 Comparison by Type
      • Chart on Comparison by Type
      • Data Table on Comparison by Type
    • 6.3 Tap-switching voltage regulator - Market size and forecast 2023-2028
      • Chart on Tap-switching voltage regulator - Market size and forecast 2023-2028 ($ million)
      • Data Table on Tap-switching voltage regulator - Market size and forecast 2023-2028 ($ million)
      • Chart on Tap-switching voltage regulator - Year-over-year growth 2023-2028 (%)
      • Data Table on Tap-switching voltage regulator - Year-over-year growth 2023-2028 (%)
    • 6.4 Ferroresonant voltage regulator - Market size and forecast 2023-2028
      • Chart on Ferroresonant voltage regulator - Market size and forecast 2023-2028 ($ million)
      • Data Table on Ferroresonant voltage regulator - Market size and forecast 2023-2028 ($ million)
      • Chart on Ferroresonant voltage regulator - Year-over-year growth 2023-2028 (%)
      • Data Table on Ferroresonant voltage regulator - Year-over-year growth 2023-2028 (%)
    • 6.5 Electronic voltage regulator - Market size and forecast 2023-2028
      • Chart on Electronic voltage regulator - Market size and forecast 2023-2028 ($ million)
      • Data Table on Electronic voltage regulator - Market size and forecast 2023-2028 ($ million)
      • Chart on Electronic voltage regulator - Year-over-year growth 2023-2028 (%)
      • Data Table on Electronic voltage regulator - Year-over-year growth 2023-2028 (%)
    • 6.6 Market opportunity by Type
      • Market opportunity by Type ($ million)
      • Data Table on Market opportunity by Type ($ million)

    7 Market Segmentation by End-user

    • 7.1 Market segments
      • Chart on End-user - Market share 2023-2028 (%)
      • Data Table on End-user - Market share 2023-2028 (%)
    • 7.2 Comparison by End-user
      • Chart on Comparison by End-user
      • Data Table on Comparison by End-user
    • 7.3 Communications - Market size and forecast 2023-2028
      • Chart on Communications - Market size and forecast 2023-2028 ($ million)
      • Data Table on Communications - Market size and forecast 2023-2028 ($ million)
      • Chart on Communications - Year-over-year growth 2023-2028 (%)
      • Data Table on Communications - Year-over-year growth 2023-2028 (%)
    • 7.4 Computer - Market size and forecast 2023-2028
      • Chart on Computer - Market size and forecast 2023-2028 ($ million)
      • Data Table on Computer - Market size and forecast 2023-2028 ($ million)
      • Chart on Computer - Year-over-year growth 2023-2028 (%)
      • Data Table on Computer - Year-over-year growth 2023-2028 (%)
    • 7.5 Consumer electronics - Market size and forecast 2023-2028
      • Chart on Consumer electronics - Market size and forecast 2023-2028 ($ million)
      • Data Table on Consumer electronics - Market size and forecast 2023-2028 ($ million)
      • Chart on Consumer electronics - Year-over-year growth 2023-2028 (%)
      • Data Table on Consumer electronics - Year-over-year growth 2023-2028 (%)
    • 7.6 Automotive - Market size and forecast 2023-2028
      • Chart on Automotive - Market size and forecast 2023-2028 ($ million)
      • Data Table on Automotive - Market size and forecast 2023-2028 ($ million)
      • Chart on Automotive - Year-over-year growth 2023-2028 (%)
      • Data Table on Automotive - Year-over-year growth 2023-2028 (%)
    • 7.7 Others - Market size and forecast 2023-2028
      • Chart on Others - Market size and forecast 2023-2028 ($ million)
      • Data Table on Others - Market size and forecast 2023-2028 ($ million)
      • Chart on Others - Year-over-year growth 2023-2028 (%)
      • Data Table on Others - Year-over-year growth 2023-2028 (%)
    • 7.8 Market opportunity by End-user
      • Market opportunity by End-user ($ million)
      • Data Table on Market opportunity by End-user ($ million)

    8 Customer Landscape

    • 8.1 Customer landscape overview
      • Analysis of price sensitivity, lifecycle, customer purchase basket, adoption rates, and purchase criteria

    9 Geographic Landscape

    • 9.1 Geographic segmentation
      • Chart on Market share by geography 2023-2028 (%)
      • Data Table on Market share by geography 2023-2028 (%)
    • 9.2 Geographic comparison
      • Chart on Geographic comparison
      • Data Table on Geographic comparison
    • 9.3 APAC - Market size and forecast 2023-2028
      • Chart on APAC - Market size and forecast 2023-2028 ($ million)
      • Data Table on APAC - Market size and forecast 2023-2028 ($ million)
      • Chart on APAC - Year-over-year growth 2023-2028 (%)
      • Data Table on APAC - Year-over-year growth 2023-2028 (%)
    • 9.4 North America - Market size and forecast 2023-2028
      • Chart on North America - Market size and forecast 2023-2028 ($ million)
      • Data Table on North America - Market size and forecast 2023-2028 ($ million)
      • Chart on North America - Year-over-year growth 2023-2028 (%)
      • Data Table on North America - Year-over-year growth 2023-2028 (%)
    • 9.5 Europe - Market size and forecast 2023-2028
      • Chart on Europe - Market size and forecast 2023-2028 ($ million)
      • Data Table on Europe - Market size and forecast 2023-2028 ($ million)
      • Chart on Europe - Year-over-year growth 2023-2028 (%)
      • Data Table on Europe - Year-over-year growth 2023-2028 (%)
    • 9.6 South America - Market size and forecast 2023-2028
      • Chart on South America - Market size and forecast 2023-2028 ($ million)
      • Data Table on South America - Market size and forecast 2023-2028 ($ million)
      • Chart on South America - Year-over-year growth 2023-2028 (%)
      • Data Table on South America - Year-over-year growth 2023-2028 (%)
    • 9.7 Middle East and Africa - Market size and forecast 2023-2028
      • Chart on Middle East and Africa - Market size and forecast 2023-2028 ($ million)
      • Data Table on Middle East and Africa - Market size and forecast 2023-2028 ($ million)
      • Chart on Middle East and Africa - Year-over-year growth 2023-2028 (%)
      • Data Table on Middle East and Africa - Year-over-year growth 2023-2028 (%)
    • 9.8 China - Market size and forecast 2023-2028
      • Chart on China - Market size and forecast 2023-2028 ($ million)
      • Data Table on China - Market size and forecast 2023-2028 ($ million)
      • Chart on China - Year-over-year growth 2023-2028 (%)
      • Data Table on China - Year-over-year growth 2023-2028 (%)
    • 9.9 US - Market size and forecast 2023-2028
      • Chart on US - Market size and forecast 2023-2028 ($ million)
      • Data Table on US - Market size and forecast 2023-2028 ($ million)
      • Chart on US - Year-over-year growth 2023-2028 (%)
      • Data Table on US - Year-over-year growth 2023-2028 (%)
    • 9.10 South Korea - Market size and forecast 2023-2028
      • Chart on South Korea - Market size and forecast 2023-2028 ($ million)
      • Data Table on South Korea - Market size and forecast 2023-2028 ($ million)
      • Chart on South Korea - Year-over-year growth 2023-2028 (%)
      • Data Table on South Korea - Year-over-year growth 2023-2028 (%)
    • 9.11 Germany - Market size and forecast 2023-2028
      • Chart on Germany - Market size and forecast 2023-2028 ($ million)
      • Data Table on Germany - Market size and forecast 2023-2028 ($ million)
      • Chart on Germany - Year-over-year growth 2023-2028 (%)
      • Data Table on Germany - Year-over-year growth 2023-2028 (%)
    • 9.12 Japan - Market size and forecast 2023-2028
      • Chart on Japan - Market size and forecast 2023-2028 ($ million)
      • Data Table on Japan - Market size and forecast 2023-2028 ($ million)
      • Chart on Japan - Year-over-year growth 2023-2028 (%)
      • Data Table on Japan - Year-over-year growth 2023-2028 (%)
    • 9.13 Market opportunity by geography
      • Market opportunity by geography ($ million)
      • Data Tables on Market opportunity by geography ($ million)

    10 Drivers, Challenges, and Opportunity/Restraints

    • 10.1 Market drivers
      • 10.2 Market challenges
        • 10.3 Impact of drivers and challenges
          • Impact of drivers and challenges in 2023 and 2028
        • 10.4 Market opportunities/restraints

          11 Competitive Landscape

          • 11.1 Overview
            • 11.2 Competitive Landscape
              • Overview on criticality of inputs and factors of differentiation
            • 11.3 Landscape disruption
              • Overview on factors of disruption
            • 11.4 Industry risks
              • Impact of key risks on business

            12 Competitive Analysis

            • 12.1 Companies profiled
              • Companies covered
            • 12.2 Market positioning of companies
              • Matrix on companies position and classification
            • 12.3 ABB Ltd.
              • ABB Ltd. - Overview
              • ABB Ltd. - Business segments
              • ABB Ltd. - Key news
              • ABB Ltd. - Key offerings
              • ABB Ltd. - Segment focus
            • 12.4 Analog Devices Inc.
              • Analog Devices Inc. - Overview
              • Analog Devices Inc. - Business segments
              • Analog Devices Inc. - Key news
              • Analog Devices Inc. - Key offerings
              • Analog Devices Inc. - Segment focus
            • 12.5 Diodes Inc.
              • Diodes Inc. - Overview
              • Diodes Inc. - Product / Service
              • Diodes Inc. - Key news
              • Diodes Inc. - Key offerings
            • 12.6 Eaton Corp. Plc
              • Eaton Corp. Plc - Overview
              • Eaton Corp. Plc - Business segments
              • Eaton Corp. Plc - Key news
              • Eaton Corp. Plc - Key offerings
              • Eaton Corp. Plc - Segment focus
            • 12.7 General Electric Co.
              • General Electric Co. - Overview
              • General Electric Co. - Business segments
              • General Electric Co. - Key news
              • General Electric Co. - Key offerings
              • General Electric Co. - Segment focus
            • 12.8 Infineon Technologies AG
              • Infineon Technologies AG - Overview
              • Infineon Technologies AG - Business segments
              • Infineon Technologies AG - Key news
              • Infineon Technologies AG - Key offerings
              • Infineon Technologies AG - Segment focus
            • 12.9 Microchip Technology Inc.
              • Microchip Technology Inc. - Overview
              • Microchip Technology Inc. - Business segments
              • Microchip Technology Inc. - Key news
              • Microchip Technology Inc. - Key offerings
              • Microchip Technology Inc. - Segment focus
            • 12.10 ON Semiconductor Corp.
              • ON Semiconductor Corp. - Overview
              • ON Semiconductor Corp. - Business segments
              • ON Semiconductor Corp. - Key news
              • ON Semiconductor Corp. - Key offerings
              • ON Semiconductor Corp. - Segment focus
            • 12.11 Renesas Electronics Corp.
              • Renesas Electronics Corp. - Overview
              • Renesas Electronics Corp. - Business segments
              • Renesas Electronics Corp. - Key news
              • Renesas Electronics Corp. - Key offerings
              • Renesas Electronics Corp. - Segment focus
            • 12.12 Ricoh Co. Ltd.
              • Ricoh Co. Ltd. - Overview
              • Ricoh Co. Ltd. - Business segments
              • Ricoh Co. Ltd. - Key news
              • Ricoh Co. Ltd. - Key offerings
              • Ricoh Co. Ltd. - Segment focus
            • 12.13 ROHM Co. Ltd.
              • ROHM Co. Ltd. - Overview
              • ROHM Co. Ltd. - Business segments
              • ROHM Co. Ltd. - Key news
              • ROHM Co. Ltd. - Key offerings
              • ROHM Co. Ltd. - Segment focus
            • 12.14 Texas Instruments Inc.
              • Texas Instruments Inc. - Overview
              • Texas Instruments Inc. - Business segments
              • Texas Instruments Inc. - Key news
              • Texas Instruments Inc. - Key offerings
              • Texas Instruments Inc. - Segment focus
            • 12.15 Torex Semiconductor Ltd.
              • Torex Semiconductor Ltd. - Overview
              • Torex Semiconductor Ltd. - Business segments
              • Torex Semiconductor Ltd. - Key offerings
              • Torex Semiconductor Ltd. - Segment focus
            • 12.16 Toshiba Corp.
              • Toshiba Corp. - Overview
              • Toshiba Corp. - Business segments
              • Toshiba Corp. - Key news
              • Toshiba Corp. - Key offerings
              • Toshiba Corp. - Segment focus
            • 12.17 VICOR CORPORATION
              • VICOR CORPORATION - Overview
              • VICOR CORPORATION - Product / Service
              • VICOR CORPORATION - Key offerings

            13 Appendix

            • 13.1 Scope of the report
              • 13.2 Inclusions and exclusions checklist
                • Inclusions checklist
                • Exclusions checklist
              • 13.3 Currency conversion rates for US$
                • Currency conversion rates for US$
              • 13.4 Research methodology
                • Research methodology
              • 13.5 Data procurement
                • Information sources
              • 13.6 Data validation
                • Data validation
              • 13.7 Validation techniques employed for market sizing
                • Validation techniques employed for market sizing
              • 13.8 Data synthesis
                • Data synthesis
              • 13.9 360 degree market analysis
                • 360 degree market analysis
              • 13.10 List of abbreviations
                • List of abbreviations

              Research Methodology

              Technavio presents a detailed picture of the market by way of study, synthesis, and summation of data from multiple sources. The analysts have presented the various facets of the market with a particular focus on identifying the key industry influencers. The data thus presented is comprehensive, reliable, and the result of extensive research, both primary and secondary.

              INFORMATION SOURCES

              Primary sources

              • Manufacturers and suppliers
              • Channel partners
              • Industry experts
              • Strategic decision makers

              Secondary sources

              • Industry journals and periodicals
              • Government data
              • Financial reports of key industry players
              • Historical data
              • Press releases

              DATA ANALYSIS

              Data Synthesis

              • Collation of data
              • Estimation of key figures
              • Analysis of derived insights

              Data Validation

              • Triangulation with data models
              • Reference against proprietary databases
              • Corroboration with industry experts

              REPORT WRITING

              Qualitative

              • Market drivers
              • Market challenges
              • Market trends
              • Five forces analysis

              Quantitative

              • Market size and forecast
              • Market segmentation
              • Geographical insights
              • Competitive landscape

              Interested in this report?

              Get your sample now to see our research methodology and insights!

              Download Now

              Frequently Asked Questions

              Voltage Regulator market growth will increase by $ 12026 mn during 2024-2028.

              The Voltage Regulator market is expected to grow at a CAGR of 7.53% during 2024-2028.

              Voltage Regulator market is segmented by Type( Tap-switching voltage regulator, Ferroresonant voltage regulator, Electronic voltage regulator, Automotive, Others) End-user( Communications, Computer, Consumer electronics, Automotive, Others)

              ABB Ltd., Analog Devices Inc., Diodes Inc., Eaton Corp. Plc, General Electric Co., Infineon Technologies AG, Microchip Technology Inc., NXP Semiconductors NV, ON Semiconductor Corp., Renesas Electronics Corp., Ricoh Co. Ltd., ROHM Co. Ltd., Schweitzer Engineering Laboratories Inc., Semtech Corp., STMicroelectronics International N.V., Texas Instruments Inc., Torex Semiconductor Ltd., Toshiba Corp., VICOR CORPORATION, Vishay Intertechnology Inc. are a few of the key vendors in the Voltage Regulator market.

              APAC will register the highest growth rate of 46% among the other regions. Therefore, the Voltage Regulator market in APAC is expected to garner significant business opportunities for the vendors during the forecast period.

              China, US, South Korea, Germany, Japan

              • Rapid growth of IoTThe IoT is a system of interrelated devices or things that have embedded electronics is the driving factor this market.
              • software is the driving factor this market.
              • sensors is the driving factor this market.
              • and network connectivity. The IoT technology enables an Internet-connected device to use various sensors and actuators to collect is the driving factor this market.
              • record is the driving factor this market.
              • and transmit data to other computing devices on a real-time basis. The demand for these IoT devices is primarily being driven by the developments in wired and wireless communication technologies is the driving factor this market.
              • telecommunication standards is the driving factor this market.
              • human-machine interface (HMI) technologies is the driving factor this market.
              • and initiatives taken by governments to implement advanced technology-driven systems and solutions to improve operational efficiency. It is to be noted that Cisco estimates the total number of connected devices across the globe to reach 500 billion by 2030. IoT devices are equipped with semiconductor integrated circuits (ICs) is the driving factor this market.
              • microcontrollers is the driving factor this market.
              • sensors is the driving factor this market.
              • and other analogs and digital components. The robust growth of the IoT in all key geographies is increasing the demand for IoT chipsets for integration into IoT devices. Reportedly is the driving factor this market.
              • spending on the Internet of Things (IoT) across enterprises increased by 22.0% to $158 billion in 2021. This is the driving factor this market.
              • in turn is the driving factor this market.
              • is driving the demand for voltage regulators and propel the market in focus during the forecast period. is the driving factor this market.

              The Voltage Regulator market vendors should focus on grabbing business opportunities from the Tap-switching voltage regulator segment as it accounted for the largest market share in the base year.
              RIA - Research AI Assistant
              Ask RIA