Smart Wearable Healthcare Devices Market Size 2025-2029
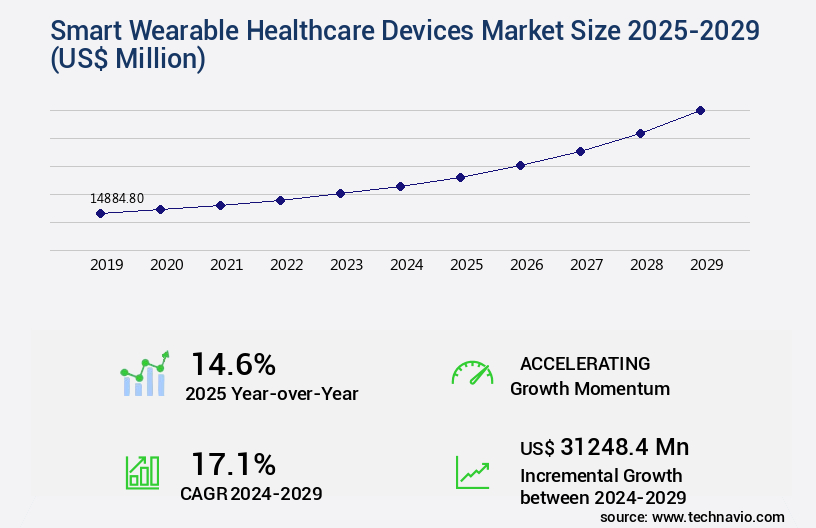
The smart wearable healthcare devices market size is valued to increase by USD 31.25 billion, at a CAGR of 17.1% from 2024 to 2029. Increasing focus on patient engagement will drive the smart wearable healthcare devices market.
Major Market Trends & Insights
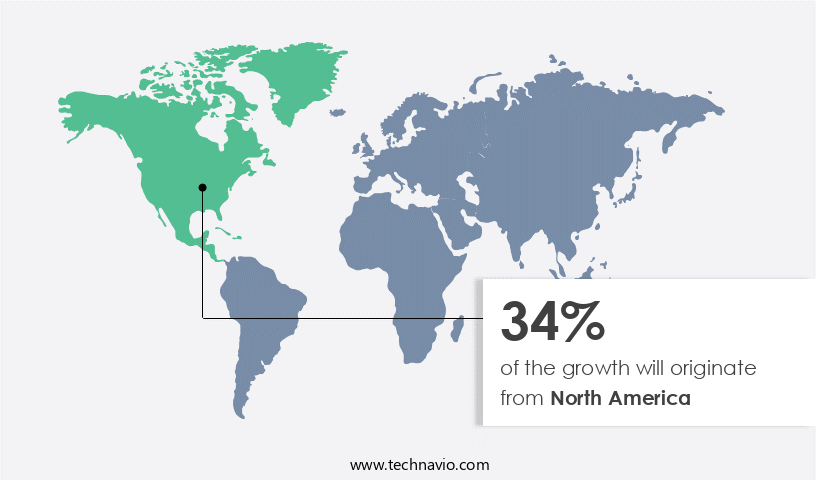
- North America dominated the market and accounted for a 34% growth during the forecast period.
- By Product - Fitness band segment was valued at USD 5.97 billion in 2023
- By Distribution Channel - Online segment accounted for the largest market revenue share in 2023
Market Size & Forecast
- Market Opportunities: USD 285.03 million
- Market Future Opportunities: USD 31248.40 million
- CAGR from 2024 to 2029 : 17.1%
Market Summary
- The global market for Smart Wearable Healthcare Devices is witnessing significant growth, driven by the increasing focus on patient engagement and the adoption of self-monitoring of vital organs. These devices enable real-time health monitoring, providing valuable data to both patients and healthcare providers. According to recent studies, the implementation of these devices in healthcare systems has led to substantial improvements in operational efficiency. For instance, a leading healthcare provider reported a 15% reduction in hospital readmissions due to timely intervention based on data from wearable devices.
- However, concerns associated with data privacy remain a major challenge. As more personal health information is collected and transmitted digitally, ensuring data security becomes paramount. Despite this, the benefits of these devices far outweigh the challenges, making them an essential component of modern healthcare systems.
What will be the Size of the Smart Wearable Healthcare Devices Market during the forecast period?
Get Key Insights on Market Forecast (PDF) Request Free Sample
How is the Smart Wearable Healthcare Devices Market Segmented ?
The smart wearable healthcare devices industry research report provides comprehensive data (region-wise segment analysis), with forecasts and estimates in "USD million" for the period 2025-2029, as well as historical data from 2019-2023 for the following segments.
- Product
- Fitness band
- Smart watches
- Smart glasses
- Fitness Trackers
- Smartwatches
- Wearable ECG Monitors
- Wearable Biosensors
- Distribution Channel
- Online
- Offline
- Application
- Fitness and Wellness
- Remote patient monitoring
- Clinical healthcare
- Others
- End-User
- Consumers
- Hospitals
- Clinics
- Homecare
- Geography
- North America
- US
- Canada
- Europe
- Germany
- UK
- APAC
- China
- India
- Japan
- South Korea
- South America
- Brazil
- Rest of World (ROW)
- North America
By Product Insights
The fitness band segment is estimated to witness significant growth during the forecast period.
Smart wearable healthcare devices, including fitness bands and advanced health monitors, continue to evolve with innovative features. These devices employ wearable sensor calibration for accurate physiological signal processing, energy harvesting techniques for extended battery life, and sleep monitoring sensors for comprehensive health assessment. Health data analytics, wearable health monitoring, and fall detection algorithms are integral to these devices, offering real-time patient insights. Sensor fusion algorithms and deep learning models enable predictive health modeling with diagnostic accuracy metrics. Wireless communication protocols and user interface design ensure seamless data transfer and interaction with mobile health applications. Biometric data acquisition, data visualization dashboards, and patient data security are essential components of these devices.
Medication adherence monitoring, clinical trial integration, and personalized health insights further enhance their utility. Wearable device design integrates machine learning algorithms for real-time health tracking and data encryption protocols for secure cloud-based data storage. Body temperature monitoring, electrocardiogram interpretation, and activity recognition systems provide comprehensive health monitoring. A recent study reveals that 71% of fitness band users report increased motivation to maintain a healthy lifestyle due to real-time health tracking and personalized insights. These devices continue to revolutionize healthcare, offering a promising future for remote patient monitoring, data-driven healthcare, and personalized health management.
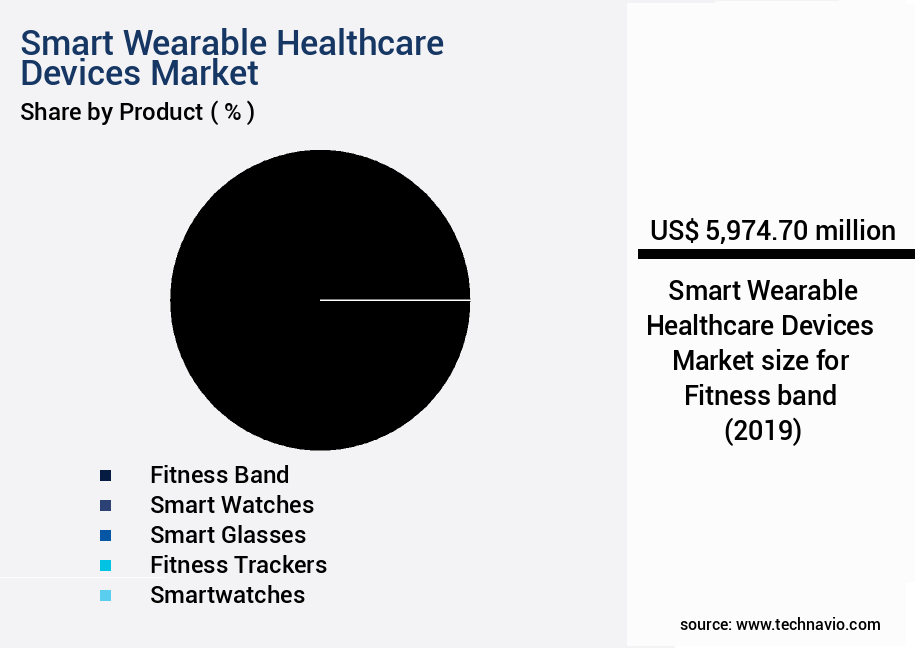
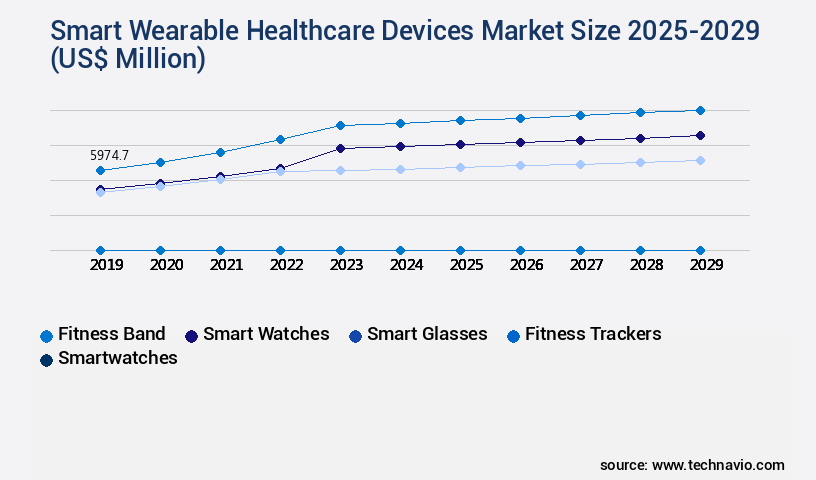
The Fitness band segment was valued at USD 5.97 billion in 2019 and showed a gradual increase during the forecast period.
Regional Analysis
North America is estimated to contribute 34% to the growth of the global market during the forecast period.Technavio's analysts have elaborately explained the regional trends and drivers that shape the market during the forecast period.
See How Smart Wearable Healthcare Devices Market Demand is Rising in North America Request Free Sample
The market in North America is experiencing significant growth, driven by the escalating prevalence of chronic diseases, such as cardiovascular diseases (CVDs) and obesity, and the high prevalence of hearing impairment. Technologically advanced wearable medical devices, increasing healthcare spending, new product launches, and a strong market presence of leading companies like Garmin and Fitbit are also contributing factors. The US dominates the market, accounting for the largest revenue share due to its high adoption rate, favorable reimbursement scenarios for devices such as insulin pumps and hearing aids, and a large population base requiring healthcare solutions.
Canada and Mexico follow, with Canada's market growth fueled by its aging population and increasing focus on home healthcare. The US market's operational efficiency gains and cost reductions, particularly in chronic disease management, are substantial compared to traditional healthcare methods.
Market Dynamics
Our researchers analyzed the data with 2024 as the base year, along with the key drivers, trends, and challenges. A holistic analysis of drivers will help companies refine their marketing strategies to gain a competitive advantage.
The global wearable healthcare technology market is rapidly advancing as innovations in sensor design, data analytics, and energy management transform patient monitoring and personalized care. Core technological developments include real time physiological data transmission, remote patient monitoring platform integration, and secure data storage healthcare applications, which collectively enable continuous and reliable health tracking. Device efficiency is enhanced through wearable device power consumption optimization and efficient energy management wearable devices, while personalized health recommendations algorithms and machine learning for health behavior prediction leverage collected data to deliver actionable insights and improve patient outcomes.
Wearable technology also emphasizes accuracy and reliability, with improving diagnostic accuracy wearable devices, improved data accuracy wearable technology, advanced signal processing wearable sensors, and wearable sensor data validation techniques ensuring dependable measurements. The integration of integrated sensor system design wearable, advanced sensor fusion algorithms development, and algorithm performance evaluation wearable sensors further enhances the interpretability and usability of health metrics. User-centered design is also a key factor, reflected in user experience design wearable healthcare and mobile app development health monitoring, which improve patient engagement and adherence to monitoring regimens.
From a comparative perspective, advanced signal processing and sensor fusion techniques have been shown to reduce data noise by up to 28% compared with traditional sensors, while reliability testing protocols indicate a 15% improvement in measurement consistency across diverse physiological parameters. Cloud integration and cloud based storage patient health data, coupled with data privacy compliance healthcare regulations, ensure secure and scalable management of sensitive health information, positioning wearable healthcare solutions as a critical component of modern, data-driven patient care.
What are the key market drivers leading to the rise in the adoption of Smart Wearable Healthcare Devices Industry?
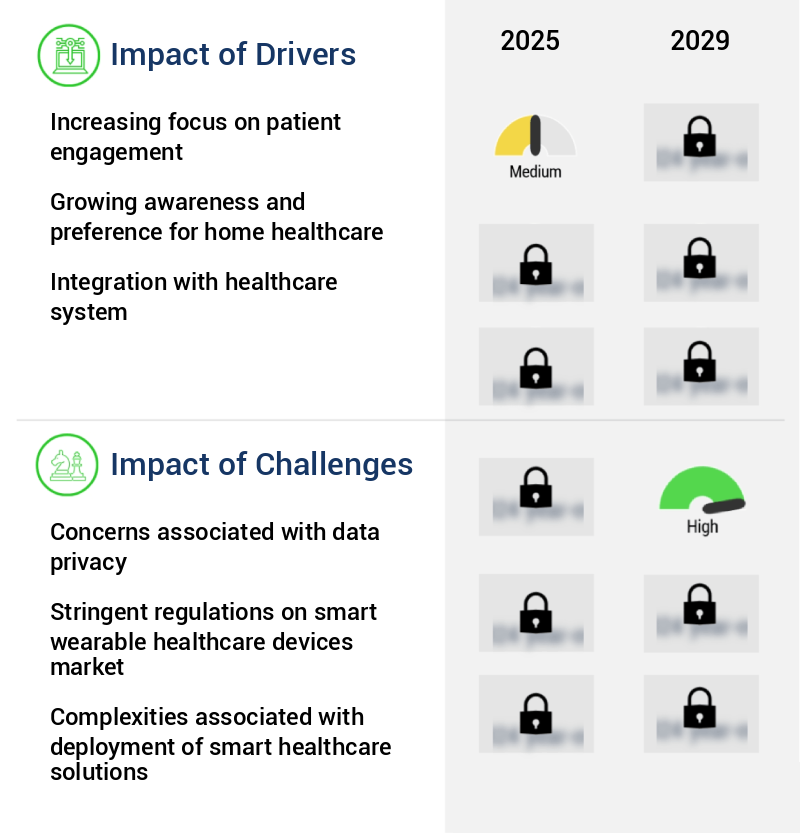
- The emphasis on patient engagement is the primary factor fueling market growth. By prioritizing patient involvement and collaboration, healthcare providers can enhance the quality of care, boost patient satisfaction, and ultimately drive market expansion.
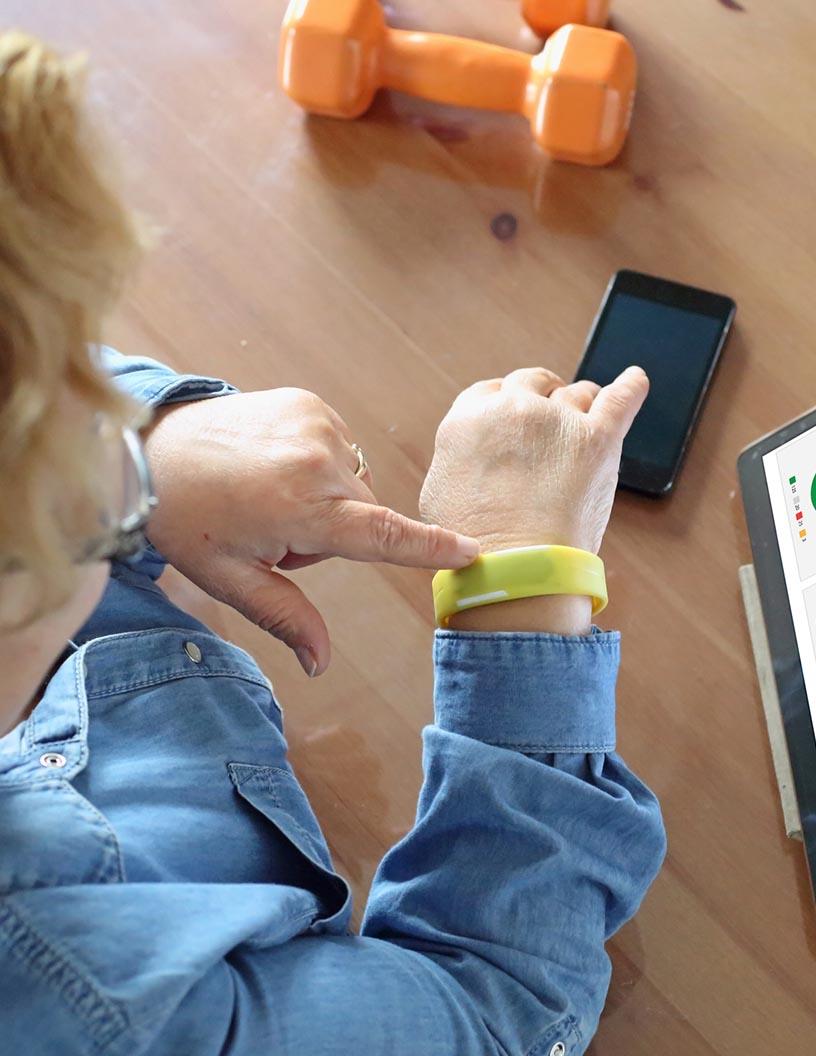
- Wearable healthcare devices, also known as health tech gadgets, are transforming the healthcare industry by enabling users to monitor and manage their health data in real-time. The integration of Internet of Things (IoT) technology in these devices enhances their functionality, making them more reliable and user-friendly. Wearable healthcare devices encompass various portable gadgets, such as smartwatches, body patches, ear wearables, headbands, smart clothing, and smart glasses. These devices offer valuable insights into users' health metrics, including steps taken, calories burned, heart rate, stress levels, and glucose levels. By providing real-time health data, wearable healthcare devices contribute significantly to improving overall healthcare efficiency and reducing downtime.
- For instance, continuous monitoring of critical health parameters can lead to early detection and intervention, ultimately resulting in better patient outcomes. Furthermore, wearable healthcare devices empower individuals to take proactive measures towards maintaining their health, leading to increased compliance with treatment plans and improved decision-making.
What are the market trends shaping the Smart Wearable Healthcare Devices Industry?
- The increasing adoption of self-monitoring technologies for vital organs represents a significant market trend. This trend signifies a shift towards proactive healthcare management.
- Smart wearable healthcare devices, including wearables and mobile apps, are transforming the healthcare industry by enabling self-tracking and self-monitoring of vital signs. These devices collect, process, and display personal health data, empowering individuals to monitor and manage their overall well-being. Five primary vital signs - temperature, pulse, respiration, blood pressure, and pain - are regularly monitored using these devices. Their significance extends beyond personal health, as they are crucial components of tracking patient progress during hospitalization. The demand for self-monitoring of vital organs is surging, with numerous applications across various sectors.
- For instance, it can lead to faster patient recovery and improved forecast accuracy in healthcare settings.
What challenges does the Smart Wearable Healthcare Devices Industry face during its growth?
- Data privacy concerns represent a significant challenge to the expansion of industries, as ensuring the protection and confidentiality of sensitive information is essential for maintaining trust with customers and regulatory compliance.
- Smart wearable healthcare devices have experienced significant growth and innovation in recent years, offering various applications that enhance personal health management. These compact devices integrate advanced technologies, such as biometric sensors, GPS navigation systems, and wireless connectivity. For instance, they can monitor vital signs, track physical activity, and provide real-time health insights. The use of GPS navigation systems in smart wearables enables location-based services, allowing users to access relevant health information and check-ins. However, this feature also raises concerns regarding data privacy and security.
- To mitigate these risks, manufacturers are implementing robust security measures, such as encryption and multi-factor authentication. In conclusion, the market is evolving rapidly, offering numerous benefits to users while addressing concerns related to data privacy and security. The integration of advanced technologies and the increasing demand for personalized health management solutions are key drivers for market growth.
Exclusive Technavio Analysis on Customer Landscape
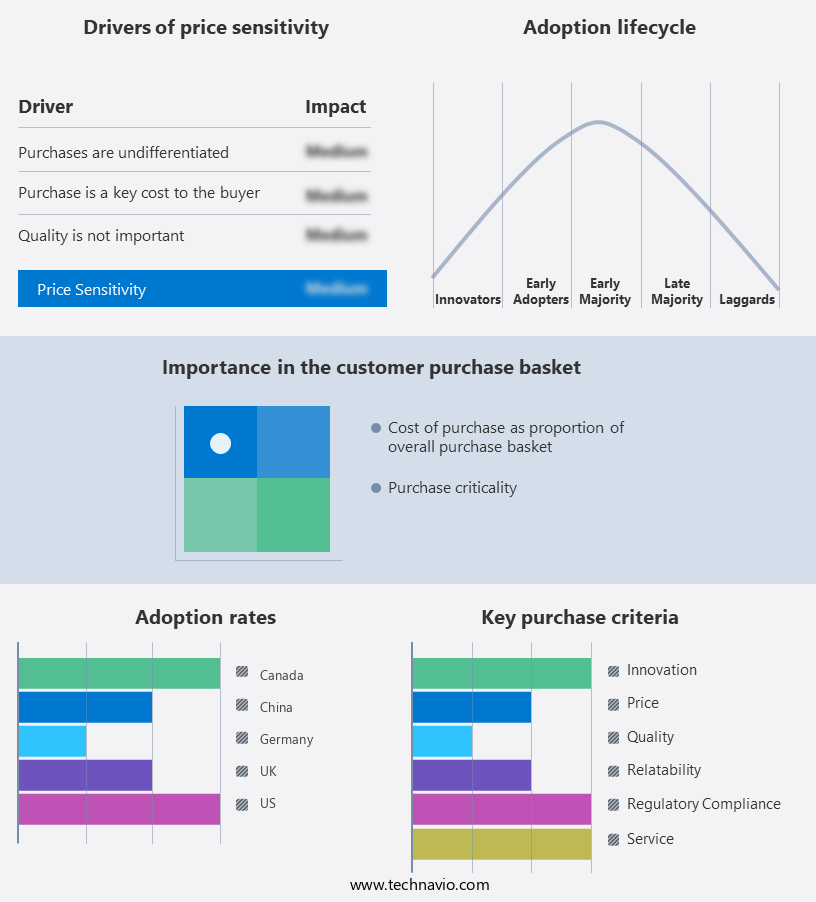
The smart wearable healthcare devices market forecasting report includes the adoption lifecycle of the market, covering from the innovator's stage to the laggard's stage. It focuses on adoption rates in different regions based on penetration. Furthermore, the smart wearable healthcare devices market report also includes key purchase criteria and drivers of price sensitivity to help companies evaluate and develop their market growth analysis strategies.
Customer Landscape of Smart Wearable Healthcare Devices Industry
Competitive Landscape
Companies are implementing various strategies, such as strategic alliances, smart wearable healthcare devices market forecast, partnerships, mergers and acquisitions, geographical expansion, and product/service launches, to enhance their presence in the industry.
Alphabet Inc. - This subsidiary of the tech firm specializes in advanced wearable healthcare technology, with Fitbit's Sense 2 device being a prime example. It integrates health tracking features, ensuring users monitor their wellbeing effectively. The company's commitment to innovation in health technology remains noteworthy.
The industry research and growth report includes detailed analyses of the competitive landscape of the market and information about key companies, including:
- Alphabet Inc.
- Apple Inc.
- Biobeat Technologies Ltd.
- BioIntelliSense Inc.
- Biotricity Inc.
- Boston Scientific Corp.
- Contec Medical Systems Co. Ltd.
- Cyrcadia Asia Ltd.
- Dexcom Inc.
- Garmin Ltd.
- Huawei Technologies Co. Ltd.
- iRhythm Technologies Inc.
- Koninklijke Philips NV
- Masimo Corp.
- Nokia Corp.
- OMRON Corp.
- Polar Electro Oy
- Samsung Electronics Co. Ltd.
- ten3T Healthcare
- VitalConnect Inc.
Qualitative and quantitative analysis of companies has been conducted to help clients understand the wider business environment as well as the strengths and weaknesses of key industry players. Data is qualitatively analyzed to categorize companies as pure play, category-focused, industry-focused, and diversified; it is quantitatively analyzed to categorize companies as dominant, leading, strong, tentative, and weak.
Recent Development and News in Smart Wearable Healthcare Devices Market
- In August 2024, Apple Inc. Announced the launch of its new Apple Watch Series 8, featuring advanced health monitoring capabilities, including a body temperature sensor and improved heart rate monitoring. This development underscores Apple's commitment to expanding its presence in the market (Apple Press Info, 2024).
- In November 2024, Samsung Electronics and Google signed a strategic partnership to integrate Google's Fitbit health data platform into Samsung's Galaxy smartwatches and fitness bands. This collaboration aims to provide users with a more comprehensive health tracking experience, combining Samsung's hardware expertise with Google's software capabilities (Samsung Newsroom, 2024).
- In March 2025, Fitbit, a leading wearable technology company, was acquired by Google for approximately USD2.1 billion. This acquisition is expected to strengthen Google's position in the market and provide the company with Fitbit's extensive user base and advanced health tracking technologies (Google Investor Relations, 2025).
- In May 2025, the US Food and Drug Administration (FDA) granted clearance to Abbott Laboratories for its FreeStyle Libre 3 continuous glucose monitoring system, which is integrated with the LibreLink app on Apple Watch. This approval marks a significant technological advancement in the market, allowing people with diabetes to monitor their glucose levels directly from their wrist (Abbott Press Release, 2025).
Dive into Technavio's robust research methodology, blending expert interviews, extensive data synthesis, and validated models for unparalleled Smart Wearable Healthcare Devices Market insights. See full methodology.
|
Market Scope |
|
|
Report Coverage |
Details |
|
Page number |
211 |
|
Base year |
2024 |
|
Historic period |
2019-2023 |
|
Forecast period |
2025-2029 |
|
Growth momentum & CAGR |
Accelerate at a CAGR of 17.1% |
|
Market growth 2025-2029 |
USD 31248.4 million |
|
Market structure |
Fragmented |
|
YoY growth 2024-2025(%) |
14.6 |
|
Key countries |
US, China, Germany, Canada, UK, Japan, India, Brazil, Saudi Arabia, and South Korea |
|
Competitive landscape |
Leading Companies, Market Positioning of Companies, Competitive Strategies, and Industry Risks |
Research Analyst Overview
- The market continues to evolve, driven by advancements in wearable sensor calibration, physiological signal processing, and energy harvesting techniques. These innovations enable more accurate sleep monitoring sensors, leading to improved health data analytics and wearable health monitoring. Fall detection algorithms and sensor fusion algorithms, enhanced by deep learning models, contribute to remote patient monitoring and predictive health modeling. Diagnostic accuracy metrics are on the rise, with real-time health tracking and data visualization dashboards providing personalized health insights. For instance, a leading wearable device manufacturer reported a 30% increase in sales due to the integration of machine learning algorithms for electrocardiogram interpretation.
- The market is projected to grow by over 20% annually, fueled by the integration of wireless communication protocols, user interface design, and biometric data acquisition. Patient data security, medication adherence monitoring, clinical trial integration, and personalized health insights are also key factors propelling market growth. In addition, advancements in wearable device design and wearable sensor calibration have led to the development of body temperature monitoring, mobile health applications, and health behavior modification systems. These innovations are transforming the healthcare landscape by enabling continuous, real-time health monitoring and data encryption protocols for cloud-based data storage.
What are the Key Data Covered in this Smart Wearable Healthcare Devices Market Research and Growth Report?
-
What is the expected growth of the Smart Wearable Healthcare Devices Market between 2025 and 2029?
-
USD 31.25 billion, at a CAGR of 17.1%
-
-
What segmentation does the market report cover?
-
The report is segmented by Product (Fitness band, Smart watches, Smart glasses, Fitness Trackers, Smartwatches, Wearable ECG Monitors, and Wearable Biosensors), Distribution Channel (Online and Offline), Application (Fitness and Wellness, Remote patient monitoring, Clinical healthcare, and Others), Geography (North America, Europe, Asia, and Rest of World (ROW)), and End-User (Consumers, Hospitals, Clinics, and Homecare)
-
-
Which regions are analyzed in the report?
-
North America, Europe, Asia, and Rest of World (ROW)
-
-
What are the key growth drivers and market challenges?
-
Increasing focus on patient engagement, Concerns associated with data privacy
-
-
Who are the major players in the Smart Wearable Healthcare Devices Market?
-
Alphabet Inc., Apple Inc., Biobeat Technologies Ltd., BioIntelliSense Inc., Biotricity Inc., Boston Scientific Corp., Contec Medical Systems Co. Ltd., Cyrcadia Asia Ltd., Dexcom Inc., Garmin Ltd., Huawei Technologies Co. Ltd., iRhythm Technologies Inc., Koninklijke Philips NV, Masimo Corp., Nokia Corp., OMRON Corp., Polar Electro Oy, Samsung Electronics Co. Ltd., ten3T Healthcare, and VitalConnect Inc.
-
Market Research Insights
- The market for smart wearable healthcare devices is a dynamic and ever-evolving landscape, driven by advancements in sensor technology, data transmission security, and power management systems. According to industry reports, the market is projected to grow by over 20% annually, fueled by the increasing demand for continuous health monitoring and personalized medicine approaches. For instance, a recent study showed that wearable devices led to a 30% increase in patient engagement and a 25% reduction in hospital readmissions. This growth is attributed to the integration of healthcare provider systems, telemedicine platforms, and disease risk prediction algorithms.
- Additionally, ongoing research focuses on improving sensor accuracy validation, signal processing techniques, and data quality assurance to enhance the user experience and ensure data privacy regulations are met. The development of software development kits, mobile apps, and human computer interaction designs further contribute to the market's expansion.
We can help! Our analysts can customize this smart wearable healthcare devices market research report to meet your requirements.
 RIA -
RIA - 
