Virtual Reality (VR) Market In Gaming Size 2025-2029
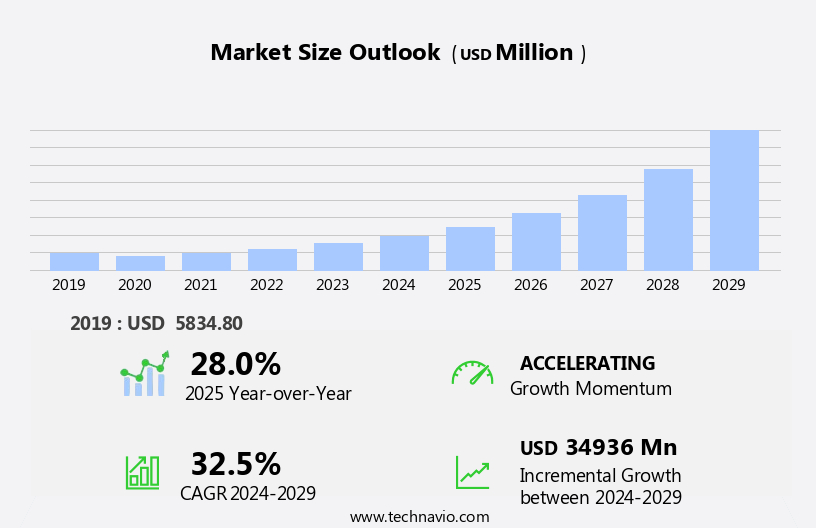
The virtual reality (vr) market in gaming size is forecast to increase by USD 34.94 billion, at a CAGR of 32.5% between 2024 and 2029.
- The Virtual Reality market in gaming is experiencing significant growth, driven by the increasing adoption of VR technology in the interactive home entertainment industry. This trend is fueled by advancements in hardware and software, enabling more immersive gaming experiences. However, the market faces challenges, most notably privacy concerns over gamers' information. As VR technology collects and processes vast amounts of user data, ensuring data security and privacy becomes a critical issue. Companies must prioritize robust data protection measures to mitigate these concerns and maintain user trust.
- The popularity of 360-degree content, which provides a more immersive gaming experience, further underscores the potential of the VR gaming market. To capitalize on this opportunity, companies must invest in developing innovative VR content and addressing privacy concerns effectively. By focusing on these areas, players in the VR gaming market can navigate challenges and seize opportunities for growth.
What will be the Size of the Virtual Reality (VR) Market In Gaming during the forecast period?
Explore in-depth regional segment analysis with market size data - historical 2019-2023 and forecasts 2025-2029 - in the full report.
Request Free Sample
The market continues to evolve, driven by advancements in technology and expanding applications across various sectors. VR therapy is revolutionizing healthcare, offering immersive experiences for patients in areas such as pain management and mental health. Market penetration is on the rise, with user interface (UI) innovations making VR more accessible to a wider audience. VR arcades and advertising platforms are transforming entertainment and marketing industries, respectively. Growth potential is significant, fueled by software development and the creation of virtual worlds. VR headsets, with their high-resolution displays and advanced haptic feedback, provide immersive experiences. Mixed reality (MR) and extended reality (XR) technologies, including game development tools and game engines, are pushing boundaries in content creation.
VR simulators offer realistic training environments for industries like aviation and military. VR retail is revolutionizing shopping experiences, while VR education is transforming classrooms. VR tourism is providing unique experiences for travelers. Market dynamics are continuously unfolding, with investment opportunities arising from the adoption rate of VR technology. Multiplayer gaming is driving social interaction in virtual worlds. Refresh rates and tracking accuracy are critical factors in delivering optimal user experiences. Despite challenges like cyber sickness, VR continues to advance, offering endless possibilities for innovation. VR training and avatar customization are just a few examples of how this technology is changing the way we live, work, and play.
How is this Virtual Reality (VR) In Gaming Industry segmented?
The virtual reality (vr) in gaming industry research report provides comprehensive data (region-wise segment analysis), with forecasts and estimates in "USD million" for the period 2025-2029, as well as historical data from 2019-2023 for the following segments.
- Application
- PCs
- Consoles
- Mobile devices
- Component
- Hardware
- Software
- Geography
- North America
- US
- Canada
- Europe
- France
- Germany
- Italy
- UK
- APAC
- China
- India
- Japan
- South Korea
- Rest of World (ROW)
- North America
By Application Insights
The pcs segment is estimated to witness significant growth during the forecast period.
The market continues to evolve, driven by advancements in technology and content creation. Haptic feedback and immersive experiences are becoming increasingly important, with game developers utilizing game engines and VR simulators to create engaging, harmonious experiences. Head-mounted displays (HMDs) with improved refresh rates and tracking accuracy are gaining popularity, as are VR social platforms for multiplayer gaming. Motion tracking and avatar customization are also key features, enabling users to interact in virtual worlds. Mixed reality (MR) and augmented reality (AR) are expanding the market, offering new opportunities for user interface (UI) design and VR advertising. VR therapy and training are also gaining traction, with VR headsets being used for education and therapeutic purposes.
The cost of entry for VR technology is decreasing, making it more accessible to consumers. The growth potential for VR in gaming is significant, with investment opportunities in software development, VR arcades, and VR retail. However, challenges such as cyber sickness and user experience (UX) remain areas of focus for developers. The adoption rate for VR is increasing, with VR tourism and immersive experiences becoming more prevalent. Extended reality (XR) is expected to revolutionize the gaming industry, offering a more harmonious blend of virtual and real worlds.
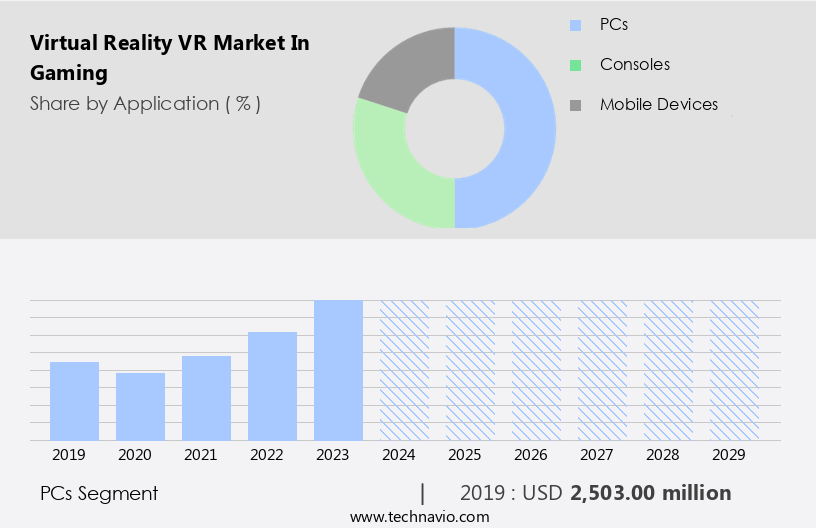
The PCs segment was valued at USD 2.5 billion in 2019 and showed a gradual increase during the forecast period.
Regional Analysis
APAC is estimated to contribute 45% to the growth of the global market during the forecast period.Technavio’s analysts have elaborately explained the regional trends and drivers that shape the market during the forecast period.
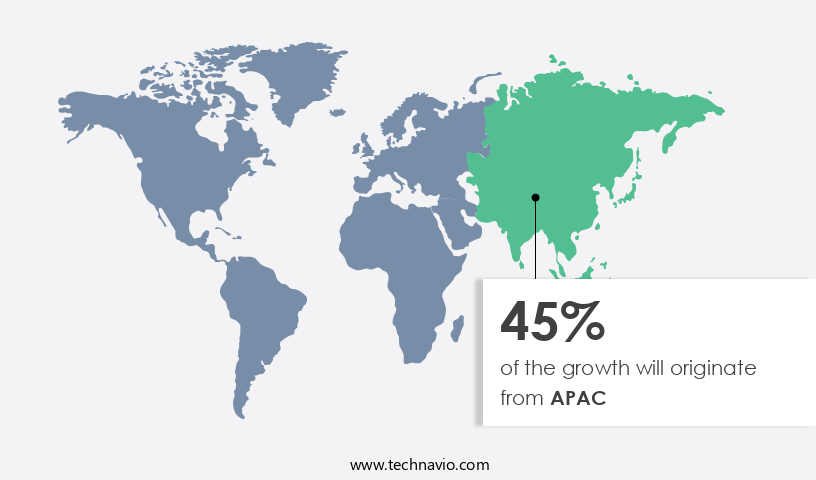
The market is experiencing significant growth, particularly in the Asia Pacific (APAC) region. Factors such as the presence of key players in game development tools, head-mounted displays (HMDs), and content creation, along with the expanding gaming industry in countries like Japan, China, and India, are driving market expansion. Investments in VR technologies for various applications, including virtual worlds, training, therapy, and advertising, are also contributing to the growth. In APAC, several VR companies are emerging, notably in China, Japan, and South Korea. Haptic feedback, mixed reality (MR), and 3D graphics are becoming increasingly important in creating immersive experiences for users.
VR social platforms and game engines are enabling multiplayer gaming and avatar customization, while VR simulators offer realistic training environments. The VR market's growth potential is further boosted by the adoption of VR in education, retail, and tourism. Market penetration is increasing as user interfaces (UI) become more intuitive, and VR arcades and VR therapy centers offer accessible entry points for consumers. Despite challenges such as cyber sickness and high cost of entry, the market's potential is immense. Extended reality (XR), including augmented reality (AR), is expected to play a significant role in the market's future. Refresh rates and tracking accuracy are crucial considerations for providing seamless user experiences.
In conclusion, the VR market in gaming is witnessing robust growth, driven by technological advancements, expanding applications, and increasing market penetration. The region with the highest growth rate during the forecast period is the Asia Pacific market, with significant contributions from countries like India, China, Japan, and South Korea.
Market Dynamics
Our researchers analyzed the data with 2024 as the base year, along with the key drivers, trends, and challenges. A holistic analysis of drivers will help companies refine their marketing strategies to gain a competitive advantage.
What are the key market drivers leading to the rise in the adoption of Virtual Reality (VR) In Gaming Industry?
- The interactive home entertainment industry's growing embrace of virtual reality (VR) technology serves as the primary market catalyst.
- The market is experiencing significant advancements, enhancing immersive experiences and user interactions. Notable developments include the integration of eye-tracking technology in head-mounted displays (HMDs), such as the Tobii Eye Tracker 5. This innovation enables more natural and intuitive user interactions, allowing control of virtual elements through gaze. Additionally, the introduction of standalone VR headsets with six degrees of freedom (6DoF) motion tracking provides users with the freedom to move physically while accurately translating movements into the virtual environment. These advancements contribute to a more convincing and interactive VR experience. Furthermore, game development tools, such as Unity and Unreal Engine, support 3D graphics and offer VR capabilities, enabling content creation for VR games.
- Mixed reality (MR) platforms and VR simulators are also gaining traction, offering unique experiences that blend real and virtual worlds. Game engines and haptic feedback technology further enhance user immersion, providing tactile sensations that synchronize with virtual actions. Overall, these developments propel the VR market in gaming forward, offering innovative and engaging experiences for users.
What are the market trends shaping the Virtual Reality (VR) In Gaming Industry?
- The growing popularity of 360-degree content signifies a significant market trend in the professional world. This immersive format offers an engaging and interactive experience for audiences, making it an essential aspect of modern content creation.
- The market has witnessed significant growth in recent years, with VR therapy, user interface (UI), and virtual worlds becoming increasingly popular. According to market research, the global VR content market is gaining traction as a mainstream platform for gaming, driven by advancements in technology and the introduction of immersive VR headsets from major tech companies. For instance, Facebook, Sony, and HTC have all launched VR devices, such as the Oculus Quest 2, PlayStation VR, and Vive Pro 2, respectively. VR arcades and VR advertising are also emerging trends in the market, offering new opportunities for software development and growth potential.
- The user experience in VR gaming is harmonious and engaging, making it a preferred choice for many gamers. The VR content market is expected to continue its growth trajectory, providing exciting opportunities for businesses and consumers alike.
What challenges does the Virtual Reality (VR) In Gaming Industry face during its growth?
- The growth of the gaming industry is significantly impacted by privacy concerns surrounding the collection and use of gamer information. It is essential for companies to address these concerns through transparent data handling practices and robust security measures to protect user data, thereby fostering trust and ensuring the industry's continued expansion.
- Virtual Reality (VR) market expansion in gaming has been hindered by the high cost of immersive hardware, which poses a significant barrier for both consumers and enterprises. The financial investment required to access a high-quality VR experience is substantial, deterring many potential users. For instance, premium VR headsets like Meta Quest 2 and HTC Vive can cost between USD399 and USD599. This expense limits the potential for market growth and adoption. Furthermore, the high cost of VR retail, including VR headsets, high-performance computers, and related peripherals, can deter individual consumers from embracing virtual reality technology. The high cost of VR hardware is also a challenge for enterprises looking to implement VR training programs or other applications, as the upfront investment can be substantial.
- Despite these challenges, the market for Virtual Reality, Extended Reality (XR), Augmented Reality (AR), avatar customization, motion tracking, VR training, and multiplayer gaming continues to evolve, driven by advancements in technology and increasing consumer interest. Cyber sickness, a potential side effect of prolonged VR use, is a concern for some users, but the industry is addressing this issue through improved hardware and software designs. The adoption rate of VR in gaming remains strong, driven by the immersive and harmonious nature of the experience.
Exclusive Customer Landscape
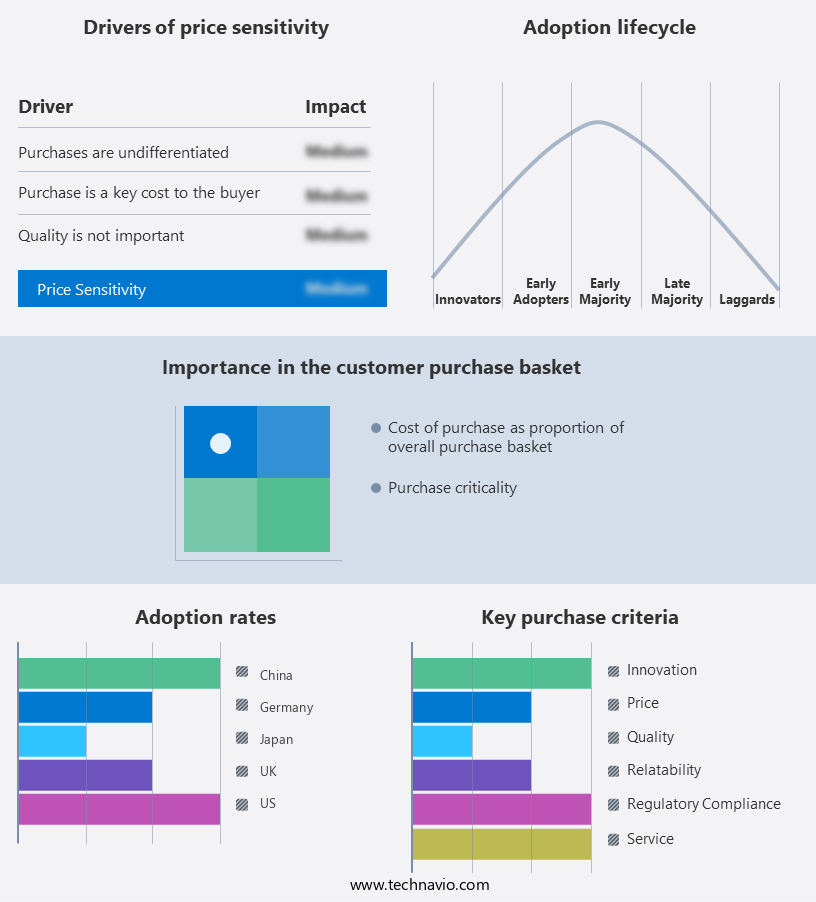
The virtual reality (vr) market in gaming forecasting report includes the adoption lifecycle of the market, covering from the innovator’s stage to the laggard’s stage. It focuses on adoption rates in different regions based on penetration. Furthermore, the virtual reality (vr) market in gaming report also includes key purchase criteria and drivers of price sensitivity to help companies evaluate and develop their market growth analysis strategies.
Customer Landscape
Key Companies & Market Insights
Companies are implementing various strategies, such as strategic alliances, virtual reality (vr) market in gaming forecast, partnerships, mergers and acquisitions, geographical expansion, and product/service launches, to enhance their presence in the industry.
Advanced Micro Devices Inc. - Virtual Reality (VR) gaming innovation, LiquidVR, showcases advanced features for immersive content delivery, enhanced comfort, and seamless compatibility. This technology pushes boundaries, providing users with a captivating and engaging experience. LiquidVR's cutting-edge capabilities elevate visual fidelity, ensuring a truly captivating environment. Comfort is prioritized through customizable settings and intuitive design, while compatibility extends across various platforms and devices. By merging technology and entertainment, LiquidVR redefines the boundaries of interactive gaming.
The industry research and growth report includes detailed analyses of the competitive landscape of the market and information about key companies, including:
- Advanced Micro Devices Inc.
- Alphabet Inc.
- bHaptics Inc.
- Carl Zeiss AG
- Electronic Arts Inc.
- Fallen Planet Studios Ltd
- HTC Corp.
- Magic Leap Inc.
- Meta Platforms Inc.
- Microsoft Corp.
- Nintendo Co. Ltd.
- NVIDIA Corp.
- Qualcomm Inc.
- Razer Inc.
- Samsung Electronics Co. Ltd.
- Sony Group Corp.
- Ubisoft Entertainment SA
- Unity Technologies Inc.
- Virtuix Inc.
- Wookey Technologies Inc.
Qualitative and quantitative analysis of companies has been conducted to help clients understand the wider business environment as well as the strengths and weaknesses of key industry players. Data is qualitatively analyzed to categorize companies as pure play, category-focused, industry-focused, and diversified; it is quantitatively analyzed to categorize companies as dominant, leading, strong, tentative, and weak.
Recent Development and News in Virtual Reality (VR) Market In Gaming
- In February 2023, Facebook, now Meta Platforms Inc., announced the launch of Project Cambria, a high-end standalone VR headset designed for the gaming industry. This new device is expected to offer advanced features such as hand and facial tracking, eye-tracking, and high-resolution displays (Meta Platforms Inc., 2023).
- In March 2023, Sony Interactive Entertainment and Microsoft Gaming collaborated to bring Sony's PlayStation VR games to Microsoft's Xbox Cloud Gaming platform. This strategic partnership enables gamers to access a vast library of PlayStation VR titles on various devices, expanding the reach of VR gaming (Sony Interactive Entertainment, 2023).
- In May 2024, HTC Vive raised USD100 million in a Series F funding round, led by investment firms Sequoia Capital China and Morningside Venture Capital. The funds will be used to accelerate the development and expansion of VR content and services (HTC, 2024).
- In October 2024, Valve Corporation, the gaming giant, released SteamVR 2.0, a significant update to its virtual reality platform. The new version includes features like wireless VR headset support, improved performance, and a more user-friendly interface, enhancing the overall VR gaming experience (Valve Corporation, 2024).
Research Analyst Overview
- The market has experienced significant growth, driven by advancements in hardware technology from key players like HTC Vive and PlayStation VR. VR consultants forecast continued expansion, with AI and machine learning (ML) enabling more immersive experiences. VR hardware manufacturers invest in R&D, integrating biometric authentication, voice recognition, and computer vision to enhance user experience. VR development studios collaborate with VR venture capitalists to fund innovative projects, while VR content distribution platforms and VR analytics firms facilitate efficient marketing strategies. VR advertising platforms capitalize on this trend, offering new opportunities for brands. VR software developers utilize Unreal Engine and other tools to create engaging content.
- VR conferencing and social vr platforms foster remote collaboration and interaction. Valve Index and Oculus Quest represent the latest in VR hardware, pushing the boundaries of immersion and interactivity. The VR ecosystem continues to evolve, with VR research and VR streaming shaping the future of this dynamic industry.
Dive into Technavio’s robust research methodology, blending expert interviews, extensive data synthesis, and validated models for unparalleled Virtual Reality (VR) Market In Gaming insights. See full methodology.
|
Market Scope |
|
|
Report Coverage |
Details |
|
Page number |
204 |
|
Base year |
2024 |
|
Historic period |
2019-2023 |
|
Forecast period |
2025-2029 |
|
Growth momentum & CAGR |
Accelerate at a CAGR of 32.5% |
|
Market growth 2025-2029 |
USD 34936 million |
|
Market structure |
Fragmented |
|
YoY growth 2024-2025(%) |
28.0 |
|
Key countries |
US, China, Canada, Japan, Germany, UK, India, South Korea, France, and Italy |
|
Competitive landscape |
Leading Companies, Market Positioning of Companies, Competitive Strategies, and Industry Risks |
What are the Key Data Covered in this Virtual Reality (VR) Market In Gaming Research and Growth Report?
- CAGR of the Virtual Reality (VR) In Gaming industry during the forecast period
- Detailed information on factors that will drive the growth and forecasting between 2025 and 2029
- Precise estimation of the size of the market and its contribution of the industry in focus to the parent market
- Accurate predictions about upcoming growth and trends and changes in consumer behaviour
- Growth of the market across APAC, North America, Europe, Middle East and Africa, and South America
- Thorough analysis of the market’s competitive landscape and detailed information about companies
- Comprehensive analysis of factors that will challenge the virtual reality (vr) market in gaming growth of industry companies
We can help! Our analysts can customize this virtual reality (vr) market in gaming research report to meet your requirements.
 RIA -
RIA - 
