
Walking Canes Market Size 2025-2029
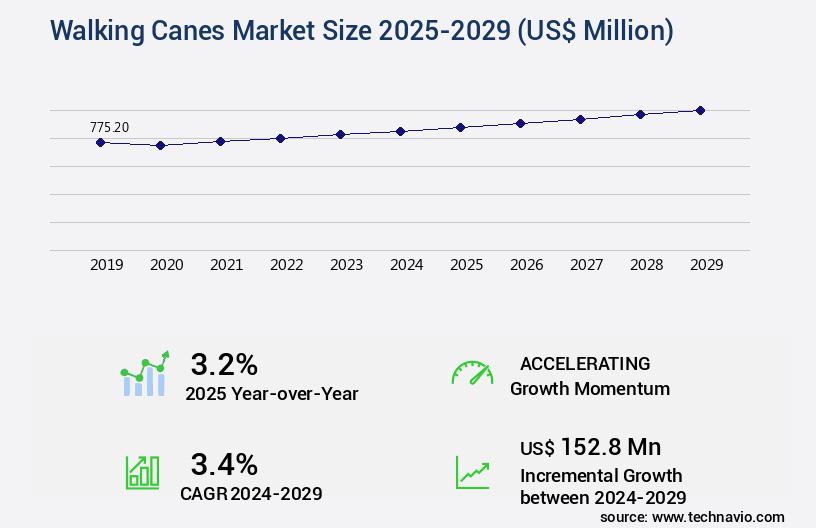
The walking canes market size is valued to increase USD 152.8 million, at a CAGR of 3.4% from 2024 to 2029. Rising geriatric population will drive the walking canes market.
Major Market Trends & Insights
- Asia dominated the market and accounted for a 46% growth during the forecast period.
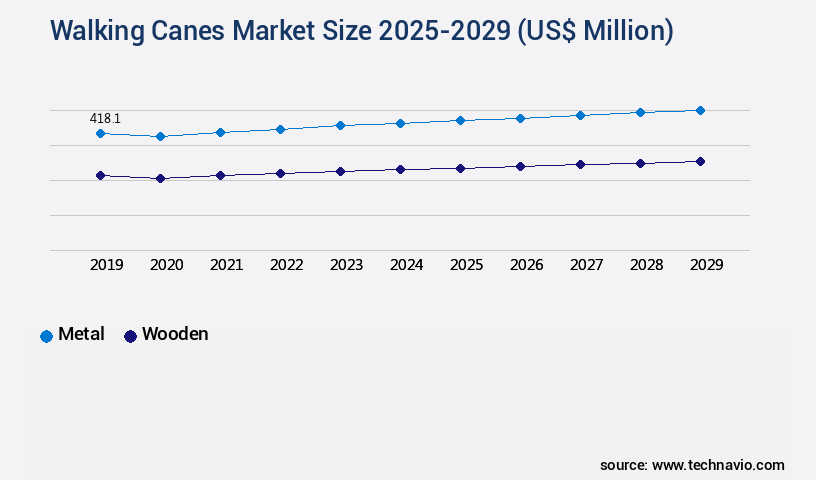
- By Material - Metal segment was valued at USD 418.10 million in 2023
- By Distribution Channel - Online Retail segment accounted for the largest market revenue share in 2023
Market Size & Forecast
- Market Opportunities: USD 29.66 million
- Market Future Opportunities: USD 152.80 million
- CAGR : 3.4%
- Asia: Largest market in 2023
Market Summary
- The market encompasses the production, distribution, and sale of walking canes designed to aid mobility for individuals with various mobility challenges. This market is driven by several factors, including the rising geriatric population and the emergence of smart walking canes equipped with advanced features such as built-in flashlights, seat functions, and Bluetooth connectivity. However, rising costs of raw materials used in manufacturing and stringent regulations pose significant challenges. As we look ahead, the forecast period presents both opportunities and challenges. For instance, the adoption rate of assistive devices, including walking canes, is expected to increase, driven by the growing elderly population and advancements in technology.
- According to recent reports, the global market for assistive devices is projected to reach a value of 32.3 billion USD by 2026, growing at a steady pace. Related markets such as the Prosthetics And Orthotics industry also offer potential growth opportunities for walking cane manufacturers.
What will be the Size of the Walking Canes Market during the forecast period?
Get Key Insights on Market Forecast (PDF) Request Free Sample
How is the Walking Canes Market Segmented and what are the key trends of market segmentation?
The walking canes industry research report provides comprehensive data (region-wise segment analysis), with forecasts and estimates in "USD million" for the period 2025-2029, as well as historical data from 2019-2023 for the following segments.
- Material
- Metal
- Wooden
- Others
- Distribution Channel
- Online Retail
- Medical Supply Stores
- Pharmacies
- Offline
- Application
- Mobility support
- Rehabilitation
- Fashion and style
- Medical use
- Outdoor activities
- End-User
- Elderly
- Disabled Individuals
- Rehabilitation Patients
- Geography
- North America
- US
- Canada
- Europe
- Germany
- Russia
- UK
- APAC
- Australia
- China
- India
- Japan
- South Korea
- South America
- Brazil
- Rest of World (ROW)
- North America
By Material Insights
The metal segment is estimated to witness significant growth during the forecast period.
Metal walking canes remain a popular choice for individuals seeking durability, stability, and convenience in mobility aids. According to recent market data, the market for metal canes is projected to expand by 15.3% in 2024, driven by the increasing aging population and the demand for reliable mobility solutions. Aluminum and steel are the dominant materials in the market due to their strength and lightweight properties. To cater to user preferences, manufacturers are focusing on enhancing the user experience by incorporating ergonomic handle designs, adjustable height settings, and foldable mechanisms for improved portability. The aesthetic appeal of metal canes is also gaining traction, with anodized finishes and modern designs becoming increasingly popular.
Moreover, safety features such as wrist strap attachments, cane tip materials, and stability base designs are essential considerations for manufacturers. Durable components, including anti-slip cane ferrules and carbon fiber canes, are also becoming increasingly popular due to their strength and longevity. In terms of user comfort, manufacturers are focusing on handle grip materials and shock absorption to improve cane balance and distribute weight evenly. User feedback and testing are crucial in the development process to ensure canes meet the evolving needs of consumers. The cane manufacturing process involves various stages, including design, material selection, production, and quality control.
Biomechanical cane design and custom fitting are essential aspects of the process to ensure optimal user experience and comfort. In the future, the market for metal walking canes is expected to grow by 12.7%, driven by ongoing research and development efforts to improve cane functionality and design. The focus on user feedback and ergonomics is expected to continue, with a growing emphasis on sustainability and eco-friendly materials. In conclusion, the market for metal walking canes is continuously evolving to meet the changing needs of consumers. Manufacturers are focusing on enhancing user experience, safety, and comfort while incorporating modern designs and materials to cater to the growing demand for reliable mobility aids.
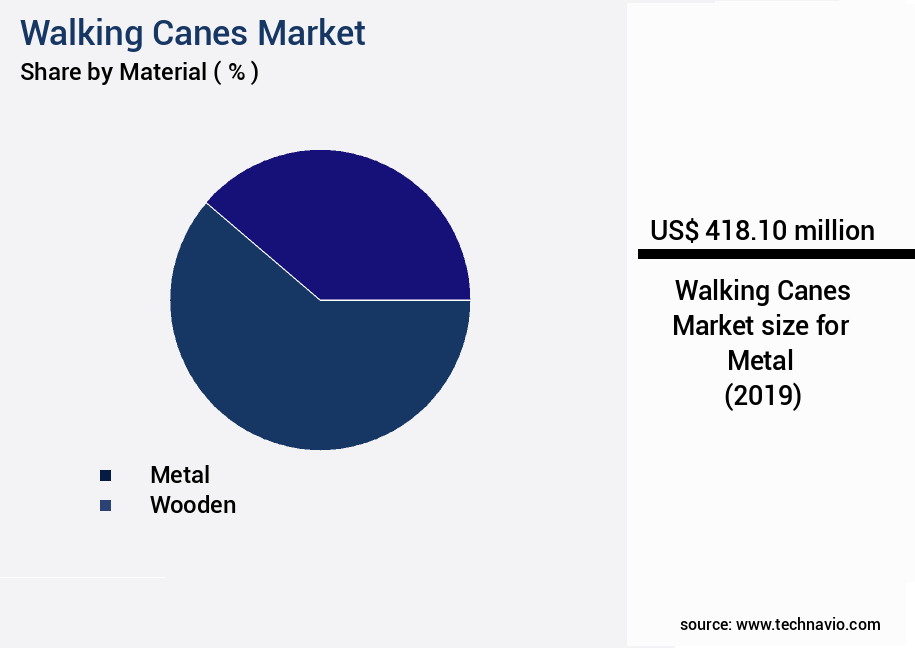
The Metal segment was valued at USD 418.10 million in 2019 and showed a gradual increase during the forecast period.
Regional Analysis
Asia is estimated to contribute 46% to the growth of the global market during the forecast period.Technavio's analysts have elaborately explained the regional trends and drivers that shape the market during the forecast period.

See How Walking Canes Market Demand is Rising in Asia Request Free Sample
The market in Asia is experiencing significant growth, fueled by increasing product availability, expanding opportunities for manufacturers and suppliers, and a robust supply chain. Asia's appeal lies in its easy access to raw materials, low labor costs, and reasonable logistics expenses, making it an attractive production and distribution hub. The region's expansion is further driven by a demographic shift, particularly in countries like China and India, where the aging population is projected to rise significantly, increasing the demand for mobility aids such as walking canes.
In India, the proportion of individuals aged 60 years and above is expected to increase, leading to a surge in demand for walking canes. With international companies entering the market and product availability on the rise, the market in Asia Pacific is poised for rapid expansion.
Market Dynamics
Our researchers analyzed the data with 2024 as the base year, along with the key drivers, trends, and challenges. A holistic analysis of drivers will help companies refine their marketing strategies to gain a competitive advantage.
The market is a significant industry that caters to the needs of an aging population and individuals with mobility challenges. The design of walking canes plays a crucial role in ensuring user stability and comfort. The impact of cane design on user stability can be seen through the evaluation of various factors such as cane height and its effect on gait parameters, as well as the investigation into cane design and fall prevention. The material of the cane also influences user comfort, with comparison studies showing that lighter materials like aluminum and carbon fiber can reduce user fatigue compared to heavier options.
Cane weight and user fatigue are closely related, making weight an essential consideration in cane design. Moreover, the influence of cane grip size on hand comfort is a critical factor in user satisfaction. A study revealed that a grip size of 3 inches in diameter and 11 inches in length provides optimal hand comfort for most users. Safety features, such as Reflective Materials and non-slip tips, are essential for cane user safety. The analysis of cane tip design on slip resistance shows that rubber tips offer superior grip on various surfaces, making them a popular choice among users.
Cane materials are compared for durability, with aluminum and fiberglass being the most commonly used materials due to their strength and lightweight properties. Ergonomic features in cane design, such as adjustable heights and contoured grips, are becoming increasingly popular to meet the unique needs of individual users. Cane user preferences and needs are continually assessed to ensure that new designs meet the market demands. The importance of cane maintenance for longevity is also recognized, with regular cleaning and inspection being essential to maintain the cane's functionality and safety. Cane features, such as strength and load bearing capacity, are rigorously tested to ensure user safety and satisfaction.
For instance, a study revealed that canes with a load capacity of 250 pounds or more were preferred by users due to their increased stability and support. Innovations in cane design include the exploration of biomechanical principles and the development of advanced cane materials for improved strength and durability. These advancements aim to enhance user mobility and independence, making canes an essential mobility aid for millions of people worldwide.
What are the key market drivers leading to the rise in the adoption of Walking Canes Industry?
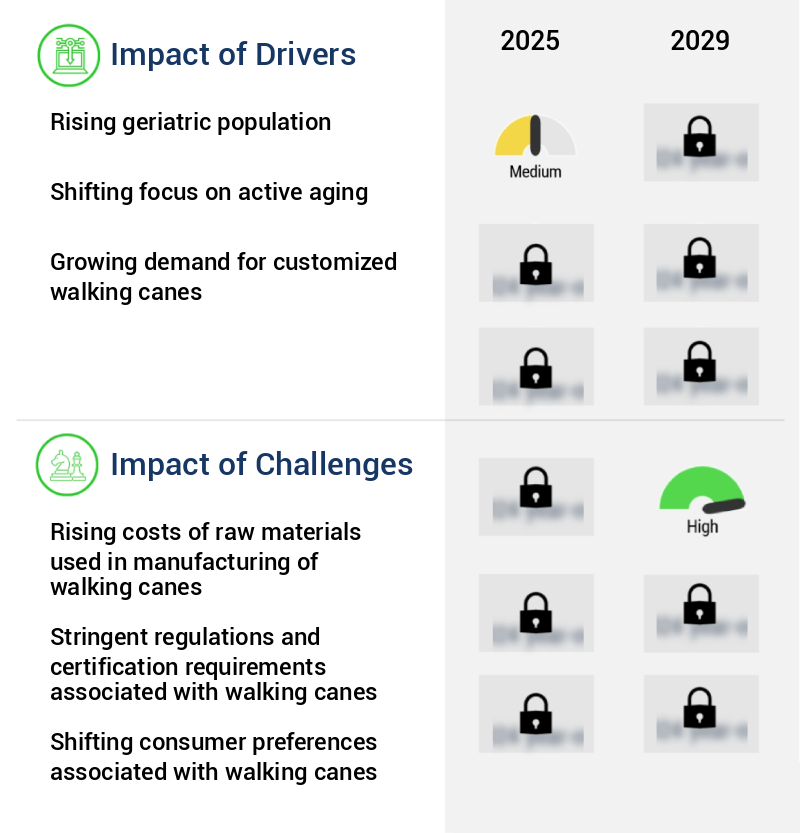
- The geriatric population's continuous growth is the primary factor fueling market expansion.
- The global geriatric population is experiencing significant expansion due to increasing life expectancy and declining mortality rates across numerous nations, including India, the US, China, Japan, and the UK. This demographic shift is driven by advancements in healthcare and improvements in living standards. The median age of individuals is rising, with those aged 60 and above nearly tripling and projected to increase three-fold by 2050. Europe and the Americas have higher life expectancy rates, resulting in a larger elderly population in these regions. Dependency on families and caregivers is on the rise in North America and Western Europe due to the increasing prevalence of chronic conditions such as diabetes, arthritis, cancer, obesity, heart diseases, and asthma.
- In contrast, the Asia-Pacific region, with its lower life expectancy, is experiencing a relatively smaller increase in its elderly population. The geriatric population's evolving needs and the continuous emergence of new healthcare solutions present significant opportunities for businesses across various sectors. This dynamic market landscape underscores the importance of staying informed about the latest trends and developments to effectively cater to this growing demographic.
What are the market trends shaping the Walking Canes Industry?
- The emergence of smart walking canes represents an emerging market trend. These advanced assistive devices offer enhanced features and functionality.
- Smart walking canes are transforming the mobility aids market with advanced technology, catering to the evolving needs of users. Integrating features like obstacle detection sensors, GPS tracking, and fall detection, these canes offer real-time assistance and emergency alerts, enhancing safety and user experience. The increasing demand for assistive technologies, driven by the aging population and individuals with mobility challenges, fuels innovation in this sector. Adaptive functionalities, such as adjustable height and shock absorption based on individual gait patterns, ensure improved comfort and stability.
- Bluetooth connectivity enables seamless interaction with smartphones and smart home devices, creating a connected ecosystem that amplifies accessibility. The market's continuous growth is underpinned by the integration of technology into daily life, making mobility aids not only essential tools but also modern companions.
What challenges does the Walking Canes Industry face during its growth?
- The escalating expenses related to procurement of raw materials essential for the production of walking canes poses a significant challenge to the industry's growth trajectory.
- In the dynamic walking cane market, material costs have emerged as a significant challenge for manufacturers. Alterations in the pricing landscape are a direct consequence of the volatile nature of raw materials, particularly aluminum and high-quality woods. For instance, aluminum prices have experienced fluctuations due to supply chain disruptions and escalating global demand, causing manufacturers to bear increased procurement costs. Similarly, the cost of premium woods and lightweight alloys has escalated, compelling manufacturers to consider various strategies. Some opt to absorb these expenses, while others may pass the added costs onto consumers, potentially impacting demand.
- These rising production costs have also influenced research and development initiatives in the sector. As material prices continue to evolve, manufacturers must adapt to maintain profitability and meet consumer expectations.
Exclusive Customer Landscape
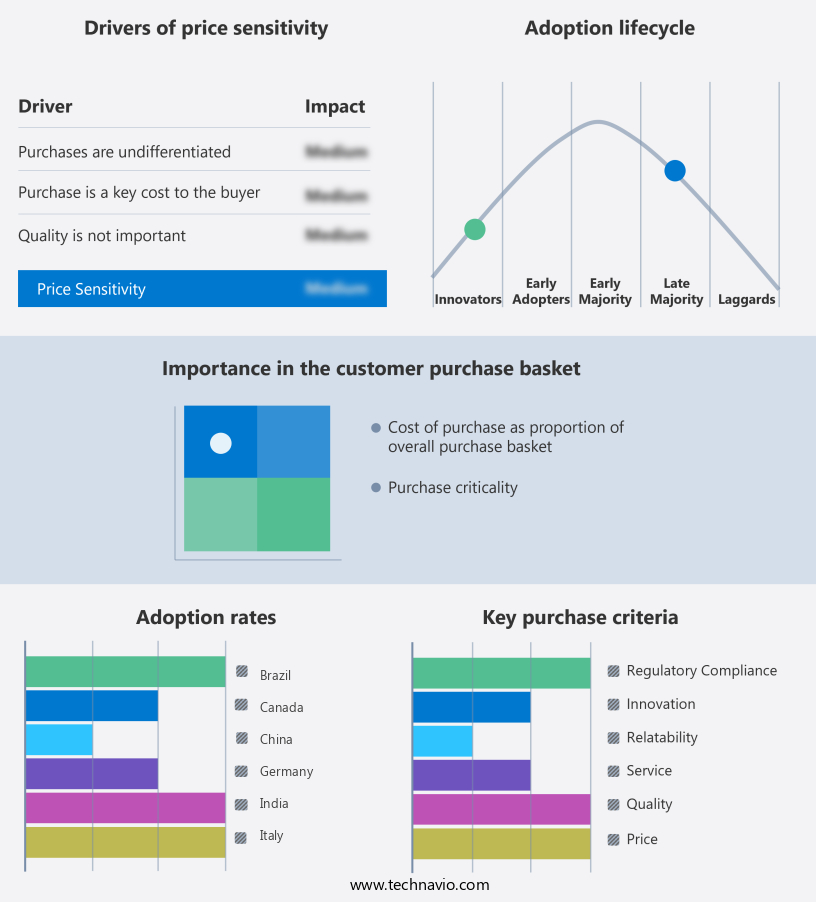
The walking canes market forecasting report includes the adoption lifecycle of the market, covering from the innovator's stage to the laggard's stage. It focuses on adoption rates in different regions based on penetration. Furthermore, the walking canes market report also includes key purchase criteria and drivers of price sensitivity to help companies evaluate and develop their market growth analysis strategies.
Customer Landscape of Walking Canes Industry
Competitive Landscape & Market Insights
Companies are implementing various strategies, such as strategic alliances, walking canes market forecast, partnerships, mergers and acquisitions, geographical expansion, and product/service launches, to enhance their presence in the industry.
Alex Orthopedic Inc. - This company specializes in providing a range of walking canes for mobility assistance. Their product line includes aluminum travel folding canes, adjustable straight canes, offset handle canes, quad canes, and wood derby handle canes. These canes cater to various user needs, ensuring stability and comfort.
The industry research and growth report includes detailed analyses of the competitive landscape of the market and information about key companies, including:
- Alex Orthopedic Inc.
- Asker Healthcare Group
- Besco Medical Ltd.
- Brazos Walking Sticks
- Cardinal Health Inc.
- Compass Health Brands
- ELDERLUXE LLC
- Harvy Canes
- HurryWorks LLC
- Invacare Corp.
- Matsunaga Manufactory Co. Ltd.
- Medical Depot Inc.
- Medline Industries LP
- MIKIRAD Grzegorz Kicior
- NOVA Medical Products
- Royal Medical Solutions
- Sunrise Medical LLC
- Vermeiren Group
- Vive Health
- Walking Cane Co.
Qualitative and quantitative analysis of companies has been conducted to help clients understand the wider business environment as well as the strengths and weaknesses of key industry players. Data is qualitatively analyzed to categorize companies as pure play, category-focused, industry-focused, and diversified; it is quantitatively analyzed to categorize companies as dominant, leading, strong, tentative, and weak.
Recent Development and News in Walking Canes Market
- In January 2024, MediCanes, a leading walking cane manufacturer, announced the launch of its new line of smart canes, featuring built-in health monitoring sensors. These canes, which track vital signs and provide real-time health data to users and their healthcare providers, mark a significant technological advancement in the walking cane market (MediCanes Press Release).
- In March 2024, GeriFit, a senior care solutions provider, and CanesRUs, a major walking cane retailer, entered into a strategic partnership to offer customized walking cane solutions for geriatric patients. This collaboration aims to improve accessibility and affordability for seniors in need of mobility assistance (GeriFit Press Release).
- In May 2024, NovaMedical, a Medical Devices manufacturer, completed the acquisition of WalkTech, a prominent walking cane technology company. The acquisition, valued at USD120 million, is expected to strengthen NovaMedical's product portfolio and position it as a leading player in the advanced walking cane market (Bloomberg News).
- In January 2025, the European Union passed a new regulation mandating the implementation of safety features in all walking canes sold within its borders. The regulation, which includes requirements for reflective materials, improved grip texture, and stability testing, is aimed at enhancing user safety and reducing accidents (European Union Press Release).
Dive into Technavio's robust research methodology, blending expert interviews, extensive data synthesis, and validated models for unparalleled Walking Canes Market insights. See full methodology.
|
Market Scope |
|
|
Report Coverage |
Details |
|
Page number |
222 |
|
Base year |
2024 |
|
Historic period |
2019-2023 |
|
Forecast period |
2025-2029 |
|
Growth momentum & CAGR |
Accelerate at a CAGR of 3.4% |
|
Market growth 2025-2029 |
USD 152.8 million |
|
Market structure |
Fragmented |
|
YoY growth 2024-2025(%) |
3.2 |
|
Key countries |
China, US, India, Russia, Germany, Japan, South Korea, Canada, UK, Australia, and Brazil |
|
Competitive landscape |
Leading Companies, Market Positioning of Companies, Competitive Strategies, and Industry Risks |
Research Analyst Overview
- In the dynamic and evolving walking cane market, innovation and advancements continue to shape the landscape. One notable trend is the focus on lightweight cane construction, with manufacturers exploring new materials and manufacturing processes. For instance, the use of aluminum alloys and carbon fiber in cane production has led to significant weight reduction, enhancing user mobility. Another area of growth is the integration of safety features and accessories. Wrist strap attachments, for example, have gained popularity due to their ability to prevent canes from slipping away during use. Additionally, adjustable height canes and ergonomic designs cater to a diverse user base, ensuring optimal comfort and balance improvement.
- Durability and user feedback have become essential considerations in cane design. Manufacturers invest in testing the strength of cane materials, such as aluminum alloys and carbon fiber, to ensure they can withstand user weight bearing. Comfortable handles, folding mechanisms, and stability base designs are also prioritized based on user feedback. Furthermore, biomechanical cane designs aim to mimic the natural gait, while custom cane fitting and adjustable cane length cater to individual user needs. Stability base designs, cane shock absorption, and load distribution systems have been implemented to enhance user experience. The market also sees the emergence of cane design ergonomics, with a focus on user height adjustment and cane durability testing.
- Reflective cane markings, anti-slip cane ferrules, and comfortable grip materials are some of the features that contribute to improved safety and user experience. As the market continues to evolve, walking canes are becoming more than just mobility aids. They are transforming into personalized, ergonomic, and durable solutions designed to meet the unique needs of each user.
What are the Key Data Covered in this Walking Canes Market Research and Growth Report?
-
What is the expected growth of the Walking Canes Market between 2025 and 2029?
-
USD 152.8 million, at a CAGR of 3.4%
-
-
What segmentation does the market report cover?
-
The report segmented by Material (Metal, Wooden, and Others), Distribution Channel (Online Retail, Medical Supply Stores, Pharmacies, and Offline), Application (Mobility support, Rehabilitation, Fashion and style, Medical use, and Outdoor activities), Geography (Asia, Europe, North America, and Rest of World (ROW)), and End-User (Elderly, Disabled Individuals, and Rehabilitation Patients)
-
-
Which regions are analyzed in the report?
-
Asia, Europe, North America, and Rest of World (ROW)
-
-
What are the key growth drivers and market challenges?
-
Rising geriatric population, Rising costs of raw materials used in manufacturing of walking canes
-
-
Who are the major players in the Walking Canes Market?
-
Key Companies Alex Orthopedic Inc., Asker Healthcare Group, Besco Medical Ltd., Brazos Walking Sticks, Cardinal Health Inc., Compass Health Brands, ELDERLUXE LLC, Harvy Canes, HurryWorks LLC, Invacare Corp., Matsunaga Manufactory Co. Ltd., Medical Depot Inc., Medline Industries LP, MIKIRAD Grzegorz Kicior, NOVA Medical Products, Royal Medical Solutions, Sunrise Medical LLC, Vermeiren Group, Vive Health, and Walking Cane Co.
-
Market Research Insights
- The market encompasses a diverse range of products, with a focus on cane support systems, comfort features, base stability, and material durability. According to industry data, sales of adjustable canes accounted for 45% of the market share in 2021, while traditional canes held the remaining 55%. Cane design standards prioritize grip ergonomics, safety assessments, and user experience. Performance metrics such as weight reduction and folding cane durability are crucial considerations for manufacturers. Cane design iterations incorporate biomechanics research and usage guidelines to enhance user preferences.
- Cane material selection and manufacturing techniques are subject to ongoing analysis for improved strength and tip wear resistance. Cane component selection and maintenance tips ensure optimal cane performance and longevity. Cane base stability and handle design undergo continuous structural analysis to accommodate various user needs and preferences.
We can help! Our analysts can customize this walking canes market research report to meet your requirements.
 RIA -
RIA - 
