
Wallcovering Market Size 2026-2030
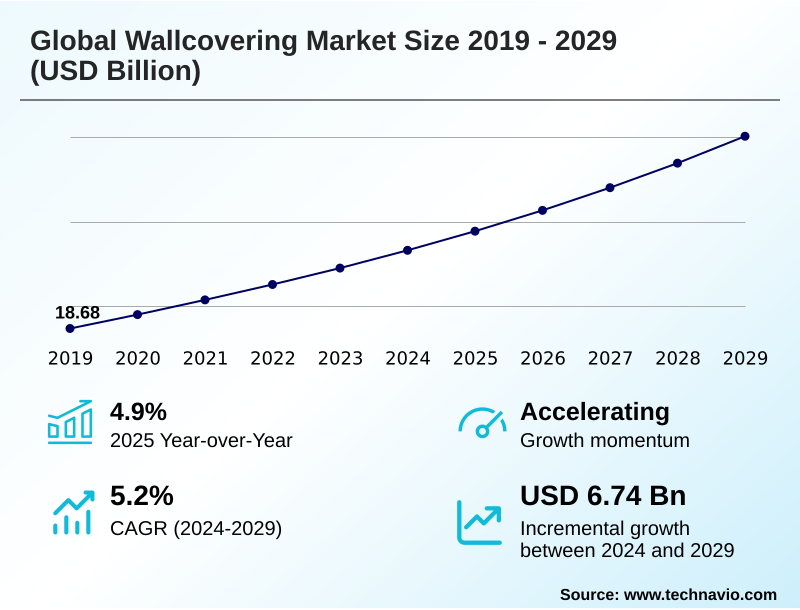
The wallcovering market size is valued to increase by USD 7.36 billion, at a CAGR of 5.4% from 2025 to 2030. Rising demand for premium interior aesthetics will drive the wallcovering market.
Major Market Trends & Insights
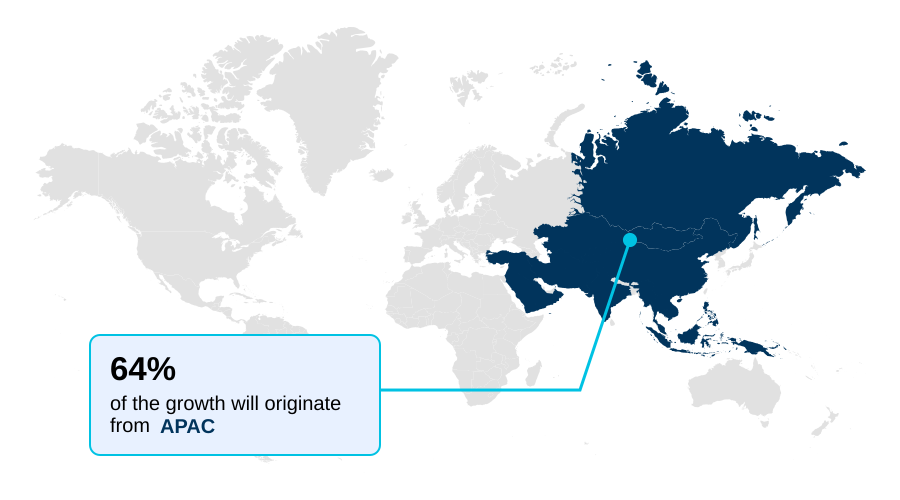
- APAC dominated the market and accounted for a 64.1% growth during the forecast period.
- By Type - Wall panel segment was valued at USD 10.25 billion in 2024
- By End-user - Residential segment accounted for the largest market revenue share in 2024
Market Size & Forecast
- Market Opportunities: USD 12.29 billion
- Market Future Opportunities: USD 7.36 billion
- CAGR from 2025 to 2030 : 5.4%
Market Summary
- The wallcovering market is undergoing a significant transformation, moving beyond traditional decorative roles to become an integral component of functional interior design. This evolution is propelled by advancements in digital printing technology, which facilitates unprecedented customization and allows for the creation of bespoke wallpaper designs and large-scale murals on demand.
- A primary driver is the growing consumer and commercial demand for premium interior aesthetics, with a pronounced shift toward sustainable biomaterials and textured surface designs that add depth and character to spaces.
- For instance, a global hospitality chain might implement wallcoverings with integrated antimicrobial layers and superior fire retardancy to comply with stringent health and safety regulations while reinforcing its brand identity through unique, custom-designed murals. However, the industry grapples with challenges such as volatile raw material prices for non-woven substrates and vinyl, which can disrupt supply chains and impact production costs.
- The increasing popularity of high-performance materials offering acoustic insulation and air-purifying capabilities underscores the market’s trajectory toward creating healthier, more responsive, and aesthetically sophisticated environments in both residential and commercial sectors.
What will be the Size of the Wallcovering Market during the forecast period?
Get Key Insights on Market Forecast (PDF) Get Free Sample
How is the Wallcovering Market Segmented?
The wallcovering industry research report provides comprehensive data (region-wise segment analysis), with forecasts and estimates in "USD million" for the period 2026-2030, as well as historical data from 2020-2024 for the following segments.
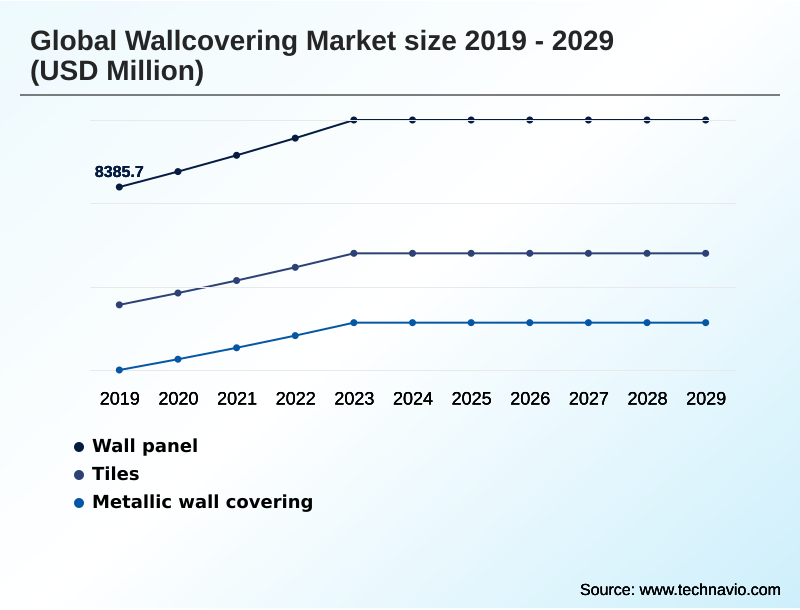
- Type
- Wall panel
- Tiles
- Metallic wall covering
- End-user
- Residential
- Commercial
- Material
- Vinyl
- Fabric
- Paper-based
- Wood-based
- Geography
- APAC
- China
- Japan
- India
- North America
- US
- Canada
- Mexico
- Europe
- Germany
- UK
- France
- Middle East and Africa
- Saudi Arabia
- UAE
- South Africa
- South America
- Brazil
- Argentina
- Colombia
- Rest of World (ROW)
- APAC
By Type Insights
The wall panel segment is estimated to witness significant growth during the forecast period.
The wall panel segment is evolving beyond basic aesthetics, driven by demand for functional utility in modern construction.
Prefabricated wall panel systems are gaining traction in commercial interiors, as they can reduce installation times by over 30% compared to traditional on-site methods. These systems increasingly incorporate high-performance materials that provide superior acoustic insulation and fire retardancy.
The trend towards modular building and rapid renovations favors solutions offering both design flexibility and operational efficiency. In residential interiors, 3d wall panels and natural textured wallcoverings are popular for creating dynamic architectural features.
This shift reflects a broader market movement toward integrated, value-added surfaces that offer more than just decoration, including customizable design solutions for specific environmental needs.
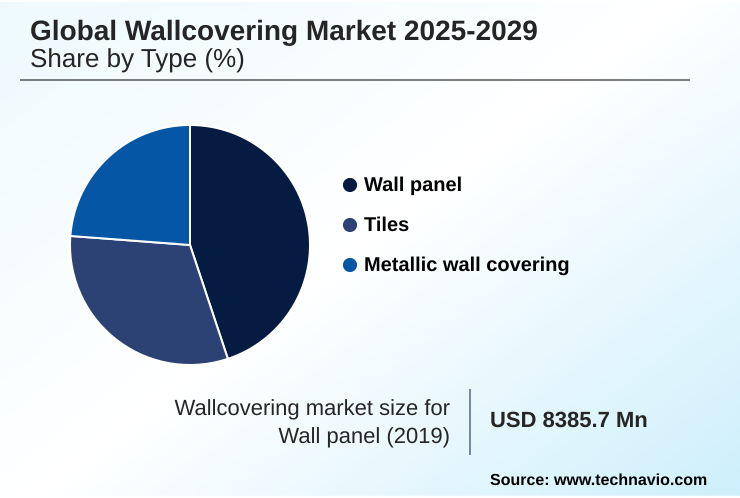
The Wall panel segment was valued at USD 10.25 billion in 2024 and showed a gradual increase during the forecast period.
Regional Analysis
APAC is estimated to contribute 64.1% to the growth of the global market during the forecast period.Technavio’s analysts have elaborately explained the regional trends and drivers that shape the market during the forecast period.
See How Wallcovering Market Demand is Rising in APAC Get Free Sample
The geographic landscape is dominated by the APAC region, which accounts for over 60% of the market's incremental growth, fueled by rapid urbanization and infrastructure development in countries like China and India.
In this region, the adoption of prefabricated wall panel systems is accelerating project timelines, with some developers reporting a reduction in installation schedules by more than 20% compared to conventional methods.
North America and Europe demonstrate mature demand, with a strong focus on renovation and high-end residential interiors. These regions show a higher adoption rate for products featuring eco-friendly coatings and sustainable biomaterials.
The Middle East and Africa represent a growing market for luxury interior design, with significant investment in hospitality and premium commercial projects that demand bespoke and high-performance wallcovering solutions.
Market Dynamics
Our researchers analyzed the data with 2025 as the base year, along with the key drivers, trends, and challenges. A holistic analysis of drivers will help companies refine their marketing strategies to gain a competitive advantage.
- The modern wallcovering industry is being reshaped by several interconnected factors, fundamentally altering both product development and consumer expectations. The impact of digital printing on wallcovering design has been transformative, democratizing customization and allowing for intricate, on-demand patterns that were previously unachievable at scale.
- This technological shift directly supports the rising popularity of temporary decor, highlighting the benefits of peel and stick wallpaper for renters and DIY enthusiasts who seek design flexibility without long-term commitment.
- Parallel to this, there is a strong push toward environmental responsibility, underscoring the role of sustainable materials in modern wallcoverings, with consumers and specifiers increasingly demanding products made from recycled content and renewable resources. Functionality has also become a critical consideration. The acoustic properties of textile wallcoverings in offices are now a key specification for creating productive, low-noise environments.
- Similarly, material science addresses practical needs, leading to specific guidance on choosing vinyl wallcovering for high-moisture areas to ensure longevity and hygiene. Underpinning these advancements are the continuous improvements in core material technology, as advancements in non-woven wallpaper substrates have enhanced durability and simplified installation, reducing application errors by a noticeable margin compared to older paper-based alternatives.
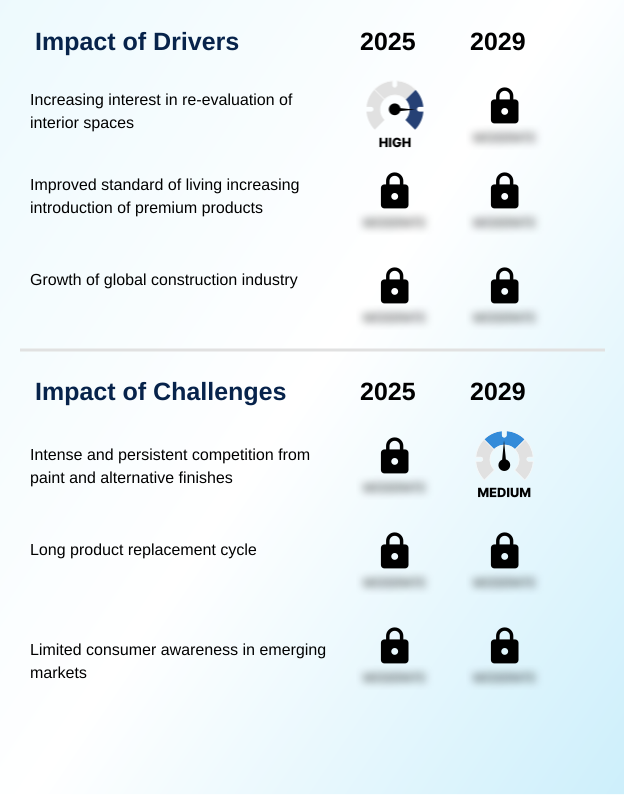
What are the key market drivers leading to the rise in the adoption of Wallcovering Industry?
- The rising demand for premium interior aesthetics serves as a key driver for the growth of the wallcovering market.
- Market growth is primarily driven by the convergence of aesthetic ambition and technological enablement across both residential and commercial sectors.
- The persistent demand for premium interior aesthetics is amplified by advancements in digital printing technology, which empowers the creation of bespoke wallpaper designs with project turnaround times reduced by as much as 60% compared to traditional printing methods.
- Expansion in the hospitality and corporate sectors is another key driver, as the specification of durable commercial vinyl wallcoverings can extend renovation cycles by two to three years, offering significant long-term operational savings.
- This is particularly true for high-traffic areas, where the resilience of heavy-duty type ii vinyl and other high-performance materials ensures longevity and sustains a high-quality appearance, supporting luxury interior design objectives.
What are the market trends shaping the Wallcovering Industry?
- A significant upcoming market trend is the surge in demand for peel-and-stick wallcoverings, driven by a consumer shift toward convenient and design-flexible interior solutions.
- Key market trends are centered on sustainability and user accessibility, driving significant shifts in product development and consumer behavior. The demand for peel-and-stick wallcoverings and other removable wallpaper options has surged, with select online retailers reporting a sales increase of over 50% for these diy home upgrades.
- This trend is complemented by the growing popularity of writable surfaces for collaborative spaces. Concurrently, there is a strong movement toward sustainable choices, where products featuring pvc-free materials and low-voc options are seeing a 15% higher preference rating in consumer surveys.
- Aesthetic trends are also evolving, with a focus on creating multi-sensory environments through the use of textured surface designs and custom-designed murals, reflecting a sophisticated approach to modern architectural interior finishes.
What challenges does the Wallcovering Industry face during its growth?
- The fluctuating prices of raw materials on a global scale present a significant challenge affecting the industry's growth.
- The primary challenge confronting the wallcovering market is the significant volatility in raw material pricing, which can erode profit margins by 5-10% within a single fiscal quarter. Fluctuations in the cost of inputs such as non-woven substrates and the chemicals for eco-friendly coatings create considerable planning uncertainty for manufacturers.
- Furthermore, persistent global supply chain disruptions have extended procurement lead times for specialized recycled fibers and bio-based polymers by up to eight weeks in some cases. This directly impacts project timelines for both large-scale commercial interiors and smaller residential interiors, creating a ripple effect that affects contractors and end-users.
- These issues are compounded by intense competition from alternative finishes and the technical limitations of certain materials.
Exclusive Technavio Analysis on Customer Landscape
The wallcovering market forecasting report includes the adoption lifecycle of the market, covering from the innovator’s stage to the laggard’s stage. It focuses on adoption rates in different regions based on penetration. Furthermore, the wallcovering market report also includes key purchase criteria and drivers of price sensitivity to help companies evaluate and develop their market growth analysis strategies.
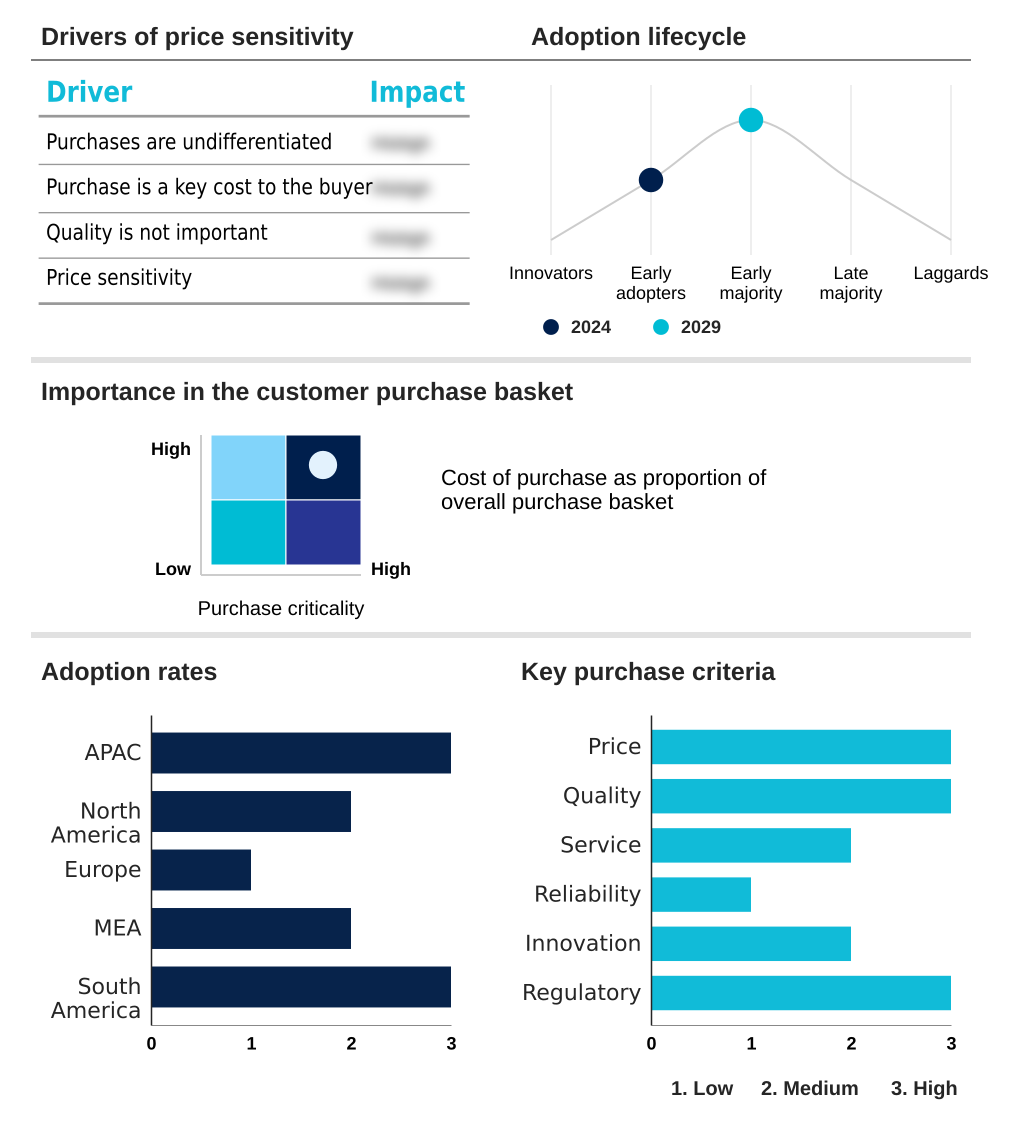
Customer Landscape of Wallcovering Industry
Competitive Landscape
Companies are implementing various strategies, such as strategic alliances, wallcovering market forecast, partnerships, mergers and acquisitions, geographical expansion, and product/service launches, to enhance their presence in the industry.
4walls - The company provides a range of wallcoverings, including the Birla Opus Decor collection, which is designed to enhance the aesthetic appeal of premium interior spaces.
The industry research and growth report includes detailed analyses of the competitive landscape of the market and information about key companies, including:
- 4walls
- Aditya Birla Mgmt. Pvt. Ltd.
- Ahlstrom Oyj
- Arte
- Asian Paints Ltd.
- Brewster Home Fashions
- Casamance
- Cole and Son Wallpapers Ltd
- F. Schumacher and Co.
- Graham and Brown Ltd.
- Koroseal Interior Products LLC
- Len Tex Corp.
- Marburger Tapetenfabrik JB
- Phillip Jeffries
- Rubelli S.p.A.
- Saint Gobain Glass
- Vescom B.V.
- Wallquest Inc.
- York Wallcoverings Inc.
- Zambaiti Parati Srl
Qualitative and quantitative analysis of companies has been conducted to help clients understand the wider business environment as well as the strengths and weaknesses of key industry players. Data is qualitatively analyzed to categorize companies as pure play, category-focused, industry-focused, and diversified; it is quantitatively analyzed to categorize companies as dominant, leading, strong, tentative, and weak.
Recent Development and News in Wallcovering market
- In August 2025, The Beijing International Building Decorations and Materials Exhibition featured its first dedicated pavilion for carbon-neutral wallcoverings, prioritizing environmental impact scores over purely aesthetic metrics.
- In February 2025, Asian Paints Ltd. designated its Spring Tune motif from the Nilaya range as wallpaper of the year, indicating a market pivot toward restorative themes and biophilic design patterns.
- In April 2025, Ahlstrom Oyj launched an expanded series of PVC-free digital printing substrates manufactured from 100 percent recycled fibers and sustainable binders.
- In April 2025, Vescom B.V. introduced a line of carbon-neutral wallcoverings produced using bio-based materials and renewable energy, targeting the contract interior segment.
Dive into Technavio’s robust research methodology, blending expert interviews, extensive data synthesis, and validated models for unparalleled Wallcovering Market insights. See full methodology.
| Market Scope | |
|---|---|
| Page number | 279 |
| Base year | 2025 |
| Historic period | 2020-2024 |
| Forecast period | 2026-2030 |
| Growth momentum & CAGR | Accelerate at a CAGR of 5.4% |
| Market growth 2026-2030 | USD 7357.8 million |
| Market structure | Fragmented |
| YoY growth 2025-2026(%) | 5.0% |
| Key countries | China, Japan, India, South Korea, Australia, Indonesia, US, Canada, Mexico, Germany, UK, France, Italy, Spain, The Netherlands, Saudi Arabia, UAE, South Africa, Israel, Turkey, Brazil, Argentina and Colombia |
| Competitive landscape | Leading Companies, Market Positioning of Companies, Competitive Strategies, and Industry Risks |
Research Analyst Overview
- The wallcovering market is fundamentally evolving from a decorative category to a field of performance-driven interior engineering. Central to this shift is the integration of high-performance materials such as vinyl wallcovering, non-woven substrates, and advanced textile wallcoverings, which deliver functional benefits like acoustic insulation, moisture resistance, and fire retardancy.
- Boardroom-level decisions are increasingly influenced by sustainability mandates, driving the adoption of pvc-free materials, bio-based polymers, and recycled fibers to meet ESG goals. Digital printing technology enables the creation of bespoke wallpaper designs and custom-designed murals, with augmented reality previews streamlining the client approval process. Innovations in this area reduce design-to-market cycles by up to 40%.
- The rise of peel-and-stick wallcoverings caters to demand in residential interiors, while materials with antimicrobial layers and air-purifying capabilities are becoming standard in healthcare and commercial interiors. For high-traffic areas, glass fibre wallcoverings offer exceptional durability.
- This focus on both aesthetics, evident in textured surface designs for luxury interior design, and functionality defines the industry's forward trajectory, supported by large-format digital printing and demand for thermal insulation.
What are the Key Data Covered in this Wallcovering Market Research and Growth Report?
-
What is the expected growth of the Wallcovering Market between 2026 and 2030?
-
USD 7.36 billion, at a CAGR of 5.4%
-
-
What segmentation does the market report cover?
-
The report is segmented by Type (Wall panel, Tiles, and Metallic wall covering), End-user (Residential, and Commercial), Material (Vinyl, Fabric, Paper-based, and Wood-based) and Geography (APAC, North America, Europe, Middle East and Africa, South America)
-
-
Which regions are analyzed in the report?
-
APAC, North America, Europe, Middle East and Africa and South America
-
-
What are the key growth drivers and market challenges?
-
Rising demand for premium interior aesthetics, Fluctuating raw material prices globally
-
-
Who are the major players in the Wallcovering Market?
-
4walls, Aditya Birla Mgmt. Pvt. Ltd., Ahlstrom Oyj, Arte, Asian Paints Ltd., Brewster Home Fashions, Casamance, Cole and Son Wallpapers Ltd, F. Schumacher and Co., Graham and Brown Ltd., Koroseal Interior Products LLC, Len Tex Corp., Marburger Tapetenfabrik JB, Phillip Jeffries, Rubelli S.p.A., Saint Gobain Glass, Vescom B.V., Wallquest Inc., York Wallcoverings Inc. and Zambaiti Parati Srl
-
Market Research Insights
- The market's dynamics are increasingly shaped by a focus on aesthetic and functional innovation. Removable wallpaper and other renter-friendly solutions are experiencing high adoption, with some e-commerce platforms reporting a 40% increase in user engagement for DIY home upgrades.
- In commercial applications, the use of heavy-duty type II vinyl and other durable type II wallcoverings can reduce long-term maintenance costs by up to 25% in high-traffic areas. The demand for architectural interior finishes that offer sound-dampening properties is also rising, with specifications for such materials increasing in corporate and hospitality projects.
- This is complemented by the growing popularity of biophilic design patterns, which are sought after for their ability to enhance occupant well-being in built environments.
We can help! Our analysts can customize this wallcovering market research report to meet your requirements.
 RIA -
RIA - 
