Water Enhancer Market Analysis, Size, and Forecast 2024-2028: North America (US and Canada), Europe (France, Germany, Italy, and UK), Middle East and Africa (Egypt, KSA, Oman, and UAE), APAC (China, India, and Japan), South America (Argentina and Brazil), and Rest of World (ROW)

Water Enhancer Market Analysis, Size, and Forecast 2024-2028:
North America (US and Canada), Europe (France, Germany, Italy, and UK), Middle East and Africa (Egypt, KSA, Oman, and UAE), APAC (China, India, and Japan), South America (Argentina and Brazil), and Rest of World (ROW)

Published: Jun 2024 148 Pages SKU: IRTNTR70395

Market Overview at a Glance

$1.69 B
Market Opportunity
10.03%
CAGR
8.88
YoY growth 2023-2024(%)

Water Enhancer Market Size 2024-2028

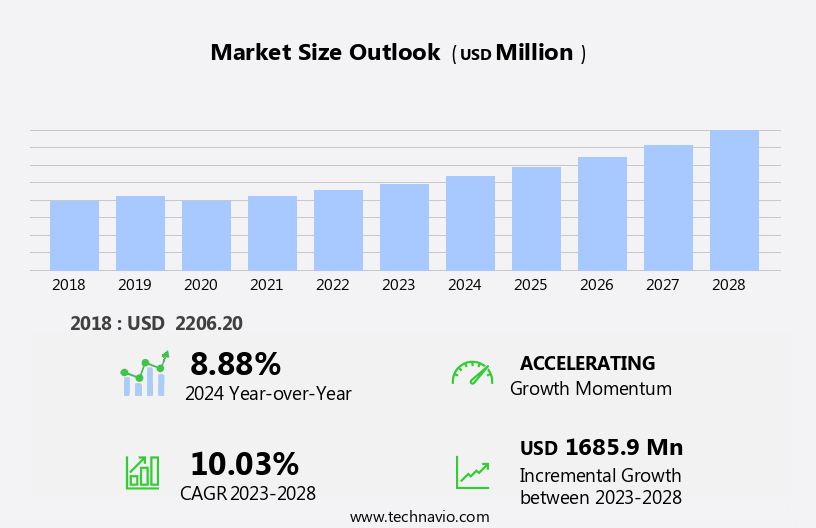
The water enhancer market size is forecast to increase by USD 1.69 billion, at a CAGR of 10.03% between 2023 and 2028.

  • The market is witnessing significant growth, driven by the increasing consumer preference for healthier beverage options. This trend is fueled by the rising awareness of the importance of hydration and maintaining an active lifestyle. Sugars and additives are being replaced with natural alternatives, such as amino acids, protein, and herbal additives, to cater to the health-conscious consumer. Companies are responding to this demand by introducing new flavors and product ranges to cater to diverse consumer preferences. However, the market faces challenges related to consumer concerns over the quality of ingredients and packaging. As consumers become more health-conscious, they are demanding natural and organic ingredients, free from artificial additives. Additionally, there is a growing emphasis on sustainable packaging solutions to reduce environmental impact.
  • Companies that can successfully address these challenges by offering high-quality, natural, and eco-friendly water enhancers will be well-positioned to capitalize on the market's growth opportunities. The strategic landscape of the market is dynamic, with companies continually innovating to meet evolving consumer demands and navigate regulatory requirements. Companies seeking to succeed in this market must stay informed of the latest trends and consumer preferences, while also addressing the challenges related to ingredient quality and sustainable packaging.

What will be the Size of the Water Enhancer Market during the forecast period?

Water Enhancer Market Size

Explore in-depth regional segment analysis with market size data - historical 2018-2022 and forecasts 2024-2028 - in the full report.  
Request Free Sample

The market continues to evolve, driven by advancements in technology and consumer preferences. Mineral composition analysis plays a crucial role in ensuring the optimal balance of essential minerals, while water deionization systems remove ions to enhance water quality. Conductivity measurement is integral to monitoring the efficiency of deionization processes, and UV sterilization methods eradicate harmful microorganisms. Turbidity reduction processes clarify water, and pressure regulation systems maintain consistent water flow. Water softening processes mitigate hardness, and health benefit assessments evaluate the nutritional value of enhanced water. Quality control testing, odor reduction techniques, and filtration media selection further refine water purification systems.

Enhanced water solubility and taste improvement methods cater to consumer preferences, while water dispensing systems ensure convenient access. Dissolved solids content, water filtration membranes, and reverse osmosis systems contribute to water purification capacity. Microbial contamination control, pipeline material selection, and water quality metrics ensure safety and efficiency in distribution networks. Electrolyte balance control, ph level adjustment, hydration optimization processes, and chemical treatment processes further refine water enhancement. Oxidant application methods disinfect water, and mineral enhancement technology optimizes water composition. Membrane fouling control maintains system efficiency, ensuring continuous improvement and innovation in the market.

How is this Water Enhancer Industry segmented?

The water enhancer industry research report provides comprehensive data (region-wise segment analysis), with forecasts and estimates in "USD million" for the period 2024-2028, as well as historical data from 2018-2022 for the following segments.

  • Type
    • Flavored water enhancer
    • Energy water and fitness drops
    • Workout drops
  • Distribution Channel
    • Supermarkets & Hypermarkets
    • Online Retail
    • Convenience Stores
    • Pharmacies
  • Formulation
    • Liquid Concentrates
    • Powder Sachets
    • Tablets
  • Consumer Preference
    • Sugar-Free
    • Organic
    • Natural Flavors
    • Functional Benefits
  • Geography
    • North America
      • US
      • Canada
    • Europe
      • France
      • Germany
      • Italy
      • UK
    • Middle East and Africa
      • Egypt
      • KSA
      • Oman
      • UAE
    • APAC
      • China
      • India
      • Japan
    • South America
      • Argentina
      • Brazil
    • Rest of World (ROW)

By Type Insights

The flavored water enhancer segment is estimated to witness significant growth during the forecast period.

The market for flavored water is gaining traction as consumers seek healthier alternatives to sugary beverages. This category of water includes naturally and artificially flavored variants, sometimes fortified with vitamins, minerals, and electrolytes. Flavored water is available in two main forms: still and sparkling. The rise in childhood health concerns, linked to the excessive consumption of carbonated drinks, is driving the demand for flavored water. Consumers appreciate its refreshing and hydrating qualities, making it a popular choice over plain water. Mineral composition analysis ensures the optimal balance of essential minerals in flavored water. Water deionization systems remove minerals and contaminants, enhancing the water's purity.

Conductivity measurement and UV sterilization methods ensure water quality and safety. Turbidity reduction processes clarify the water, while pressure regulation systems maintain consistent water pressure. Water softening processes improve the water's taste by reducing hardness. Health benefit assessments and quality control testing ensure the product's safety and efficacy. Odor reduction techniques eliminate unwanted smells, while filtration media selection optimizes the water's filtration process. Enhanced water solubility and taste improvement methods make flavored water more appealing. Water dispensing systems provide convenience, and consumer water preference influences product development. Dissolved solids content and water filtration membranes are crucial factors in maintaining water quality.

Reverse osmosis systems and microbial contamination control ensure the water's purity. Pipeline material selection and water quality metrics are essential for maintaining the water's integrity throughout the distribution network. Electrolyte balance control, water hardness reduction, and pH level adjustment are essential for optimal hydration. Chemical treatment processes and oxidant application methods sanitize and disinfect the water. Mineral enhancement technology and membrane fouling control maintain the water's consistency and quality.

Water Enhancer Market Size

Request Free Sample

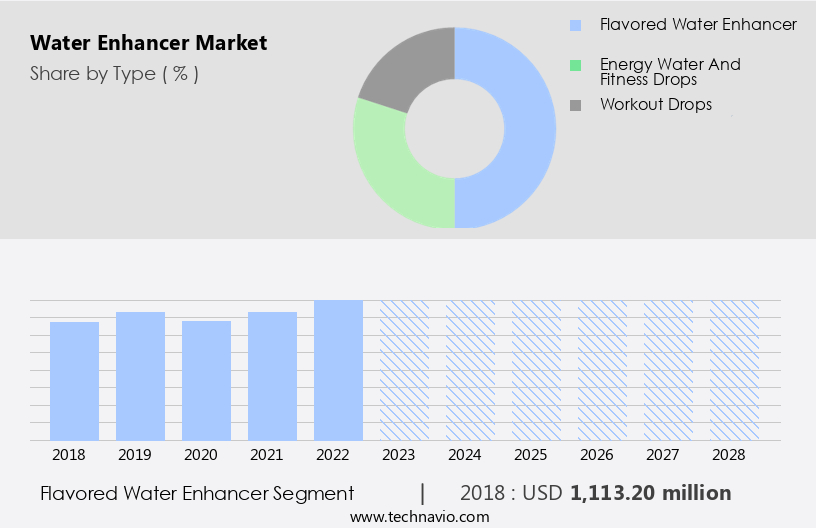
The Flavored water enhancer segment was valued at USD 1.11 billion in 2018 and showed a gradual increase during the forecast period.

Regional Analysis

North America is estimated to contribute 40% to the growth of the global market during the forecast period.Technavio's analysts have elaborately explained the regional trends and drivers that shape the market during the forecast period.

Water Enhancer Market Share by Geography

 Request Free Sample

The market in North America is experiencing significant growth due to increasing consumer preference for healthier beverage options. These enhancers, which contain minerals, vitamins, natural flavors, and plant-based products, cater to the health-conscious demographic. The rising obesity rates and related health concerns are further fueling this trend. In the US, consumers prioritize product differentiation and have easy access to various product categories. Water enhancers undergo rigorous quality control testing, including mineral composition analysis, conductivity measurement, and turbidity reduction processes. To ensure consumer safety, they are subjected to microbial contamination control and odor reduction techniques. Filtration media selection plays a crucial role in enhancing water solubility and improving taste.

Reverse osmosis systems and water filtration membranes are commonly used to remove dissolved solids and impurities. Water deionization systems and pressure regulation systems are essential components in the production process. Electrolyte balance control and ph level adjustment are crucial for maintaining optimal hydration. The water purification system's capacity is enhanced through chemical treatment processes, oxidant application methods, and mineral enhancement technology. Membrane fouling control is also a critical consideration to ensure consistent product quality. The distribution network's efficiency is vital for meeting consumer demand. Pipeline material selection is crucial to ensure product safety and maintain water quality metrics. Overall, the market is driven by consumer preference, health benefits, and technological advancements in water purification systems.

Market Dynamics

The Global water enhancer market is experiencing significant expansion, driven by evolving water enhancer market trends and a growing consumer desire for healthy beverage alternatives. A key driver is the demand for sugar-free water enhancers and zero-calorie water enhancers, catering to health-conscious individuals. Liquid water enhancers remain dominant, but powder water enhancers are gaining traction, offering convenient on-the-go hydration. Consumers increasingly seek functional benefits, favoring electrolyte water enhancers, vitamin water enhancers, and energy water enhancers. The market's dynamism is evident in continuous new product launches water enhancers, often featuring natural flavor water enhancers and innovative water enhancer drops. The Global water enhancer market size is propelled by rising consumer preferences water enhancers for easy hydration solutions, making them popular sports drink alternatives and even catering to the specific needs of children's water enhancers.

Our researchers analyzed the data with 2023 as the base year, along with the key drivers, trends, and challenges. A holistic analysis of drivers will help companies refine their marketing strategies to gain a competitive advantage.

What are the key market drivers leading to the rise in the adoption of Water Enhancer Industry?

  • Consumers' growing emphasis on health and wellness is the primary catalyst fueling market expansion. 
  • Water enhancers have gained significant traction in the market due to consumers' increasing focus on health and wellness. With the rise in health issues such as obesity, cardiovascular diseases, and diabetes, there is a growing preference for hydration solutions that offer dietary benefits without the added sugars and carbonation found in soft drinks. Water enhancers provide an alternative by adding flavor to water while maintaining its purity. These products contain essential vitamins, minerals, electrolytes, and proteins, making them an ideal choice for individuals seeking to optimize their hydration process. Moreover, the chemical treatment process and oxidant application methods used in water enhancers ensure water hardness reduction and ph level adjustment, making them suitable for various palates.
  • The membrane fouling control technology used in these products maintains the efficiency of distribution networks, ensuring a consistent and high-quality product. As contamination levels in drinking water continue to rise, water enhancers offer a clean, bacteria-free alternative, further boosting their popularity.

What are the market trends shaping the Water Enhancer Industry?

  • The introduction of new flavors and product ranges is a current market trend. Professionals in the industry are continually expanding their offerings to cater to evolving consumer preferences.
  • The market is experiencing significant growth due to increasing consumer preference for flavored and healthier beverage options. To cater to this demand, market participants are focusing on product innovation, introducing various flavors such as raspberry, strawberry, pineapple, cucumber, watermelon, and rose water-infused H2ROSE. Manufacturers in the flavored water and fitness/energy drink sectors are also expanding their product lines to stay competitive. Coca-Cola, for instance, has entered the market with DASANI Drops, while Kraft Foods' MiO Fit remains a notable competitor.
  • To ensure product quality and consumer safety, water enhancer manufacturers employ various technologies, including mineral composition analysis, water deionization systems, conductivity measurement, UV sterilization methods, turbidity reduction processes, and pressure regulation systems. Additionally, health benefit assessments are conducted to fortify these products with essential vitamins and minerals. These enhancements not only cater to consumer health concerns but also provide a unique selling proposition for market players.

What challenges does the Water Enhancer Industry face during its growth?

  • The quality of ingredients and packaging represents a significant challenge for the industry, as concerns in these areas can negatively impact growth. 
  • Water enhancers have gained popularity as consumers seek to improve the taste and quality of their drinking water. However, concerns over the use of additives and low-quality ingredients, particularly propylene glycol as a preservative, have arisen. Consumption of water enhancers containing high quantities of these additives can lead to health issues such as acidosis and kidney failure. Furthermore, the use of plastic in packaging for water enhancers has become a subject of controversy due to the environmental impact of plastic waste and the release of harmful greenhouse gases. In response, governments are increasingly regulating the water enhancers industry to ensure quality control testing and the implementation of odor reduction techniques and filtration media selection.
  • Consumers' growing preference for enhanced water solubility and taste improvement methods, as well as the use of advanced water dispensing systems, are driving market growth. However, the environmental concerns surrounding plastic packaging and the potential health risks associated with certain additives may hinder market expansion.

Exclusive Customer Landscape

The water enhancer market forecasting report includes the adoption lifecycle of the market, covering from the innovator's stage to the laggard's stage. It focuses on adoption rates in different regions based on penetration. Furthermore, the water enhancer market report also includes key purchase criteria and drivers of price sensitivity to help companies evaluate and develop their market growth analysis strategies.

Water Enhancer Market Share by Geography

 Customer Landscape

Key Companies & Market Insights

Companies are implementing various strategies, such as strategic alliances, water enhancer market forecast, partnerships, mergers and acquisitions, geographical expansion, and product/service launches, to enhance their presence in the industry.

AriZona Beverages USA LLC - This company specializes in providing a range of water enhancers, including Lemon Iced Tea, Green Tea, Arnold Palmer, and Mucho Mango, enhancing hydration with natural flavors. These beverages cater to diverse consumer preferences, contributing to the growing market demand for flavored water options.

The industry research and growth report includes detailed analyses of the competitive landscape of the market and information about key companies, including:

  • AriZona Beverages USA LLC
  • Beyond Water
  • H2WOW
  • Dyla Brands
  • GNC Holdings LLC
  • Heartland Food Products Group LLC
  • Keurig Dr Pepper Inc.
  • Nestle SA
  • Netrition Inc.
  • PepsiCo Inc.
  • Primo Water Corp.
  • RASNA PVT. LTD.
  • Refresco Group BV
  • sKoya
  • Sunkist Growers Inc.
  • Target Corp.
  • The Coca Cola Co.
  • The Jel Sert Co.
  • The Kraft Heinz Co.
  • Wisdom Natural Brands

Qualitative and quantitative analysis of companies has been conducted to help clients understand the wider business environment as well as the strengths and weaknesses of key industry players. Data is qualitatively analyzed to categorize companies as pure play, category-focused, industry-focused, and diversified; it is quantitatively analyzed to categorize companies as dominant, leading, strong, tentative, and weak.

Recent Development and News in Water Enhancer Market

  • In January 2024, Nestle Waters, a leading global bottled water company, introduced a new line of water enhancers under its Pure Life brand. These drops contain natural flavors and sweeteners, aiming to cater to the growing demand for flavored water beverages (Source: Nestle Waters Press Release).
  • In March 2024, Danone, a leading food and beverage company, announced a strategic partnership with Bio-Techne Corporation to develop and commercialize Bio-Techne's proprietary water soluble vitamins for use in Danone's water enhancer products. This collaboration aims to enhance the nutritional value of Danone's offerings (Source: Danone Press Release).
  • In May 2024, S.Pellegrino, a premium bottled water brand, secured a major distribution deal with Amazon, making its water enhancer products available for purchase on the e-commerce giant's platform in the United States. This expansion is expected to significantly increase S.Pellegrino's reach and market share (Source: S.Pellegrino Press Release).
  • In April 2025, Coca-Cola, the world's largest beverage company, completed the acquisition of BodyArmor, a leading sports drink brand that also offers water enhancers. The acquisition is expected to strengthen Coca-Cola's position in the growing market for functional beverages (Source: Coca-Cola Company SEC Filing).

Research Analyst Overview

  • The market is witnessing significant advancements in water purity improvement through the integration of advanced filtration technology. Efficient water systems are gaining traction, enhancing hydration effects and ensuring water safety protocols. Electrolyte enhancement is a key trend, as consumers seek optimized water ph and mineral absorption rates. Water purification stages, such as water disinfection methods and water treatment technology, are essential components of these systems. Water distribution networks benefit from improved water clarity and reduced odor, while mineral content increases provide additional health benefits. Membrane life extension and energy efficiency upgrades are crucial for sustainable water practices.
  • Consumer sensory testing plays a vital role in ensuring water taste enhancement and meeting water quality standards. Water desalination processes are also gaining popularity, offering solutions for water scarcity in certain regions. Water softening techniques and filtration system design continue to evolve, addressing the diverse needs of businesses and households. Water quality monitoring and water safety protocols are paramount in maintaining consumer trust and confidence. Overall, the market is driven by the demand for cleaner, safer, and more efficient water solutions.

Dive into Technavio's robust research methodology, blending expert interviews, extensive data synthesis, and validated models for unparalleled Water Enhancer Market insights. See full methodology.

Market Scope

Report Coverage

Details

Page number

148

Base year

2023

Historic period

2018-2022

Forecast period

2024-2028

Growth momentum & CAGR

Accelerate at a CAGR of 10.03%

Market growth 2024-2028

USD 1685.9 million

Market structure

Fragmented

YoY growth 2023-2024(%)

8.88

Key countries

US, Canada, Germany, UK, Italy, France, China, India, Japan, Brazil, Egypt, UAE, Oman, Argentina, KSA, UAE, Brazil, and Rest of World (ROW)

Competitive landscape

Leading Companies, Market Positioning of Companies, Competitive Strategies, and Industry Risks

Request Free Sample

What are the Key Data Covered in this Water Enhancer Market Research and Growth Report?

  • CAGR of the Water Enhancer industry during the forecast period
  • Detailed information on factors that will drive the growth and forecasting between 2024 and 2028
  • Precise estimation of the size of the market and its contribution of the industry in focus to the parent market
  • Accurate predictions about upcoming growth and trends and changes in consumer behaviour
  • Growth of the market across North America, Europe, APAC, South America, and Middle East and Africa
  • Thorough analysis of the market's competitive landscape and detailed information about companies
  • Comprehensive analysis of factors that will challenge the water enhancer market growth of industry companies

We can help! Our analysts can customize this water enhancer market research report to meet your requirements.

Get in touch

1 Executive Summary

  • 1.1 Market overview
    • Executive Summary - Chart on Market Overview
    • Executive Summary - Data Table on Market Overview
    • Executive Summary - Chart on Global Market Characteristics
    • Executive Summary - Chart on Market by Geography
    • Executive Summary - Chart on Market Segmentation by Type
    • Executive Summary - Chart on Incremental Growth
    • Executive Summary - Data Table on Incremental Growth
    • Executive Summary - Chart on Company Market Positioning

2 Market Landscape

  • 2.1 Market ecosystem
    • Parent Market
    • Data Table on - Parent Market
  • 2.2 Market characteristics
    • Market characteristics analysis
  • 2.3 Value chain analysis
    • Value Chain Analysis

3 Market Sizing

  • 3.1 Market definition
    • Offerings of companies included in the market definition
  • 3.2 Market segment analysis
    • Market segments
  • 3.3 Market size 2023
    • 3.4 Market outlook: Forecast for 2023-2028
      • Chart on Global - Market size and forecast 2023-2028 ($ million)
      • Data Table on Global - Market size and forecast 2023-2028 ($ million)
      • Chart on Global Market: Year-over-year growth 2023-2028 (%)
      • Data Table on Global Market: Year-over-year growth 2023-2028 (%)

    4 Historic Market Size

    • 4.1 Global Water Enhancer Market 2018 - 2022
      • Historic Market Size - Data Table on Global Water Enhancer Market 2018 - 2022 ($ million)
    • 4.2 Type segment analysis 2018 - 2022
      • Historic Market Size - Type Segment 2018 - 2022 ($ million)
    • 4.3 Geography segment analysis 2018 - 2022
      • Historic Market Size - Geography Segment 2018 - 2022 ($ million)
    • 4.4 Country segment analysis 2018 - 2022
      • Historic Market Size - Country Segment 2018 - 2022 ($ million)

    5 Five Forces Analysis

    • 5.1 Five forces summary
      • Five forces analysis - Comparison between 2023 and 2028
    • 5.2 Bargaining power of buyers
      • Bargaining power of buyers - Impact of key factors 2023 and 2028
    • 5.3 Bargaining power of suppliers
      • Bargaining power of suppliers - Impact of key factors in 2023 and 2028
    • 5.4 Threat of new entrants
      • Threat of new entrants - Impact of key factors in 2023 and 2028
    • 5.5 Threat of substitutes
      • Threat of substitutes - Impact of key factors in 2023 and 2028
    • 5.6 Threat of rivalry
      • Threat of rivalry - Impact of key factors in 2023 and 2028
    • 5.7 Market condition
      • Chart on Market condition - Five forces 2023 and 2028

    6 Market Segmentation by Type

    • 6.1 Market segments
      • Chart on Type - Market share (2023-2028) (%)
      • Data Table on Type - Market share (2023-2028) (%)
    • 6.2 Comparison by Type
      • Chart on Comparison by Type
      • Data Table on Comparison by Type
    • 6.3 Flavored water enhancer - Market size and forecast (2023-2028)
      • Chart on Flavored water enhancer - Market size and forecast (2023-2028) ($ million)
      • Data Table on Flavored water enhancer - Market size and forecast (2023-2028) ($ million)
      • Chart on Flavored water enhancer - Year-over-year growth (2023-2028) (%)
      • Data Table on Flavored water enhancer - Year-over-year growth (2023-2028) (%)
    • 6.4 Energy water and fitness drops - Market size and forecast (2023-2028)
      • Chart on Energy water and fitness drops - Market size and forecast (2023-2028) ($ million)
      • Data Table on Energy water and fitness drops - Market size and forecast (2023-2028) ($ million)
      • Chart on Energy water and fitness drops - Year-over-year growth (2023-2028) (%)
      • Data Table on Energy water and fitness drops - Year-over-year growth (2023-2028) (%)
    • 6.5 Workout drops - Market size and forecast (2023-2028)
      • Chart on Workout drops - Market size and forecast (2023-2028) ($ million)
      • Data Table on Workout drops - Market size and forecast (2023-2028) ($ million)
      • Chart on Workout drops - Year-over-year growth (2023-2028) (%)
      • Data Table on Workout drops - Year-over-year growth (2023-2028) (%)
    • 6.6 Market opportunity by Type
      • Market opportunity by Type ($ million)
      • Data Table on Market opportunity by Type ($ million)

    7 Market Segmentation by Distribution Channel

    • 7.1 Market segments
      • Chart on Distribution Channel - Market share (2023-2028) (%)
      • Data Table on Distribution Channel - Market share (2023-2028) (%)
    • 7.2 Comparison by Distribution Channel
      • Chart on Comparison by Distribution Channel
      • Data Table on Comparison by Distribution Channel
    • 7.3 Supermarkets & Hypermarkets - Market size and forecast (2023-2028)
      • Chart on Supermarkets & Hypermarkets - Market size and forecast (2023-2028) ($ million)
      • Data Table on Supermarkets & Hypermarkets - Market size and forecast (2023-2028) ($ million)
      • Chart on Supermarkets & Hypermarkets - Year-over-year growth (2023-2028) (%)
      • Data Table on Supermarkets & Hypermarkets - Year-over-year growth (2023-2028) (%)
    • 7.4 Online Retail - Market size and forecast (2023-2028)
      • Chart on Online Retail - Market size and forecast (2023-2028) ($ million)
      • Data Table on Online Retail - Market size and forecast (2023-2028) ($ million)
      • Chart on Online Retail - Year-over-year growth (2023-2028) (%)
      • Data Table on Online Retail - Year-over-year growth (2023-2028) (%)
    • 7.5 Convenience Stores - Market size and forecast (2023-2028)
      • Chart on Convenience Stores - Market size and forecast (2023-2028) ($ million)
      • Data Table on Convenience Stores - Market size and forecast (2023-2028) ($ million)
      • Chart on Convenience Stores - Year-over-year growth (2023-2028) (%)
      • Data Table on Convenience Stores - Year-over-year growth (2023-2028) (%)
    • 7.6 Pharmacies - Market size and forecast (2023-2028)
      • Chart on Pharmacies - Market size and forecast (2023-2028) ($ million)
      • Data Table on Pharmacies - Market size and forecast (2023-2028) ($ million)
      • Chart on Pharmacies - Year-over-year growth (2023-2028) (%)
      • Data Table on Pharmacies - Year-over-year growth (2023-2028) (%)
    • 7.7 Market opportunity by Distribution Channel
      • Market opportunity by Distribution Channel ($ million)
      • Data Table on Market opportunity by Distribution Channel ($ million)

    8 Market Segmentation by Formulation

    • 8.1 Market segments
      • Chart on Formulation - Market share (2023-2028) (%)
      • Data Table on Formulation - Market share (2023-2028) (%)
    • 8.2 Comparison by Formulation
      • Chart on Comparison by Formulation
      • Data Table on Comparison by Formulation
    • 8.3 Liquid Concentrates - Market size and forecast (2023-2028)
      • Chart on Liquid Concentrates - Market size and forecast (2023-2028) ($ million)
      • Data Table on Liquid Concentrates - Market size and forecast (2023-2028) ($ million)
      • Chart on Liquid Concentrates - Year-over-year growth (2023-2028) (%)
      • Data Table on Liquid Concentrates - Year-over-year growth (2023-2028) (%)
    • 8.4 Powder Sachets - Market size and forecast (2023-2028)
      • Chart on Powder Sachets - Market size and forecast (2023-2028) ($ million)
      • Data Table on Powder Sachets - Market size and forecast (2023-2028) ($ million)
      • Chart on Powder Sachets - Year-over-year growth (2023-2028) (%)
      • Data Table on Powder Sachets - Year-over-year growth (2023-2028) (%)
    • 8.5 Tablets - Market size and forecast (2023-2028)
      • Chart on Tablets - Market size and forecast (2023-2028) ($ million)
      • Data Table on Tablets - Market size and forecast (2023-2028) ($ million)
      • Chart on Tablets - Year-over-year growth (2023-2028) (%)
      • Data Table on Tablets - Year-over-year growth (2023-2028) (%)
    • 8.6 Market opportunity by Formulation
      • Market opportunity by Formulation ($ million)
      • Data Table on Market opportunity by Formulation ($ million)

    9 Market Segmentation by Consumer Preference

    • 9.1 Market segments
      • Chart on Consumer Preference - Market share (2023-2028) (%)
      • Data Table on Consumer Preference - Market share (2023-2028) (%)
    • 9.2 Comparison by Consumer Preference
      • Chart on Comparison by Consumer Preference
      • Data Table on Comparison by Consumer Preference
    • 9.3 Sugar-Free - Market size and forecast (2023-2028)
      • Chart on Sugar-Free - Market size and forecast (2023-2028) ($ million)
      • Data Table on Sugar-Free - Market size and forecast (2023-2028) ($ million)
      • Chart on Sugar-Free - Year-over-year growth (2023-2028) (%)
      • Data Table on Sugar-Free - Year-over-year growth (2023-2028) (%)
    • 9.4 Organic - Market size and forecast (2023-2028)
      • Chart on Organic - Market size and forecast (2023-2028) ($ million)
      • Data Table on Organic - Market size and forecast (2023-2028) ($ million)
      • Chart on Organic - Year-over-year growth (2023-2028) (%)
      • Data Table on Organic - Year-over-year growth (2023-2028) (%)
    • 9.5 Natural Flavors - Market size and forecast (2023-2028)
      • Chart on Natural Flavors - Market size and forecast (2023-2028) ($ million)
      • Data Table on Natural Flavors - Market size and forecast (2023-2028) ($ million)
      • Chart on Natural Flavors - Year-over-year growth (2023-2028) (%)
      • Data Table on Natural Flavors - Year-over-year growth (2023-2028) (%)
    • 9.6 Functional Benefits - Market size and forecast (2023-2028)
      • Chart on Functional Benefits - Market size and forecast (2023-2028) ($ million)
      • Data Table on Functional Benefits - Market size and forecast (2023-2028) ($ million)
      • Chart on Functional Benefits - Year-over-year growth (2023-2028) (%)
      • Data Table on Functional Benefits - Year-over-year growth (2023-2028) (%)
    • 9.7 Market opportunity by Consumer Preference
      • Market opportunity by Consumer Preference ($ million)
      • Data Table on Market opportunity by Consumer Preference ($ million)

    10 Customer Landscape

    • 10.1 Customer landscape overview
      • Analysis of price sensitivity, lifecycle, customer purchase basket, adoption rates, and purchase criteria

    11 Geographic Landscape

    • 11.1 Geographic segmentation
      • Chart on Market share by geography 2023-2028 (%)
      • Data Table on Market share by geography 2023-2028 (%)
    • 11.2 Geographic comparison
      • Chart on Geographic comparison
      • Data Table on Geographic comparison
    • 11.3 North America - Market size and forecast 2023-2028
      • Chart on North America - Market size and forecast 2023-2028 ($ million)
      • Data Table on North America - Market size and forecast 2023-2028 ($ million)
      • Chart on North America - Year-over-year growth 2023-2028 (%)
      • Data Table on North America - Year-over-year growth 2023-2028 (%)
    • 11.4 Europe - Market size and forecast 2023-2028
      • Chart on Europe - Market size and forecast 2023-2028 ($ million)
      • Data Table on Europe - Market size and forecast 2023-2028 ($ million)
      • Chart on Europe - Year-over-year growth 2023-2028 (%)
      • Data Table on Europe - Year-over-year growth 2023-2028 (%)
    • 11.5 APAC - Market size and forecast 2023-2028
      • Chart on APAC - Market size and forecast 2023-2028 ($ million)
      • Data Table on APAC - Market size and forecast 2023-2028 ($ million)
      • Chart on APAC - Year-over-year growth 2023-2028 (%)
      • Data Table on APAC - Year-over-year growth 2023-2028 (%)
    • 11.6 South America - Market size and forecast 2023-2028
      • Chart on South America - Market size and forecast 2023-2028 ($ million)
      • Data Table on South America - Market size and forecast 2023-2028 ($ million)
      • Chart on South America - Year-over-year growth 2023-2028 (%)
      • Data Table on South America - Year-over-year growth 2023-2028 (%)
    • 11.7 Middle East and Africa - Market size and forecast 2023-2028
      • Chart on Middle East and Africa - Market size and forecast 2023-2028 ($ million)
      • Data Table on Middle East and Africa - Market size and forecast 2023-2028 ($ million)
      • Chart on Middle East and Africa - Year-over-year growth 2023-2028 (%)
      • Data Table on Middle East and Africa - Year-over-year growth 2023-2028 (%)
    • 11.8 US - Market size and forecast 2023-2028
      • Chart on US - Market size and forecast 2023-2028 ($ million)
      • Data Table on US - Market size and forecast 2023-2028 ($ million)
      • Chart on US - Year-over-year growth 2023-2028 (%)
      • Data Table on US - Year-over-year growth 2023-2028 (%)
    • 11.9 UK - Market size and forecast 2023-2028
      • Chart on UK - Market size and forecast 2023-2028 ($ million)
      • Data Table on UK - Market size and forecast 2023-2028 ($ million)
      • Chart on UK - Year-over-year growth 2023-2028 (%)
      • Data Table on UK - Year-over-year growth 2023-2028 (%)
    • 11.10 China - Market size and forecast 2023-2028
      • Chart on China - Market size and forecast 2023-2028 ($ million)
      • Data Table on China - Market size and forecast 2023-2028 ($ million)
      • Chart on China - Year-over-year growth 2023-2028 (%)
      • Data Table on China - Year-over-year growth 2023-2028 (%)
    • 11.11 Canada - Market size and forecast 2023-2028
      • Chart on Canada - Market size and forecast 2023-2028 ($ million)
      • Data Table on Canada - Market size and forecast 2023-2028 ($ million)
      • Chart on Canada - Year-over-year growth 2023-2028 (%)
      • Data Table on Canada - Year-over-year growth 2023-2028 (%)
    • 11.12 Germany - Market size and forecast 2023-2028
      • Chart on Germany - Market size and forecast 2023-2028 ($ million)
      • Data Table on Germany - Market size and forecast 2023-2028 ($ million)
      • Chart on Germany - Year-over-year growth 2023-2028 (%)
      • Data Table on Germany - Year-over-year growth 2023-2028 (%)
    • 11.13 Market opportunity by geography
      • Market opportunity by geography ($ million)
      • Data Tables on Market opportunity by geography ($ million)
    • 11.14 Italy - Market size and forecast (2023-2028)
      • Chart on Italy - Market size and forecast (2023-2028) ($ million)
      • Data Table on Italy - Market size and forecast (2023-2028) ($ million)
      • Chart on Italy - Year-over-year growth (2023-2028) (%)
      • Data Table on Italy - Year-over-year growth (2023-2028) (%)
    • 11.15 France - Market size and forecast (2023-2028)
      • Chart on France - Market size and forecast (2023-2028) ($ million)
      • Data Table on France - Market size and forecast (2023-2028) ($ million)
      • Chart on France - Year-over-year growth (2023-2028) (%)
      • Data Table on France - Year-over-year growth (2023-2028) (%)
    • 11.16 India - Market size and forecast (2023-2028)
      • Chart on India - Market size and forecast (2023-2028) ($ million)
      • Data Table on India - Market size and forecast (2023-2028) ($ million)
      • Chart on India - Year-over-year growth (2023-2028) (%)
      • Data Table on India - Year-over-year growth (2023-2028) (%)
    • 11.17 Japan - Market size and forecast (2023-2028)
      • Chart on Japan - Market size and forecast (2023-2028) ($ million)
      • Data Table on Japan - Market size and forecast (2023-2028) ($ million)
      • Chart on Japan - Year-over-year growth (2023-2028) (%)
      • Data Table on Japan - Year-over-year growth (2023-2028) (%)
    • 11.18 Brazil - Market size and forecast (2023-2028)
      • Chart on Brazil - Market size and forecast (2023-2028) ($ million)
      • Data Table on Brazil - Market size and forecast (2023-2028) ($ million)
      • Chart on Brazil - Year-over-year growth (2023-2028) (%)
      • Data Table on Brazil - Year-over-year growth (2023-2028) (%)
    • 11.19 Egypt - Market size and forecast (2023-2028)
      • Chart on Egypt - Market size and forecast (2023-2028) ($ million)
      • Data Table on Egypt - Market size and forecast (2023-2028) ($ million)
      • Chart on Egypt - Year-over-year growth (2023-2028) (%)
      • Data Table on Egypt - Year-over-year growth (2023-2028) (%)
    • 11.20 UAE - Market size and forecast (2023-2028)
      • Chart on UAE - Market size and forecast (2023-2028) ($ million)
      • Data Table on UAE - Market size and forecast (2023-2028) ($ million)
      • Chart on UAE - Year-over-year growth (2023-2028) (%)
      • Data Table on UAE - Year-over-year growth (2023-2028) (%)
    • 11.21 Oman - Market size and forecast (2023-2028)
      • Chart on Oman - Market size and forecast (2023-2028) ($ million)
      • Data Table on Oman - Market size and forecast (2023-2028) ($ million)
      • Chart on Oman - Year-over-year growth (2023-2028) (%)
      • Data Table on Oman - Year-over-year growth (2023-2028) (%)
    • 11.22 Argentina - Market size and forecast (2023-2028)
      • Chart on Argentina - Market size and forecast (2023-2028) ($ million)
      • Data Table on Argentina - Market size and forecast (2023-2028) ($ million)
      • Chart on Argentina - Year-over-year growth (2023-2028) (%)
      • Data Table on Argentina - Year-over-year growth (2023-2028) (%)
    • 11.23 KSA - Market size and forecast (2023-2028)
      • Chart on KSA - Market size and forecast (2023-2028) ($ million)
      • Data Table on KSA - Market size and forecast (2023-2028) ($ million)
      • Chart on KSA - Year-over-year growth (2023-2028) (%)
      • Data Table on KSA - Year-over-year growth (2023-2028) (%)
    • 11.24 Rest of World (ROW) - Market size and forecast (2023-2028)
      • Chart on Rest of World (ROW) - Market size and forecast (2023-2028) ($ million)
      • Data Table on Rest of World (ROW) - Market size and forecast (2023-2028) ($ million)
      • Chart on Rest of World (ROW) - Year-over-year growth (2023-2028) (%)
      • Data Table on Rest of World (ROW) - Year-over-year growth (2023-2028) (%)

    12 Drivers, Challenges, and Opportunity/Restraints

    • 12.1 Market drivers
      • 12.2 Market challenges
        • 12.3 Impact of drivers and challenges
          • Impact of drivers and challenges in 2023 and 2028
        • 12.4 Market opportunities/restraints

          13 Competitive Landscape

          • 13.1 Overview
            • 13.2 Competitive Landscape
              • Overview on criticality of inputs and factors of differentiation
            • 13.3 Landscape disruption
              • Overview on factors of disruption
            • 13.4 Industry risks
              • Impact of key risks on business

            14 Competitive Analysis

            • 14.1 Companies profiled
              • Companies covered
            • 14.2 Market positioning of companies
              • Matrix on companies position and classification
            • 14.3 AriZona Beverages USA LLC
              • AriZona Beverages USA LLC - Overview
              • AriZona Beverages USA LLC - Product / Service
              • AriZona Beverages USA LLC - Key offerings
            • 14.4 H2WOW
              • H2WOW - Overview
              • H2WOW - Product / Service
              • H2WOW - Key offerings
            • 14.5 Dyla Brands
              • Dyla Brands - Overview
              • Dyla Brands - Product / Service
              • Dyla Brands - Key offerings
            • 14.6 GNC Holdings LLC
              • GNC Holdings LLC - Overview
              • GNC Holdings LLC - Product / Service
              • GNC Holdings LLC - Key news
              • GNC Holdings LLC - Key offerings
            • 14.7 Heartland Food Products Group LLC
              • Heartland Food Products Group LLC - Overview
              • Heartland Food Products Group LLC - Product / Service
              • Heartland Food Products Group LLC - Key offerings
            • 14.8 Keurig Dr Pepper Inc.
              • Keurig Dr Pepper Inc. - Overview
              • Keurig Dr Pepper Inc. - Business segments
              • Keurig Dr Pepper Inc. - Key news
              • Keurig Dr Pepper Inc. - Key offerings
              • Keurig Dr Pepper Inc. - Segment focus
            • 14.9 Nestle SA
              • Nestle SA - Overview
              • Nestle SA - Business segments
              • Nestle SA - Key news
              • Nestle SA - Key offerings
              • Nestle SA - Segment focus
            • 14.10 Netrition Inc.
              • Netrition Inc. - Overview
              • Netrition Inc. - Product / Service
              • Netrition Inc. - Key offerings
            • 14.11 PepsiCo Inc.
              • PepsiCo Inc. - Overview
              • PepsiCo Inc. - Business segments
              • PepsiCo Inc. - Key news
              • PepsiCo Inc. - Key offerings
              • PepsiCo Inc. - Segment focus
            • 14.12 The Jel Sert Co.
              • The Jel Sert Co. - Overview
              • The Jel Sert Co. - Product / Service
              • The Jel Sert Co. - Key offerings

            15 Appendix

            • 15.1 Scope of the report
              • 15.2 Inclusions and exclusions checklist
                • Inclusions checklist
                • Exclusions checklist
              • 15.3 Currency conversion rates for US$
                • Currency conversion rates for US$
              • 15.4 Research methodology
                • Research methodology
              • 15.5 Data procurement
                • Information sources
              • 15.6 Data validation
                • Data validation
              • 15.7 Validation techniques employed for market sizing
                • Validation techniques employed for market sizing
              • 15.8 Data synthesis
                • Data synthesis
              • 15.9 360 degree market analysis
                • 360 degree market analysis
              • 15.10 List of abbreviations
                • List of abbreviations

              Research Methodology

              Technavio presents a detailed picture of the market by way of study, synthesis, and summation of data from multiple sources. The analysts have presented the various facets of the market with a particular focus on identifying the key industry influencers. The data thus presented is comprehensive, reliable, and the result of extensive research, both primary and secondary.

              INFORMATION SOURCES

              Primary sources

              • Manufacturers and suppliers
              • Channel partners
              • Industry experts
              • Strategic decision makers

              Secondary sources

              • Industry journals and periodicals
              • Government data
              • Financial reports of key industry players
              • Historical data
              • Press releases

              DATA ANALYSIS

              Data Synthesis

              • Collation of data
              • Estimation of key figures
              • Analysis of derived insights

              Data Validation

              • Triangulation with data models
              • Reference against proprietary databases
              • Corroboration with industry experts

              REPORT WRITING

              Qualitative

              • Market drivers
              • Market challenges
              • Market trends
              • Five forces analysis

              Quantitative

              • Market size and forecast
              • Market segmentation
              • Geographical insights
              • Competitive landscape

              Interested in this report?

              Get your sample now to see our research methodology and insights!

              Download Now

              Frequently Asked Questions

              Water Enhancer market growth will increase by $ 1685.9 mn during 2024-2028 .

              The Water Enhancer market is expected to grow at a CAGR of 10.03% during 2024-2028 .

              Water Enhancer market is segmented by Type( Flavored water enhancer, Energy water and fitness drops, Workout drops) Distribution Channel( Supermarkets & Hypermarkets, Online Retail, Convenience Stores, Pharmacies, MEA)

              AriZona Beverages USA LLC, Beyond Water, H2WOW, Dyla Brands, GNC Holdings LLC, Heartland Food Products Group LLC, Keurig Dr Pepper Inc., Nestle SA, Netrition Inc., PepsiCo Inc., Primo Water Corp., RASNA PVT. LTD., Refresco Group BV, sKoya, Sunkist Growers Inc., Target Corp., The Coca Cola Co., The Jel Sert Co., The Kraft Heinz Co., Wisdom Natural Brands are a few of the key vendors in the Water Enhancer market.

              North America will register the highest growth rate of 40% among the other regions. Therefore, the Water Enhancer market in North America is expected to garner significant business opportunities for the vendors during the forecast period.

              US, Canada, Germany, UK, Italy, France, China, India, Japan, Brazil, Egypt, UAE, Oman, Argentina, KSA, UAE, Brazil, Rest of World (ROW)

              • Increasing focus on health and wellness by consumersOver the past few years is the driving factor this market.
              • there has been an increase in the prevalence of health problems such as obesity is the driving factor this market.
              • cardiovascular diseases is the driving factor this market.
              • and diabetes. Therefore is the driving factor this market.
              • consumers are becoming more health-conscious and avoiding artificially flavored and carbonated drinks. Carbonated drinks taste tangy and fizzy due to dissolved carbon dioxide but have many health issues such as obesity. However is the driving factor this market.
              • water enhancers add flavor as well as supplementary dietary benefits to water without any carbonation process. Flavored water and fitness/energy drinks contain vitamins is the driving factor this market.
              • minerals is the driving factor this market.
              • electrolytes is the driving factor this market.
              • and proteins. The rising contamination levels in drinking water are also influencing consumers to shift to water enhancers is the driving factor this market.
              • which are purified is the driving factor this market.
              • clean is the driving factor this market.
              • and bacteria-free. Manufacturers are aligning themselves with the demands of consumers by developing healthy beverages. The demand for flavored water is particularly high among the geriatric population is the driving factor this market.
              • while fitness/energy drinks are popular among the youth as post-workout drinks. Some of the health benefits of flavored water enhancers are weight reduction is the driving factor this market.
              • improved skin texture is the driving factor this market.
              • improved digestion is the driving factor this market.
              • and immunity. Rapid urbanization indicates a rise in per capita income and disposable incomes of consumers is the driving factor this market.
              • followed by changes in lifestyles and dietary behaviors. According to the World Bank Group is the driving factor this market.
              • in 2023 is the driving factor this market.
              • 57% of the global population lived in urban areas. Therefore is the driving factor this market.
              • with rapid urbanization and the growing focus on health and wellness by consumers is the driving factor this market.
              • the market in focus is expected to witness growth during the forecast period. is the driving factor this market.

              The Water Enhancer market vendors should focus on grabbing business opportunities from the Flavored water enhancer segment as it accounted for the largest market share in the base year.