Rose Water Market Analysis, Size, and Forecast 2025-2029: Europe (France, Germany, Italy, UK), APAC (China, India, Japan, South Korea), North America (US and Canada), Middle East and Africa , and South America

Rose Water Market Analysis, Size, and Forecast 2025-2029:
Europe (France, Germany, Italy, UK), APAC (China, India, Japan, South Korea), North America (US and Canada), Middle East and Africa , and South America

Published: Mar 2025 199 Pages SKU: IRTNTR75687

Market Overview at a Glance

$230.4 Mn
Market Opportunity
10%
CAGR
8.9
YoY growth 2024-2025(%)

Rose Water Market Size 2025-2029

The rose water market size is forecast to increase by USD 230.4 million, at a CAGR of 10% between 2024 and 2029.

  • The market is experiencing significant growth, driven primarily by increasing applications in the food and beverage industry. The versatility of rose water as a flavoring agent and its ability to enhance the taste and aroma of various dishes make it a popular choice among food manufacturers and consumers. Furthermore, the growing preference for aromatherapy for stress relief and overall wellness has fueled the demand for rose water in personal care and cosmetic products. However, the market faces challenges as well. The availability of substitutes, such as synthetic rose essences and other natural aromatics, poses a threat to the market's growth.
  • Producers must differentiate themselves by emphasizing the unique benefits of natural rose water, such as its superior fragrance and potential health advantages. Additionally, ensuring a consistent supply of high-quality rose water, which is primarily sourced from specific regions, can be a challenge due to climate conditions and other external factors. Companies must establish robust sourcing strategies and maintain strong relationships with suppliers to mitigate these risks and secure a steady supply of raw materials.

What will be the Size of the Rose Water Market during the forecast period?

Rose Water Market Size

Explore in-depth regional segment analysis with market size data - historical 2019-2023 and forecasts 2025-2029 - in the full report.  
Request Free Sample

The market continues to evolve, driven by the versatility and appeal of this ancient ingredient. Rose water, derived from the steam distillation of rose petals, is used across various sectors, including food, beverage, cosmetics, and traditional medicine. Sensory evaluation plays a crucial role in the market, with consumers seeking authentic rose water flavor and scent intensity. Brands strive to maintain brand loyalty by ensuring the highest quality through sustainable sourcing, natural preservatives, and strict quality control measures. Rose water's anti-inflammatory properties make it a popular choice for stress relief and mental health applications. In the cosmetics industry, it is used for its moisturizing properties and as a gentle ingredient in facial mists and sprays.

The market also sees innovation in preservation methods, such as using glass bottles to maintain the product's freshness and longevity. The market is subject to evolving patterns, with ongoing research into new extraction methods, such as solvent extraction and supercritical CO2 extraction, to produce rose oil and rose extract. Consumer preferences for organic and natural products have led to the growth of certified organic rose water and rose hydrosol. Quality control is a critical factor in the market, with safety standards and labeling requirements ensuring the purity and authenticity of rose water. Pricing strategies and supply chain management are also essential elements, with online retailers and wholesale distributors playing a significant role in the market's dynamics.

The market's continuous evolution is reflected in its diverse applications, from culinary uses to therapeutic applications, and its ability to adapt to changing consumer preferences and market trends. The market's dynamic nature is further emphasized by the ongoing research into the ingredient's antioxidant properties and floral notes, adding to its allure and appeal.

How is this Rose Water Industry segmented?

The rose water industry research report provides comprehensive data (region-wise segment analysis), with forecasts and estimates in "USD million" for the period 2025-2029, as well as historical data from 2019-2023 for the following segments.

  • Application
    • Fragrance and cosmetics
    • Pharmaceuticals
    • Food and beverages
  • Distribution Channel
    • Indirect sales channel
    • Direct sales channel
  • End-user
    • Individual consumers
    • Commercial users
  • Geography
    • North America
      • US
      • Canada
    • Europe
      • France
      • Germany
      • Italy
      • UK
    • APAC
      • China
      • India
      • Japan
      • South Korea
    • Rest of World (ROW)

    By Application Insights

    The fragrance and cosmetics segment is estimated to witness significant growth during the forecast period.

    The global market for rose water in fragrance and cosmetics is witnessing growth due to the rising demand for natural and organic ingredients. Obtained through the distillation of rose petals, rose water is a versatile ingredient known for its soothing, hydrating, and fragrance-enhancing properties. It is increasingly used in perfumes, skincare, and other cosmetic products. Supercritical CO2 extraction and steam distillation are common methods used for rose water production, ensuring product purity and maintaining the aroma profile. Natural preservatives are employed to extend the shelf life, while safety standards and labeling requirements are strictly adhered to. Rose water's therapeutic uses, including stress relief and sleep enhancement, add to its appeal in the traditional medicine sector.

    In the cosmetics industry, rose water is used for its moisturizing properties and as a natural alternative to chemical preservatives. Consumer preferences for sustainable sourcing and eco-friendly packaging materials have led to an increase in the production of rose water in glass bottles. In the fragrance industry, rose oil and rose absolute are derived from rose water through solvent extraction, while facial mists and sprays are popular product formats. However, microbial contamination is a concern, necessitating stringent quality control measures. The market is also witnessing the emergence of certified organic rose water and rose hydrosol, catering to consumers seeking natural and authentic products.

    Wholesale distribution and retail channels have played a crucial role in the supply chain management of rose water, ensuring its availability to consumers worldwide. Pricing strategies vary based on product differentiation, ingredient sourcing, and production methods. The aroma and scent intensity of rose water, along with its anti-inflammatory and antioxidant properties, further contribute to its popularity.

    Rose Water Market Size

    Request Free Sample

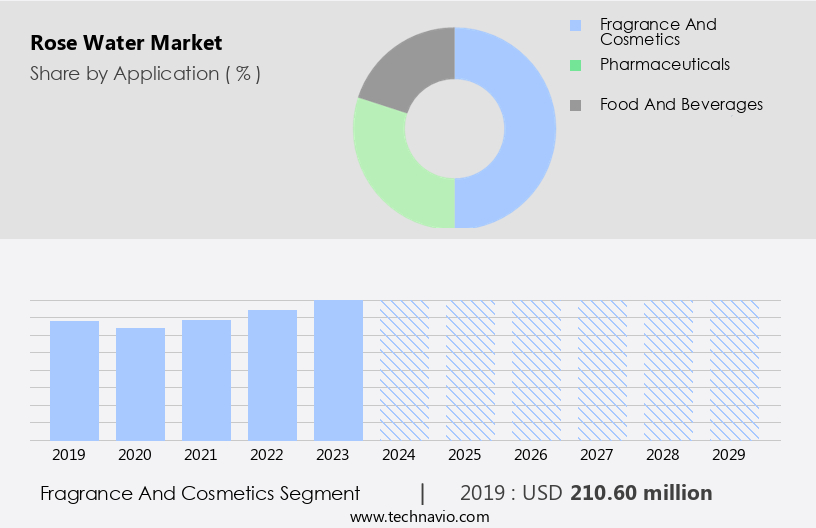
    The Fragrance and cosmetics segment was valued at USD 210.60 million in 2019 and showed a gradual increase during the forecast period.

    Regional Analysis

    Europe is estimated to contribute 44% to the growth of the global market during the forecast period.Technavio’s analysts have elaborately explained the regional trends and drivers that shape the market during the forecast period.

    Rose Water Market Share by Geography

     Request Free Sample

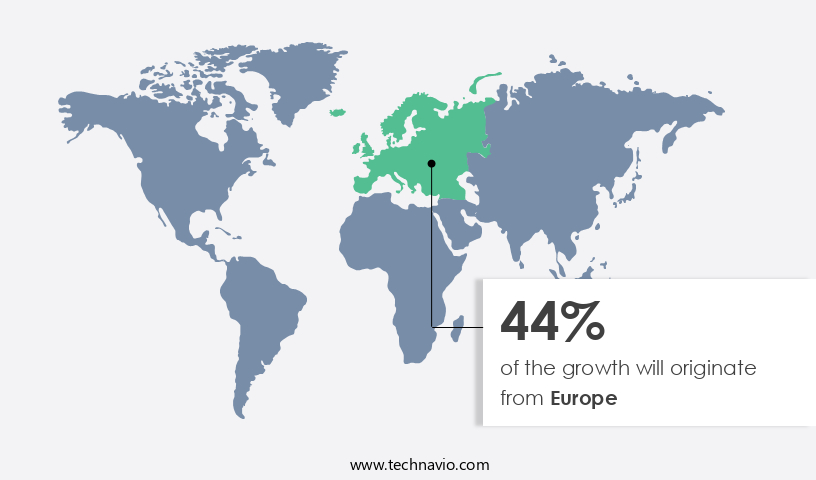
    In Europe, Bulgaria, known for its rose cultivation, is a significant producer and exporter of rose water to countries including France, the US, Japan, and Ireland. Bulgaria and Turkey rank as the second and third largest producers worldwide of rosehip fruit extract. The European market is witnessing a rising preference for natural processing methods, leading to an anticipated increase in demand for rose water. The CO2 extraction method, which uses supercritical carbon dioxide to extract essential oils, is gaining popularity over traditional solvent extraction. Rose water, distilled from rose petals, is valued for its soothing properties and is used in traditional medicine, cosmetics, culinary applications, and for sleep enhancement.

    The market trend towards natural preservatives and sustainable sourcing is driving the demand for rose water in glass bottles. To ensure product safety and shelf life, preservation methods and strict safety standards are essential. Packaging materials, such as spray bottles and pump bottles, are chosen based on their ability to maintain the aroma profile and sensory evaluation of the product. Consumer preferences for organic and certified organic rose water, along with labeling requirements, are influencing pricing strategies. The market for rose water is diverse, with applications ranging from therapeutic uses to facial mists and rose extracts. Wholesale distribution and retail channels are essential for efficient supply chain management.

    Quality control measures, such as monitoring pH levels and preventing microbial contamination, are crucial for maintaining the product's integrity. Sustainable sourcing, adherence to safety standards, and product differentiation are key factors shaping the market dynamics.

    Market Dynamics

    Our researchers analyzed the data with 2024 as the base year, along with the key drivers, trends, and challenges. A holistic analysis of drivers will help companies refine their marketing strategies to gain a competitive advantage.

    In the thriving the market, producers harvest roses, primarily Damask and cabbage roses, to extract their essential water. This aromatic liquid, obtained through a traditional steam distillation process, is a key ingredient in various industries. Rose water finds extensive use in the food sector for flavoring desserts, beverages, and baked goods. In cosmetics, it serves as a natural fragrance component and skin conditioner. Pharmaceutically, rose water is employed for its anti-inflammatory, antioxidant, and antimicrobial properties. The market for rose water is driven by its versatility, health benefits, and the growing demand for natural and organic products. Consumers seek it out for its ability to soothe digestive issues, improve complexion, and add a delightful aroma to culinary creations. Rose water exports are significant, with major producers including Bulgaria, Iran, and Turkey. The market continues to expand as awareness of its numerous applications and benefits grows.

    What are the key market drivers leading to the rise in the adoption of Rose Water Industry?

    • The food and beverage industry's expanding application sector serves as the primary market growth catalyst. 

    • The global market for rose water is experiencing growth due to its increasing applications in the food and beverage industry. This natural ingredient is used as a flavoring agent and is appreciated for its pleasing aroma and taste. It is incorporated into various food and beverage products, including cakes, pastries, chocolates, ice cream, tea, and alcoholic drinks. The demand for rose water is escalating as consumers seek healthier and natural alternatives for enhancing the taste and aroma of their food and beverages without relying on artificial flavors. Rose water's shelf life can be extended by using appropriate packaging materials and proper storage and handling techniques.
    • It is essential to maintain the pH levels to prevent microbial contamination during production and storage. Solvent extraction is a common method used to extract rose water from rose petals. Sustainable sourcing of rose petals is crucial to ensure the highest quality of rose water. Online retailers have made it easier for consumers to purchase rose water for cosmetic applications, such as facial mists, and for culinary uses. Wholesale distribution and effective supply chain management are crucial for businesses to meet the growing demand for rose water. Overall, the market for rose water is driven by its versatile applications, natural health benefits, and consumer preference for natural ingredients.

    What are the market trends shaping the Rose Water Industry?

    • The increasing popularity of aromatherapy as a stress relief solution is a notable market trend. This holistic approach to wellness, utilizing essential oils for therapeutic benefits, is gaining significant attention and acceptance in professional health and wellness circles.

    • The global market for rose water has seen significant growth due to increasing consumer preferences for natural remedies and aromatherapy for stress relief. Rose water, with its pleasant, floral aroma and therapeutic properties, is widely used in aromatherapy to promote relaxation and calm the mind. Its soothing properties are believed to help alleviate pain and discomfort caused by stress and tension, making it a popular choice for those seeking natural alternatives to traditional medicines. In the market, pump bottles and spray bottles are commonly used for easy application and convenience. Labeling requirements ensure transparency and certifications, such as certified organic, add credibility to the product.
    • Pricing strategies vary based on the quality and source of the rose extract used in production. As a result, rose water has become a popular and differentiated product in the market, catering to consumers seeking natural and holistic solutions for stress relief and overall well-being.

    What challenges does the Rose Water Industry face during its growth?

    • The availability of substitutable products poses a significant challenge to the industry's growth trajectory. 

    • The global market for rose water faces challenges from numerous substitutes, including lilac water and lavender water, which offer similar sensory experiences at competitive prices. In the food and beverage industry, lilac water's extensive use in jellies, syrups, and salads limits the demand for rose water. Cosmetic manufacturers also have alternatives, such as hibiscus, orange blossom, violet, carnation, chamomile, and jasmine water, which can be used instead of rose water. These substitutes pose a significant risk to the growth of the market.
    • However, the unique aroma profile and scent intensity of rose water, along with its anti-inflammatory and antioxidant properties, contribute to brand loyalty among consumers. The ingredient sourcing and quality control practices employed by manufacturers play a crucial role in preserving the authentic rose water flavor obtained through steam distillation.

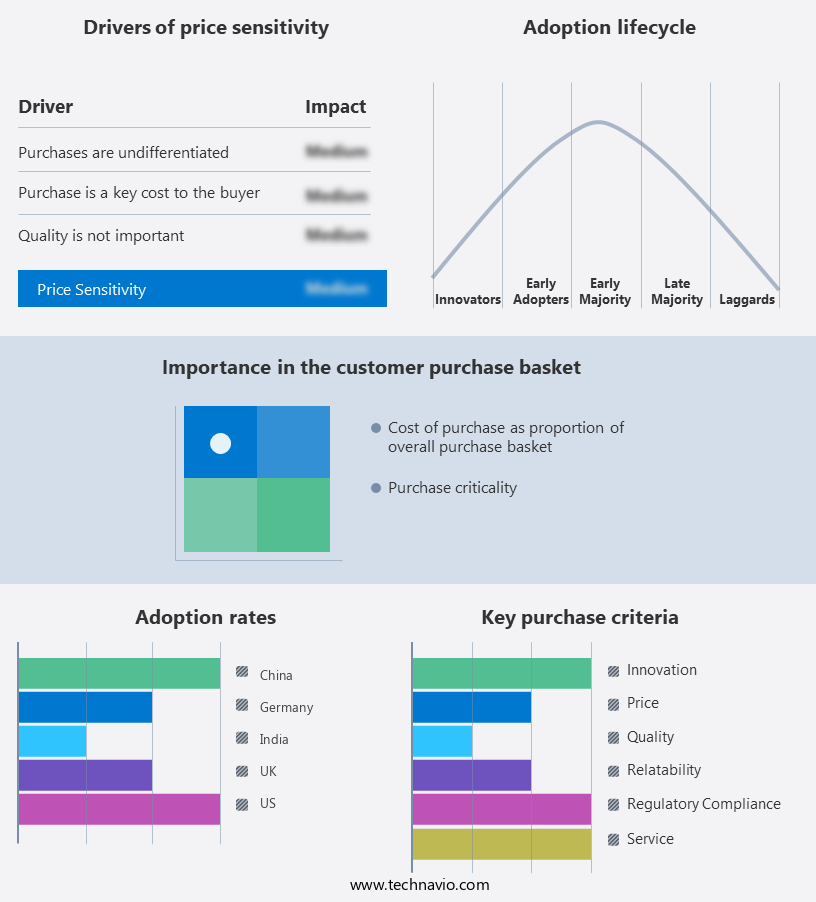
    Exclusive Customer Landscape

    The rose water market forecasting report includes the adoption lifecycle of the market, covering from the innovator’s stage to the laggard’s stage. It focuses on adoption rates in different regions based on penetration. Furthermore, the rose water market report also includes key purchase criteria and drivers of price sensitivity to help companies evaluate and develop their market growth analysis strategies.

    Rose Water Market Share by Geography

     Customer Landscape

    Key Companies & Market Insights

    Companies are implementing various strategies, such as strategic alliances, rose water market forecast, partnerships, mergers and acquisitions, geographical expansion, and product/service launches, to enhance their presence in the industry.

    A.G. Industries - This company specializes in providing authentic rose waters, specifically Organic Bulgarian rose water, enhancing online presence through original content. Our product elevates culinary creations and aromatherapy practices, embodying a commitment to quality and sustainability.

    The industry research and growth report includes detailed analyses of the competitive landscape of the market and information about key companies, including:

    • A.G. Industries
    • Aadhunik Ayurveda Vitals
    • Alteya Inc.
    • Azelis SA
    • Biosash Business Pvt. Ltd.
    • Dabur India Ltd.
    • Eve Hansen
    • Givaudan SA
    • Iran Golab Co.
    • Kannauj Attar
    • MEENA PERFUMERY
    • Nutraceutical Corp.
    • Poppy Austin Ltd.
    • Rose of Bulgaria
    • S A S Jean GAZIGNAIRE
    • SINGHAI FRAGRANCES
    • SVA Naturals
    • Tabib Daru Co.
    • Taj Agro International
    • ZOFLA LIFE ENTERPRISES

    Qualitative and quantitative analysis of companies has been conducted to help clients understand the wider business environment as well as the strengths and weaknesses of key industry players. Data is qualitatively analyzed to categorize companies as pure play, category-focused, industry-focused, and diversified; it is quantitatively analyzed to categorize companies as dominant, leading, strong, tentative, and weak.

    Recent Development and News in Rose Water Market

    • In January 2024, leading rose water producer, Nectar Essences, announced the launch of its new organic rose water line, expanding its product portfolio to cater to the growing demand for organic and natural ingredients in food and beverage applications (Nectar Essences Press Release, 2024).
    • In March 2024, the market major player, Amara Essentials, entered into a strategic partnership with a leading Middle Eastern distributor, Al Faisaliah Trading, to strengthen its presence in the region and tap into the growing demand for rose water in the Middle Eastern and African markets (Amara Essentials Press Release, 2024).
    • In May 2024, rose water manufacturer, Damask Rose Co., secured a significant investment of USD10 million from a leading venture capital firm, enabling the company to expand its production capacity and accelerate its growth plans (Venture Capital Firm Press Release, 2024).
    • In February 2025, the European Commission approved the use of rose water as a natural food flavoring, paving the way for its increased adoption in the European food and beverage industry and boosting the market growth prospects (European Commission Press Release, 2025).

    Research Analyst Overview

    • In the complex and dynamic the market, sensory perception plays a pivotal role in product lifecycle management and brand positioning. Skin regeneration and wound healing properties are key drivers, with Damask rose (Rosa damascena) and Rosa centifolia leading the charge. Risk management is essential in navigating supply chain disruptions and ensuring quality assurance. Regulatory affairs, including export and import regulations, patent protection, and intellectual property rights, significantly impact market activity. Sustainability initiatives, such as those focusing on rose geranium and Bulgarian rose, are gaining traction among consumers. Fragrance chemistry and anti-aging properties, including those found in rose otto and rosehip oil, are also popular trends.
    • Marketing strategies and packaging design are crucial for reaching the target audience, which includes those seeking eczema relief and acne treatment. Inventory management and demand forecasting are essential components of product development, while competitive advantages are sought through innovation and consumer behavior analysis. The international trade landscape continues to evolve, with rose water seeing increasing demand and sales forecasts remaining strong. Throughout this market, distribution channels and regulatory compliance are critical for success. The rose water industry's intricacies necessitate a nuanced understanding of fragrance chemistry, product development, and inventory management.

    Dive into Technavio’s robust research methodology, blending expert interviews, extensive data synthesis, and validated models for unparalleled Rose Water Market insights. See full methodology.

    Market Scope

    Report Coverage

    Details

    Page number

    199

    Base year

    2024

    Historic period

    2019-2023

    Forecast period

    2025-2029

    Growth momentum & CAGR

    Accelerate at a CAGR of 10%

    Market growth 2025-2029

    USD 230.4 million

    Market structure

    Fragmented

    YoY growth 2024-2025(%)

    8.9

    Key countries

    US, China, Germany, UK, Japan, India, France, South Korea, Italy, and Canada

    Competitive landscape

    Leading Companies, Market Positioning of Companies, Competitive Strategies, and Industry Risks

    Request Free Sample

    What are the Key Data Covered in this Rose Water Market Research and Growth Report?

    • CAGR of the Rose Water industry during the forecast period
    • Detailed information on factors that will drive the growth and forecasting between 2025 and 2029
    • Precise estimation of the size of the market and its contribution of the industry in focus to the parent market
    • Accurate predictions about upcoming growth and trends and changes in consumer behaviour
    • Growth of the market across Europe, APAC, North America, Middle East and Africa, and South America
    • Thorough analysis of the market’s competitive landscape and detailed information about companies
    • Comprehensive analysis of factors that will challenge the rose water market growth of industry companies

    We can help! Our analysts can customize this rose water market research report to meet your requirements.

    Get in touch


    1 Executive Summary

    • 1.1 Market overview
      • Executive Summary - Chart on Market Overview
      • Executive Summary - Data Table on Market Overview
      • Executive Summary - Chart on Global Market Characteristics
      • Executive Summary - Chart on Market by Geography
      • Executive Summary - Chart on Market Segmentation by Application
      • Executive Summary - Chart on Market Segmentation by Distribution Channel
      • Executive Summary - Chart on Market Segmentation by End-user
      • Executive Summary - Chart on Incremental Growth
      • Executive Summary - Data Table on Incremental Growth
      • Executive Summary - Chart on Company Market Positioning

    2 Technavio Analysis

    • 2.1 Analysis of price sensitivity, lifecycle, customer purchase basket, adoption rates, and purchase criteria
      • Analysis of price sensitivity, lifecycle, customer purchase basket, adoption rates, and purchase criteria
    • 2.2 Criticality of inputs and Factors of differentiation
      • Overview on criticality of inputs and factors of differentiation
    • 2.3 Factors of disruption
      • Overview on factors of disruption
    • 2.4 Impact of drivers and challenges
      • Impact of drivers and challenges in 2024 and 2029

    3 Market Landscape

    • 3.1 Market ecosystem
      • Parent Market
      • Data Table on - Parent Market
    • 3.2 Market characteristics
      • Market characteristics analysis
    • 3.3 Value chain analysis
      • Value chain analysis

    4 Market Sizing

    • 4.1 Market definition
      • Offerings of companies included in the market definition
    • 4.2 Market segment analysis
      • Market segments
    • 4.3 Market size 2024
      • 4.4 Market outlook: Forecast for 2024-2029
        • Chart on Global - Market size and forecast 2024-2029 ($ million)
        • Data Table on Global - Market size and forecast 2024-2029 ($ million)
        • Chart on Global Market: Year-over-year growth 2024-2029 (%)
        • Data Table on Global Market: Year-over-year growth 2024-2029 (%)

      5 Historic Market Size

      • 5.1 Global Rose Water Market 2019 - 2023
        • Historic Market Size - Data Table on Global Rose Water Market 2019 - 2023 ($ million)
      • 5.2 Application segment analysis 2019 - 2023
        • Historic Market Size - Application Segment 2019 - 2023 ($ million)
      • 5.3 Distribution Channel segment analysis 2019 - 2023
        • Historic Market Size - Distribution Channel Segment 2019 - 2023 ($ million)
      • 5.4 End-user segment analysis 2019 - 2023
        • Historic Market Size - End-user Segment 2019 - 2023 ($ million)
      • 5.5 Geography segment analysis 2019 - 2023
        • Historic Market Size - Geography Segment 2019 - 2023 ($ million)
      • 5.6 Country segment analysis 2019 - 2023
        • Historic Market Size - Country Segment 2019 - 2023 ($ million)

      6 Qualitative Analysis

      • 6.1 Impact of AI on Global Rose Water Market

        7 Five Forces Analysis

        • 7.1 Five forces summary
          • Five forces analysis - Comparison between 2024 and 2029
        • 7.2 Bargaining power of buyers
          • Bargaining power of buyers - Impact of key factors 2024 and 2029
        • 7.3 Bargaining power of suppliers
          • Bargaining power of suppliers - Impact of key factors in 2024 and 2029
        • 7.4 Threat of new entrants
          • Threat of new entrants - Impact of key factors in 2024 and 2029
        • 7.5 Threat of substitutes
          • Threat of substitutes - Impact of key factors in 2024 and 2029
        • 7.6 Threat of rivalry
          • Threat of rivalry - Impact of key factors in 2024 and 2029
        • 7.7 Market condition
          • Chart on Market condition - Five forces 2024 and 2029

        8 Market Segmentation by Application

        • 8.1 Market segments
          • Chart on Application - Market share 2024-2029 (%)
          • Data Table on Application - Market share 2024-2029 (%)
        • 8.2 Comparison by Application
          • Chart on Comparison by Application
          • Data Table on Comparison by Application
        • 8.3 Fragrance and cosmetics - Market size and forecast 2024-2029
          • Chart on Fragrance and cosmetics - Market size and forecast 2024-2029 ($ million)
          • Data Table on Fragrance and cosmetics - Market size and forecast 2024-2029 ($ million)
          • Chart on Fragrance and cosmetics - Year-over-year growth 2024-2029 (%)
          • Data Table on Fragrance and cosmetics - Year-over-year growth 2024-2029 (%)
        • 8.4 Pharmaceuticals - Market size and forecast 2024-2029
          • Chart on Pharmaceuticals - Market size and forecast 2024-2029 ($ million)
          • Data Table on Pharmaceuticals - Market size and forecast 2024-2029 ($ million)
          • Chart on Pharmaceuticals - Year-over-year growth 2024-2029 (%)
          • Data Table on Pharmaceuticals - Year-over-year growth 2024-2029 (%)
        • 8.5 Food and beverages - Market size and forecast 2024-2029
          • Chart on Food and beverages - Market size and forecast 2024-2029 ($ million)
          • Data Table on Food and beverages - Market size and forecast 2024-2029 ($ million)
          • Chart on Food and beverages - Year-over-year growth 2024-2029 (%)
          • Data Table on Food and beverages - Year-over-year growth 2024-2029 (%)
        • 8.6 Market opportunity by Application
          • Market opportunity by Application ($ million)
          • Data Table on Market opportunity by Application ($ million)

        9 Market Segmentation by Distribution Channel

        • 9.1 Market segments
          • Chart on Distribution Channel - Market share 2024-2029 (%)
          • Data Table on Distribution Channel - Market share 2024-2029 (%)
        • 9.2 Comparison by Distribution Channel
          • Chart on Comparison by Distribution Channel
          • Data Table on Comparison by Distribution Channel
        • 9.3 Indirect sales channel - Market size and forecast 2024-2029
          • Chart on Indirect sales channel - Market size and forecast 2024-2029 ($ million)
          • Data Table on Indirect sales channel - Market size and forecast 2024-2029 ($ million)
          • Chart on Indirect sales channel - Year-over-year growth 2024-2029 (%)
          • Data Table on Indirect sales channel - Year-over-year growth 2024-2029 (%)
        • 9.4 Direct sales channel - Market size and forecast 2024-2029
          • Chart on Direct sales channel - Market size and forecast 2024-2029 ($ million)
          • Data Table on Direct sales channel - Market size and forecast 2024-2029 ($ million)
          • Chart on Direct sales channel - Year-over-year growth 2024-2029 (%)
          • Data Table on Direct sales channel - Year-over-year growth 2024-2029 (%)
        • 9.5 Market opportunity by Distribution Channel
          • Market opportunity by Distribution Channel ($ million)
          • Data Table on Market opportunity by Distribution Channel ($ million)

        10 Market Segmentation by End-user

        • 10.1 Market segments
          • Chart on End-user - Market share 2024-2029 (%)
          • Data Table on End-user - Market share 2024-2029 (%)
        • 10.2 Comparison by End-user
          • Chart on Comparison by End-user
          • Data Table on Comparison by End-user
        • 10.3 Individual consumers - Market size and forecast 2024-2029
          • Chart on Individual consumers - Market size and forecast 2024-2029 ($ million)
          • Data Table on Individual consumers - Market size and forecast 2024-2029 ($ million)
          • Chart on Individual consumers - Year-over-year growth 2024-2029 (%)
          • Data Table on Individual consumers - Year-over-year growth 2024-2029 (%)
        • 10.4 Commercial users - Market size and forecast 2024-2029
          • Chart on Commercial users - Market size and forecast 2024-2029 ($ million)
          • Data Table on Commercial users - Market size and forecast 2024-2029 ($ million)
          • Chart on Commercial users - Year-over-year growth 2024-2029 (%)
          • Data Table on Commercial users - Year-over-year growth 2024-2029 (%)
        • 10.5 Market opportunity by End-user
          • Market opportunity by End-user ($ million)
          • Data Table on Market opportunity by End-user ($ million)

        11 Customer Landscape

        • 11.1 Customer landscape overview
          • Analysis of price sensitivity, lifecycle, customer purchase basket, adoption rates, and purchase criteria

        12 Geographic Landscape

        • 12.1 Geographic segmentation
          • Chart on Market share by geography 2024-2029 (%)
          • Data Table on Market share by geography 2024-2029 (%)
        • 12.2 Geographic comparison
          • Chart on Geographic comparison
          • Data Table on Geographic comparison
        • 12.3 Europe - Market size and forecast 2024-2029
          • Chart on Europe - Market size and forecast 2024-2029 ($ million)
          • Data Table on Europe - Market size and forecast 2024-2029 ($ million)
          • Chart on Europe - Year-over-year growth 2024-2029 (%)
          • Data Table on Europe - Year-over-year growth 2024-2029 (%)
        • 12.4 APAC - Market size and forecast 2024-2029
          • Chart on APAC - Market size and forecast 2024-2029 ($ million)
          • Data Table on APAC - Market size and forecast 2024-2029 ($ million)
          • Chart on APAC - Year-over-year growth 2024-2029 (%)
          • Data Table on APAC - Year-over-year growth 2024-2029 (%)
        • 12.5 North America - Market size and forecast 2024-2029
          • Chart on North America - Market size and forecast 2024-2029 ($ million)
          • Data Table on North America - Market size and forecast 2024-2029 ($ million)
          • Chart on North America - Year-over-year growth 2024-2029 (%)
          • Data Table on North America - Year-over-year growth 2024-2029 (%)
        • 12.6 Middle East and Africa - Market size and forecast 2024-2029
          • Chart on Middle East and Africa - Market size and forecast 2024-2029 ($ million)
          • Data Table on Middle East and Africa - Market size and forecast 2024-2029 ($ million)
          • Chart on Middle East and Africa - Year-over-year growth 2024-2029 (%)
          • Data Table on Middle East and Africa - Year-over-year growth 2024-2029 (%)
        • 12.7 South America - Market size and forecast 2024-2029
          • Chart on South America - Market size and forecast 2024-2029 ($ million)
          • Data Table on South America - Market size and forecast 2024-2029 ($ million)
          • Chart on South America - Year-over-year growth 2024-2029 (%)
          • Data Table on South America - Year-over-year growth 2024-2029 (%)
        • 12.8 US - Market size and forecast 2024-2029
          • Chart on US - Market size and forecast 2024-2029 ($ million)
          • Data Table on US - Market size and forecast 2024-2029 ($ million)
          • Chart on US - Year-over-year growth 2024-2029 (%)
          • Data Table on US - Year-over-year growth 2024-2029 (%)
        • 12.9 China - Market size and forecast 2024-2029
          • Chart on China - Market size and forecast 2024-2029 ($ million)
          • Data Table on China - Market size and forecast 2024-2029 ($ million)
          • Chart on China - Year-over-year growth 2024-2029 (%)
          • Data Table on China - Year-over-year growth 2024-2029 (%)
        • 12.10 Germany - Market size and forecast 2024-2029
          • Chart on Germany - Market size and forecast 2024-2029 ($ million)
          • Data Table on Germany - Market size and forecast 2024-2029 ($ million)
          • Chart on Germany - Year-over-year growth 2024-2029 (%)
          • Data Table on Germany - Year-over-year growth 2024-2029 (%)
        • 12.11 UK - Market size and forecast 2024-2029
          • Chart on UK - Market size and forecast 2024-2029 ($ million)
          • Data Table on UK - Market size and forecast 2024-2029 ($ million)
          • Chart on UK - Year-over-year growth 2024-2029 (%)
          • Data Table on UK - Year-over-year growth 2024-2029 (%)
        • 12.12 Japan - Market size and forecast 2024-2029
          • Chart on Japan - Market size and forecast 2024-2029 ($ million)
          • Data Table on Japan - Market size and forecast 2024-2029 ($ million)
          • Chart on Japan - Year-over-year growth 2024-2029 (%)
          • Data Table on Japan - Year-over-year growth 2024-2029 (%)
        • 12.13 India - Market size and forecast 2024-2029
          • Chart on India - Market size and forecast 2024-2029 ($ million)
          • Data Table on India - Market size and forecast 2024-2029 ($ million)
          • Chart on India - Year-over-year growth 2024-2029 (%)
          • Data Table on India - Year-over-year growth 2024-2029 (%)
        • 12.14 France - Market size and forecast 2024-2029
          • Chart on France - Market size and forecast 2024-2029 ($ million)
          • Data Table on France - Market size and forecast 2024-2029 ($ million)
          • Chart on France - Year-over-year growth 2024-2029 (%)
          • Data Table on France - Year-over-year growth 2024-2029 (%)
        • 12.15 Italy - Market size and forecast 2024-2029
          • Chart on Italy - Market size and forecast 2024-2029 ($ million)
          • Data Table on Italy - Market size and forecast 2024-2029 ($ million)
          • Chart on Italy - Year-over-year growth 2024-2029 (%)
          • Data Table on Italy - Year-over-year growth 2024-2029 (%)
        • 12.16 South Korea - Market size and forecast 2024-2029
          • Chart on South Korea - Market size and forecast 2024-2029 ($ million)
          • Data Table on South Korea - Market size and forecast 2024-2029 ($ million)
          • Chart on South Korea - Year-over-year growth 2024-2029 (%)
          • Data Table on South Korea - Year-over-year growth 2024-2029 (%)
        • 12.17 Canada - Market size and forecast 2024-2029
          • Chart on Canada - Market size and forecast 2024-2029 ($ million)
          • Data Table on Canada - Market size and forecast 2024-2029 ($ million)
          • Chart on Canada - Year-over-year growth 2024-2029 (%)
          • Data Table on Canada - Year-over-year growth 2024-2029 (%)
        • 12.18 Market opportunity by geography
          • Market opportunity by geography ($ million)
          • Data Tables on Market opportunity by geography ($ million)

        13 Drivers, Challenges, and Opportunity/Restraints

        • 13.1 Market drivers
          • 13.2 Market challenges
            • 13.3 Impact of drivers and challenges
              • Impact of drivers and challenges in 2024 and 2029
            • 13.4 Market opportunities/restraints

              14 Competitive Landscape

              • 14.1 Overview
                • 14.2 Competitive Landscape
                  • Overview on criticality of inputs and factors of differentiation
                • 14.3 Landscape disruption
                  • Overview on factors of disruption
                • 14.4 Industry risks
                  • Impact of key risks on business

                15 Competitive Analysis

                • 15.1 Companies profiled
                  • Companies covered
                • 15.2 Company ranking index
                  • Company ranking index
                • 15.3 Market positioning of companies
                  • Matrix on companies position and classification
                • 15.4 Alteya Inc.
                  • Alteya Inc. - Overview
                  • Alteya Inc. - Product / Service
                  • Alteya Inc. - Key offerings
                  • SWOT
                • 15.5 Azelis SA
                  • Azelis SA - Overview
                  • Azelis SA - Business segments
                  • Azelis SA - Key offerings
                  • Azelis SA - Segment focus
                  • SWOT
                • 15.6 Biosash Business Pvt. Ltd.
                  • Biosash Business Pvt. Ltd. - Overview
                  • Biosash Business Pvt. Ltd. - Product / Service
                  • Biosash Business Pvt. Ltd. - Key offerings
                  • SWOT
                • 15.7 Dabur India Ltd.
                  • Dabur India Ltd. - Overview
                  • Dabur India Ltd. - Business segments
                  • Dabur India Ltd. - Key news
                  • Dabur India Ltd. - Key offerings
                  • Dabur India Ltd. - Segment focus
                  • SWOT
                • 15.8 Eve Hansen
                  • Eve Hansen - Overview
                  • Eve Hansen - Product / Service
                  • Eve Hansen - Key offerings
                  • SWOT
                • 15.9 Givaudan SA
                  • Givaudan SA - Overview
                  • Givaudan SA - Business segments
                  • Givaudan SA - Key news
                  • Givaudan SA - Key offerings
                  • Givaudan SA - Segment focus
                  • SWOT
                • 15.10 Iran Golab Co.
                  • Iran Golab Co. - Overview
                  • Iran Golab Co. - Product / Service
                  • Iran Golab Co. - Key offerings
                  • SWOT
                • 15.11 Kannauj Attar
                  • Kannauj Attar - Overview
                  • Kannauj Attar - Product / Service
                  • Kannauj Attar - Key offerings
                  • SWOT
                • 15.12 MEENA PERFUMERY
                  • MEENA PERFUMERY - Overview
                  • MEENA PERFUMERY - Product / Service
                  • MEENA PERFUMERY - Key offerings
                  • SWOT
                • 15.13 Nutraceutical Corp.
                  • Nutraceutical Corp. - Overview
                  • Nutraceutical Corp. - Product / Service
                  • Nutraceutical Corp. - Key offerings
                  • SWOT
                • 15.14 Poppy Austin Ltd.
                  • Poppy Austin Ltd. - Overview
                  • Poppy Austin Ltd. - Product / Service
                  • Poppy Austin Ltd. - Key offerings
                  • SWOT
                • 15.15 Rose of Bulgaria
                  • Rose of Bulgaria - Overview
                  • Rose of Bulgaria - Product / Service
                  • Rose of Bulgaria - Key offerings
                  • SWOT
                • 15.16 S A S Jean GAZIGNAIRE
                  • S A S Jean GAZIGNAIRE - Overview
                  • S A S Jean GAZIGNAIRE - Product / Service
                  • S A S Jean GAZIGNAIRE - Key offerings
                  • SWOT
                • 15.17 Tabib Daru Co.
                  • Tabib Daru Co. - Overview
                  • Tabib Daru Co. - Product / Service
                  • Tabib Daru Co. - Key offerings
                  • SWOT
                • 15.18 ZOFLA LIFE ENTERPRISES
                  • ZOFLA LIFE ENTERPRISES - Overview
                  • ZOFLA LIFE ENTERPRISES - Product / Service
                  • ZOFLA LIFE ENTERPRISES - Key offerings
                  • SWOT

                16 Appendix

                • 16.1 Scope of the report
                  • 16.2 Inclusions and exclusions checklist
                    • Inclusions checklist
                    • Exclusions checklist
                  • 16.3 Currency conversion rates for US$
                    • Currency conversion rates for US$
                  • 16.4 Research methodology
                    • Research methodology
                  • 16.5 Data procurement
                    • Information sources
                  • 16.6 Data validation
                    • Data validation
                  • 16.7 Validation techniques employed for market sizing
                    • Validation techniques employed for market sizing
                  • 16.8 Data synthesis
                    • Data synthesis
                  • 16.9 360 degree market analysis
                    • 360 degree market analysis
                  • 16.10 List of abbreviations
                    • List of abbreviations

                  Research Methodology

                  Technavio presents a detailed picture of the market by way of study, synthesis, and summation of data from multiple sources. The analysts have presented the various facets of the market with a particular focus on identifying the key industry influencers. The data thus presented is comprehensive, reliable, and the result of extensive research, both primary and secondary.

                  INFORMATION SOURCES

                  Primary sources

                  • Manufacturers and suppliers
                  • Channel partners
                  • Industry experts
                  • Strategic decision makers

                  Secondary sources

                  • Industry journals and periodicals
                  • Government data
                  • Financial reports of key industry players
                  • Historical data
                  • Press releases

                  DATA ANALYSIS

                  Data Synthesis

                  • Collation of data
                  • Estimation of key figures
                  • Analysis of derived insights

                  Data Validation

                  • Triangulation with data models
                  • Reference against proprietary databases
                  • Corroboration with industry experts

                  REPORT WRITING

                  Qualitative

                  • Market drivers
                  • Market challenges
                  • Market trends
                  • Five forces analysis

                  Quantitative

                  • Market size and forecast
                  • Market segmentation
                  • Geographical insights
                  • Competitive landscape

                  Interested in this report?

                  Get your sample now to see our research methodology and insights!

                  Download Now

                  Frequently Asked Questions

                  Rose Water market growth will increase by $ 230.4 mn during 2025-2029 .

                  The Rose Water market is expected to grow at a CAGR of 10% during 2025-2029 .

                  Rose Water market is segmented by Application( Fragrance and cosmetics, Pharmaceuticals, Food and beverages) Distribution Channel( Indirect sales channel, Direct sales channel) End-user( Individual consumers, Commercial users, North America, Middle East and Africa, South America)

                  A.G. Industries, Aadhunik Ayurveda Vitals, Alteya Inc., Azelis SA, Biosash Business Pvt. Ltd., Dabur India Ltd., Eve Hansen, Givaudan SA, Iran Golab Co., Kannauj Attar, MEENA PERFUMERY, Nutraceutical Corp., Poppy Austin Ltd., Rose of Bulgaria, S A S Jean GAZIGNAIRE, SINGHAI FRAGRANCES, SVA Naturals, Tabib Daru Co., Taj Agro International, ZOFLA LIFE ENTERPRISES are a few of the key vendors in the Rose Water market.

                  Europe will register the highest growth rate of 44% among the other regions. Therefore, the Rose Water market in Europe is expected to garner significant business opportunities for the vendors during the forecast period.

                  US, China, Germany, UK, Japan, India, France, South Korea, Italy, Canada

                  • Growing applications in food and beverage industryThe growing applications of rose water in the food and beverage industry are a significant driver in the global rose water market. Rose water is used as a natural flavoring agent and is known for its pleasant aroma and flavor. It is used in a wide range of food and beverage products is the driving factor this market.
                  • such as cakes is the driving factor this market.
                  • pastries is the driving factor this market.
                  • chocolates is the driving factor this market.
                  • ice cream is the driving factor this market.
                  • and beverages is the driving factor this market.
                  • including tea and alcoholic drinks. One of the primary reasons for the increasing demand for rose water in the food and beverage industry is its ability to enhance the taste and aroma of products without adding any artificial flavor. This natural ingredient is also preferred by consumers who are looking for healthier and natural alternatives in their food and beverage choices.Additionally is the driving factor this market.
                  • the rising consumer interest in exotic and unique flavors is driving the demand for rose water in the food and beverage industry. As a result is the driving factor this market.
                  • manufacturers are continuously developing innovative products such as rose-infused sparkling water is the driving factor this market.
                  • rose-flavored desserts is the driving factor this market.
                  • rose water cocktails and others is the driving factor this market.
                  • that incorporate rose water into their food products. Furthermore is the driving factor this market.
                  • the growing trend of using natural ingredients in food and beverage products is also propelling the demand for rose water in the industry. Consumers are becoming more health-conscious and are seeking out natural and organic products that do not contain harmful chemicals or additives. Rose water is a natural and safe ingredient that meets these criteria. The increasing use of rose water in the food and beverage industry is a significant driver of the global rose water market. As consumers continue to seek out natural and unique flavors in their food and beverages is the driving factor this market.
                  • the demand for rose water is expected to grow in the forecast period. is the driving factor this market.

                  The Rose Water market vendors should focus on grabbing business opportunities from the Fragrance and cosmetics segment as it accounted for the largest market share in the base year.