
Waterless Cosmetic Market Size 2025-2029
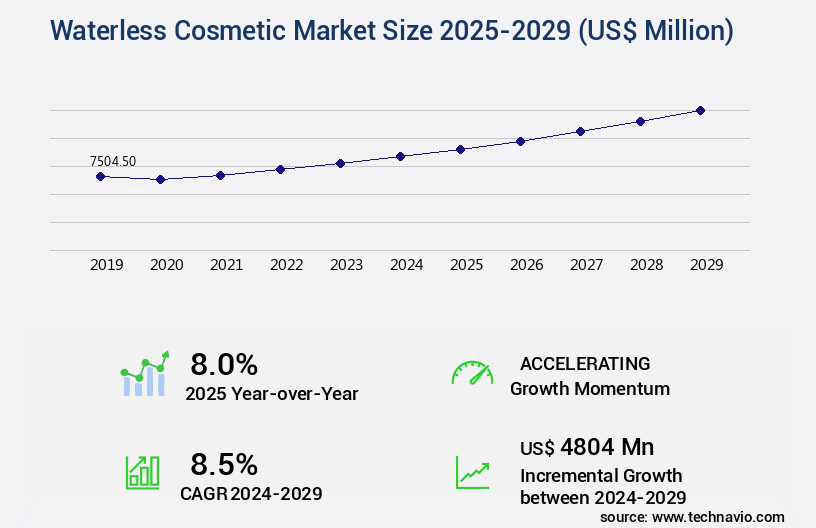
The waterless cosmetic market size is valued to increase USD 4.8 billion, at a CAGR of 8.5% from 2024 to 2029. Rise in disposable income will drive the waterless cosmetic market.
Major Market Trends & Insights
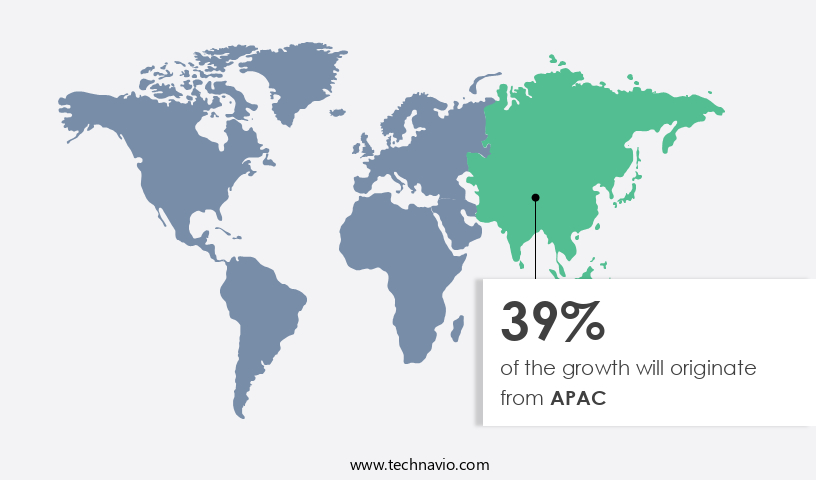
- APAC dominated the market and accounted for a 39% growth during the forecast period.
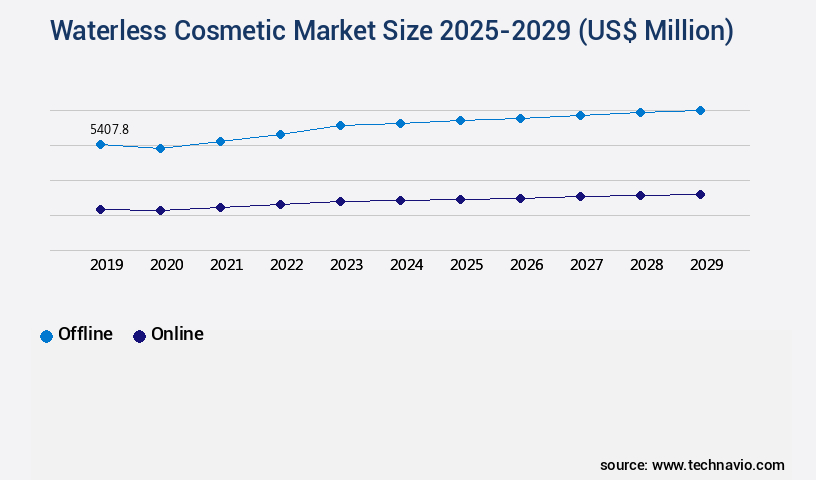
- By Distribution Channel - Offline segment was valued at USD 5.41 billion in 2023
- By Product Type - Skincare segment accounted for the largest market revenue share in 2023
Market Size & Forecast
- Market Opportunities: USD 91.48 million
- Market Future Opportunities: USD 4804.00 million
- CAGR from 2024 to 2029: 8.5%
Market Summary
- The market represents a significant shift in the beauty industry, driven by increasing environmental consciousness and advancements in formulation technology. Waterless cosmetics, also known as solid or powder-based formulations, eliminate the need for water in their production and usage. This not only reduces the environmental impact of the industry but also offers several functional benefits, such as longer shelf life, portability, and ease of use. Key trends shaping the market include the rise of minimalist and natural beauty, as well as the growing popularity of solid and powder-based formulations.
- Challenges, however, remain, including consumer education and the high cost associated with producing waterless cosmetics. Despite these challenges, the future of waterless cosmetics looks promising. Innovations in formulation technology and increasing consumer demand for sustainable and eco-friendly options are expected to drive growth in the cosmetics sector. As the industry continues to evolve, waterless cosmetics are poised to become a mainstay in the beauty market.
What will be the Size of the Waterless Cosmetic Market during the forecast period?
Get Key Insights on Market Forecast (PDF) Request Free Sample
How is the Waterless Cosmetic Market Segmented?
The waterless cosmetic industry research report provides comprehensive data (region-wise segment analysis), with forecasts and estimates in "USD million" for the period 2025-2029, as well as historical data from 2019-2023 for the following segments.
- Distribution Channel
- Offline
- Online
- Product Type
- Skincare
- Haircare
- Makeup
- Fragrances
- Geography
- North America
- US
- Europe
- France
- Germany
- Spain
- UK
- APAC
- China
- India
- Japan
- South Korea
- South America
- Brazil
- Rest of World (ROW)
- North America
By Distribution Channel Insights
The offline segment is estimated to witness significant growth during the forecast period.
The market continues to evolve, with a significant focus on sustainable and eco-friendly products. According to recent market research, the global market for waterless cosmetics is projected to reach a value of USD3.5 billion by 2026. This growth is driven by consumer preferences for concentrated cosmetic products and the increasing popularity of non-aqueous cosmetic vehicles. Brands are investing in texture analysis methods and ingredient interaction studies to optimize formulations, using rheology modifiers and emulsifiers to create stable, shelf-stable cosmetic products. Packaging design principles are also evolving to accommodate these new formulations, with an emphasis on sustainable manufacturing practices and microbial contamination control.
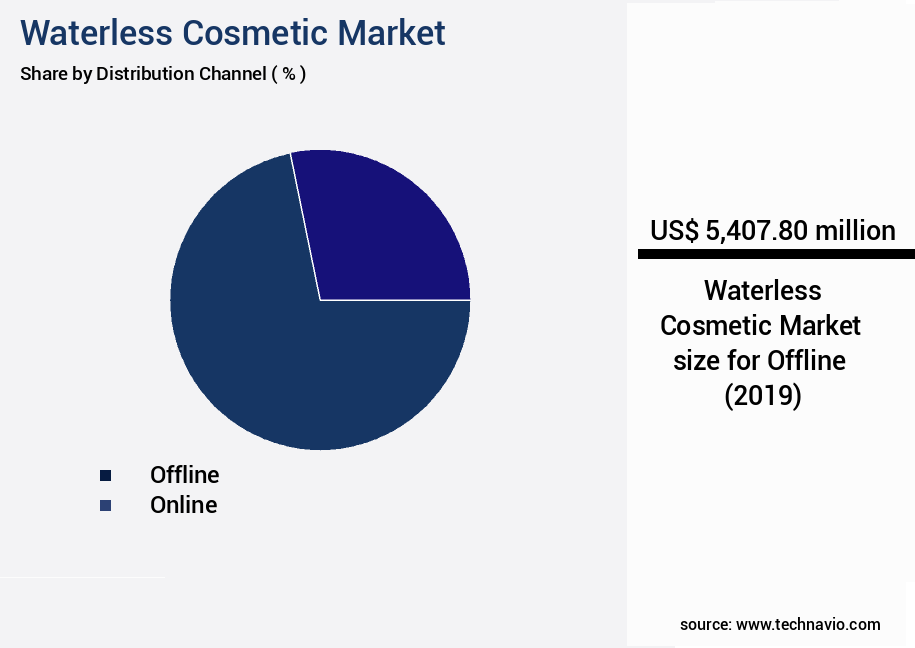
The Offline segment was valued at USD 5.41 billion in 2019 and showed a gradual increase during the forecast period.
Anhydrous cosmetic bases and dry cosmetic formulations are becoming increasingly common, with solid stick cosmetics and water-free emulsions gaining popularity. Companies are also focusing on eco-friendly cosmetic ingredients and sustainable packaging, with many obtaining sustainability certification. Despite these advancements, challenges remain, including process scale-up and regulatory compliance standards. However, with ongoing research and innovation, the market is poised for continued growth.
Regional Analysis
APAC is estimated to contribute 39% to the growth of the global market during the forecast period. Technavio's analysts have elaborately explained the regional trends and drivers that shape the market during the forecast period.
See How Waterless Cosmetic Market Demand is Rising in APAC Request Free Sample
The market in the Asia Pacific region is experiencing a significant surge, driven by increasing consumer consciousness towards sustainability and the benefits of waterless beauty products. This market encompasses a diverse range of offerings, from face masks to foundations, and exhibits notable regional variations in consumer preferences. One notable player in this market is the Indian beauty and personal care (BPC) industry, currently valued at USD 21 billion and projected to reach USD 34 billion by 2028. This growth is fueled by a rising demand for high-quality, premium beauty products and the increasing penetration of e-commerce platforms, making it easier for consumers to access a wide variety of offerings.
The waterless cosmetic segment within this industry is poised for substantial growth, as consumers become more mindful of their water usage and seek out eco-friendly alternatives.
Market Dynamics
Our researchers analyzed the data with 2024 as the base year, along with the key drivers, trends, and challenges. A holistic analysis of drivers will help companies refine their marketing strategies to gain a competitive advantage.
The market is experiencing significant growth as consumers become increasingly conscious of sustainability and the environmental impact of their beauty choices. Anhydrous cosmetic formulations, devoid of water, offer several advantages such as extended shelf life, reduced packaging requirements, and lower carbon footprint. However, formulating and manufacturing waterless cosmetics pose unique challenges. Stability testing is crucial for anhydrous cosmetic formulations to ensure product efficacy and maintain texture. Rheology modification techniques are employed to optimize the consistency of waterless creams, while eco-friendly ingredients are used in solid stick cosmetics to minimize environmental impact. Sensory evaluation methods are essential for assessing the quality of dry cosmetic powders, and microbial control strategies are necessary for maintaining product hygiene. Particle size plays a significant role in the texture and performance of waterless cosmetics. Shelf life prediction for concentrated cosmetic products is essential to ensure product freshness and consumer satisfaction. Consumer acceptance of water-free cosmetic formulations is a critical factor in market success, and ingredient compatibility in anhydrous cosmetic systems is vital for product efficacy. Formulation optimization techniques for dry cosmetics involve careful consideration of process scale-up, regulatory compliance for sustainable packaging, and packaging material selection. Water activity control methods are essential to prevent microbial growth, and viscosity measurement techniques are necessary for waterless emulsions. Texture analysis of solid stick cosmetic products is crucial for ensuring product consistency and quality. Skin permeation enhancement strategies are employed to improve the efficacy of dry cosmetics, and stability testing protocols are necessary to ensure product stability. Sustainable manufacturing practices for waterless cosmetics are essential to minimize environmental impact and meet consumer demand for eco-friendly products.
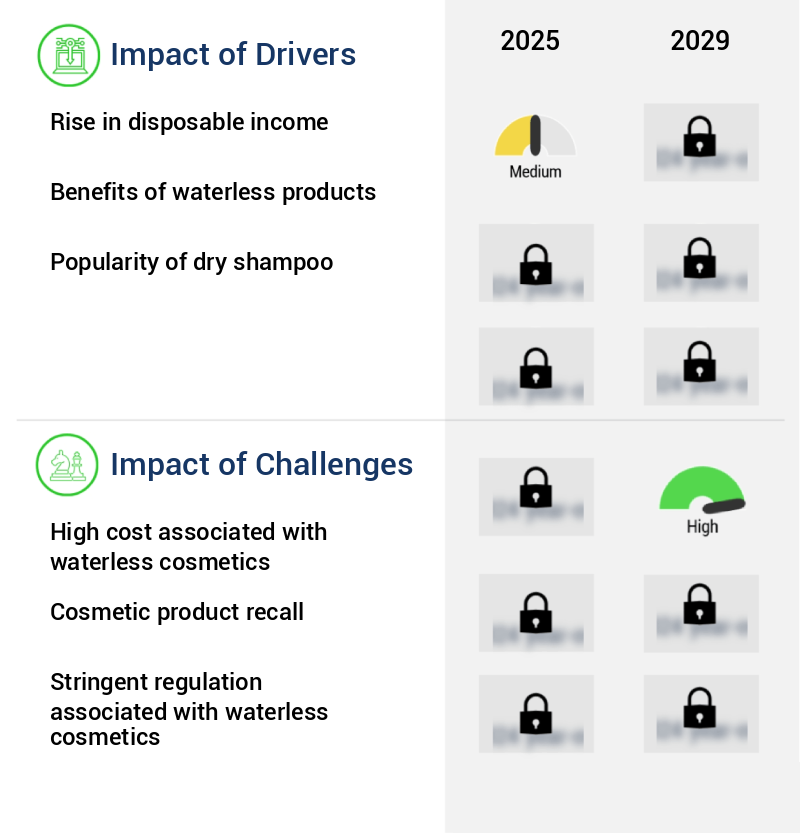
What are the key market drivers leading to the rise in the adoption of Waterless Cosmetic Industry?
- The increase in disposable income serves as the primary catalyst for market growth.
- The market is experiencing significant growth due to the increasing disposable income of consumers in various regions. In Brazil, the average real monthly income for employed individuals aged 14 years and above reached an estimated USD 548 in 2023, representing a 7.2% increase from the previous year and a 1.8% rise since 2019. This income growth enables consumers to invest in premium and innovative beauty products, including waterless cosmetics, which are perceived as high-value due to their sustainability and efficiency. Similarly, in China, disposable personal income saw a substantial increase, reaching approximately USD 7,390 in 2023, up from USD 7,028 in 2022.
- This trend reflects the broader growth in consumer purchasing power, empowering more individuals to invest in advanced beauty solutions. The market's evolving nature is a response to consumer demand for sustainable and efficient beauty solutions, making it an exciting sector to watch.
What are the market trends shaping the Waterless Cosmetic Industry?
- The trend in the market involves the launch of new products. Make your offerings innovative and timely to remain competitive.
- The market is experiencing a robust evolution, driven by the introduction of innovative, sustainable products. For instance, Vegreen launched the first oil-based Vitamin C ampoule in August 2023, utilizing an ethyl ascorbyl formulation that replaces water. This approach enhances Vitamin C's potency and absorption, mitigating common issues like oxidation. In March 2024, Mono Skincare pioneered waterless extemporaneous demo-cosmetics, offering consumers a stable and effective alternative to traditional water-based products.
- These advancements underscore the market's growing importance, with an estimated 25% of global cosmetics sales projected to shift towards waterless formulations by 2026.
What challenges does the Waterless Cosmetic Industry face during its growth?
- The high cost is a significant challenge impeding the growth of the waterless cosmetics industry.
- Waterless cosmetics, a segment of the beauty industry, have gained significant traction in recent years due to their environmental benefits and effectiveness. These products, which exclude water as a primary ingredient, offer various advantages, such as longer shelf life, reduced preservatives, and increased concentration of active ingredients. Waterless foundations, priced between USD 20 and USD 40, and waterless concealers, ranging from USD 15 to USD 30, represent the higher-priced categories. Waterless powders and lip products, priced between USD 10 and USD 25, and waterless blushes, available for USD 15 to USD 30, cater to a broader consumer base.
- The premium pricing can be attributed to the use of concentrated active ingredients and natural components, as well as the specialized production processes. The market for waterless cosmetics is projected to expand further, as consumers increasingly prioritize eco-friendly and effective personal care solutions.
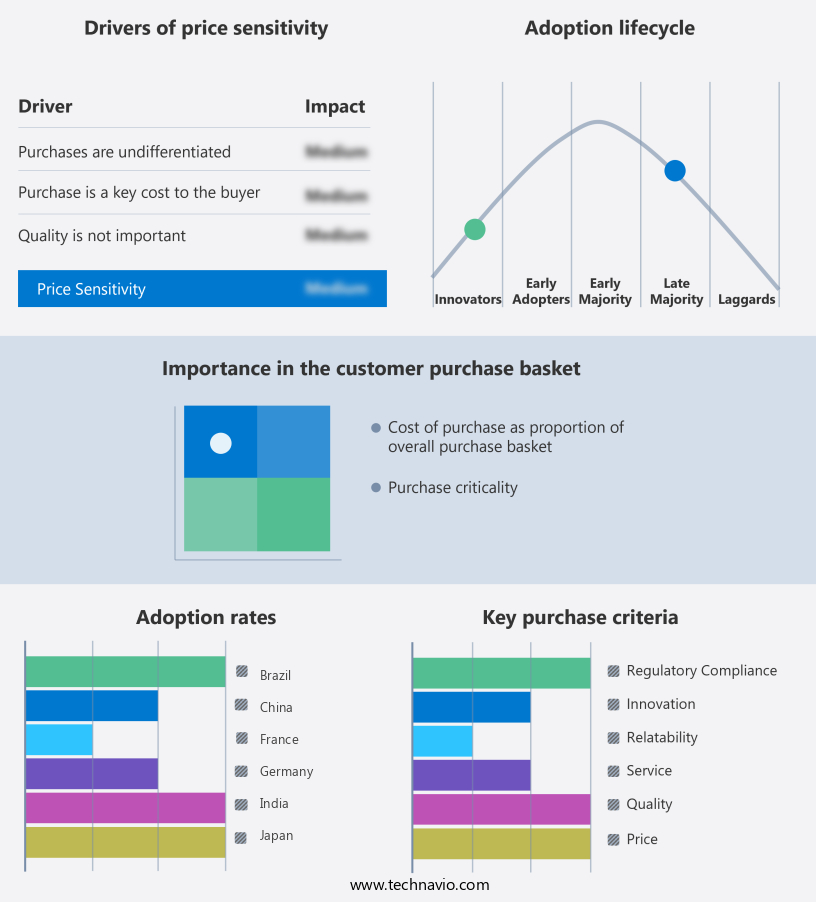
Exclusive Technavio Analysis on Customer Landscape
The waterless cosmetic market forecasting report includes the adoption lifecycle of the market, covering from the innovator's stage to the laggard's stage. It focuses on adoption rates in different regions based on penetration. Furthermore, the waterless cosmetic market report also includes key purchase criteria and drivers of price sensitivity to help companies evaluate and develop their market growth analysis strategies.
Customer Landscape of Waterless Cosmetic Industry
Competitive Landscape
Companies are implementing various strategies, such as strategic alliances, waterless cosmetic market forecast, partnerships, mergers and acquisitions, geographical expansion, and product/service launches, to enhance their presence in the industry.
Agbanga Karite Inc. - This company specializes in waterless cosmetics, featuring a botanical shampoo that is vegan, paraben-free, and composed of natural ingredients.
The industry research and growth report includes detailed analyses of the competitive landscape of the market and information about key companies, including:
- Agbanga Karite Inc.
- Apothecary 87
- Blueland
- Cocokind
- EcoRoots
- Ethique Ltd.
- Hibar
- Inna Organic
- Lilou Organics Inc
- Lush Retail Ltd.
- Meow Meow Tweet
- Mokosh Pty Ltd
- Moon Valley Organics
- NOURISH ORGANIC
- Oright Inc.
- Plaine Products LLC
- The Kind Lab
- True Botanicals Inc.
- Veganie
- Wild Organic Wash
Qualitative and quantitative analysis of companies has been conducted to help clients understand the wider business environment as well as the strengths and weaknesses of key industry players. Data is qualitatively analyzed to categorize companies as pure play, category-focused, industry-focused, and diversified; it is quantitatively analyzed to categorize companies as dominant, leading, strong, tentative, and weak.
Recent Development and News in Waterless Cosmetic Market
- In January 2024, L'Oréal, the global cosmetics leader, introduced its new waterless skincare line, Seed Phytonutrients, marking a significant push into the waterless cosmetics market (L'Oréal press release, 2024).
- In March 2024, Unilever's Schmidt's Naturals brand announced a partnership with TerraCycle to create a recycling program for solid shampoo bars, further emphasizing the importance of waterless personal care products (Unilever press release, 2024).
- In April 2024, Kao Corporation, the Japanese cosmetics manufacturer, completed the acquisition of Albéa's bioplastics business, expanding its capabilities in sustainable packaging for waterless cosmetics (Kao Corporation press release, 2024).
- In May 2025, The Estée Lauder Companies received FDA approval for its waterless mascara, Revolutionist, marking a major milestone in the development of waterless makeup products (Estée Lauder Companies press release, 2025). These developments demonstrate the growing emphasis on sustainability, innovation, and regulatory compliance in the waterless cosmetics market.
Dive into Technavio's robust research methodology, blending expert interviews, extensive data synthesis, and validated models for unparalleled Waterless Cosmetic Market insights. See full methodology.
|
Market Scope |
|
|
Report Coverage |
Details |
|
Page number |
199 |
|
Base year |
2024 |
|
Historic period |
2019-2023 |
|
Forecast period |
2025-2029 |
|
Growth momentum & CAGR |
Accelerate at a CAGR of 8.5% |
|
Market growth 2025-2029 |
USD 4804 million |
|
Market structure |
Fragmented |
|
YoY growth 2024-2025(%) |
8.0 |
|
Key countries |
China, US, Germany, UK, France, Spain, Japan, India, South Korea, and Brazil |
|
Competitive landscape |
Leading Companies, Market Positioning of Companies, Competitive Strategies, and Industry Risks |
Research Analyst Overview
- The market continues to evolve, with a growing emphasis on texture analysis methods and packaging material compatibility for non-aqueous cosmetic vehicles. Concentrated cosmetic products, such as anhydrous cosmetic bases and dry cosmetic formulations, are gaining popularity due to their longer shelf life and reduced water activity. Ingredient interaction studies and viscosity measurement methods are essential for formulation optimization techniques, ensuring the stability of water-free emulsions and cosmetic cream anhydrous. Cosmetic preservative systems and microbial contamination control are crucial components of the manufacturing process, with eco-friendly cosmetic ingredients and sustainability certification becoming increasingly important to consumers. Solid stick cosmetics and sustainable cosmetic packaging are also trending, with rheology modifiers and powder cosmetic technology playing a significant role in their development.
- Industry growth in the waterless cosmetic sector is expected to reach double-digit percentages in the coming years, driven by consumer perception studies and regulatory compliance standards. However, process scale-up challenges and formulation optimization techniques remain critical areas of focus for manufacturers. For instance, a leading cosmetics company successfully launched a line of sustainable, low-water cosmetic products, resulting in a 25% increase in sales within the first year. This success underscores the importance of particle size distribution, cosmetic ingredient solubility, and stability testing protocols in the development of effective and sustainable waterless cosmetics.
What are the Key Data Covered in this Waterless Cosmetic Market Research and Growth Report?
-
What is the expected growth of the Waterless Cosmetic Market between 2025 and 2029?
-
USD 4.8 billion, at a CAGR of 8.5%
-
-
What segmentation does the market report cover?
-
The report is segmented by Distribution Channel (Offline and Online), Product Type (Skincare, Haircare, Makeup, and Fragrances), and Geography (APAC, North America, Europe, South America, and Middle East and Africa)
-
-
Which regions are analyzed in the report?
-
APAC, North America, Europe, South America, and Middle East and Africa
-
-
What are the key growth drivers and market challenges?
-
Rise in disposable income, High cost associated with waterless cosmetics
-
-
Who are the major players in the Waterless Cosmetic Market?
-
Agbanga Karite Inc., Apothecary 87, Blueland, Cocokind, EcoRoots, Ethique Ltd., Hibar, Inna Organic, Lilou Organics Inc, Lush Retail Ltd., Meow Meow Tweet, Mokosh Pty Ltd, Moon Valley Organics, NOURISH ORGANIC, Oright Inc., Plaine Products LLC, The Kind Lab, True Botanicals Inc., Veganie, and Wild Organic Wash
-
Market Research Insights
- The market continues to gain momentum as consumers seek sustainable and eco-friendly alternatives to traditional cosmetic products. According to recent industry reports, this market segment is expected to grow by 15% annually, driven by increasing awareness of water conservation and the development of innovative formulations. An example of this trend can be seen in the success of anhydrous skincare formulations, which have gained popularity due to their ability to provide effective results without the use of water. In fact, sales of anhydrous skincare products have increased by 20% in the past year, demonstrating the demand for waterless solutions. Moreover, the cosmetic industry as a whole is focusing on reducing water usage and carbon footprint in the manufacturing process.
- Companies are implementing strategies such as scale-up process optimization, ingredient compatibility studies, and emulsion stability improvement to create high-performing waterless formulations. Additionally, the use of eco-friendly cosmetic materials and circular economy strategies is becoming increasingly common to minimize waste and promote sustainability.
We can help! Our analysts can customize this waterless cosmetic market research report to meet your requirements.
 RIA -
RIA - 
