Wax Market Analysis, Size, and Forecast 2024-2028: North America (US and Canada), Europe (France, Germany, Italy, and UK), Middle East and Africa (Egypt, KSA, Oman, and UAE), APAC (China, India, and Japan), South America (Argentina and Brazil), and Rest of World (ROW)

Wax Market Analysis, Size, and Forecast 2024-2028:
North America (US and Canada), Europe (France, Germany, Italy, and UK), Middle East and Africa (Egypt, KSA, Oman, and UAE), APAC (China, India, and Japan), South America (Argentina and Brazil), and Rest of World (ROW)

Published: Jul 2024 185 Pages SKU: IRTNTR71206

Market Overview at a Glance

$1.11 B
Market Opportunity
2.09%
CAGR
2.03
YoY growth 2023-2024(%)

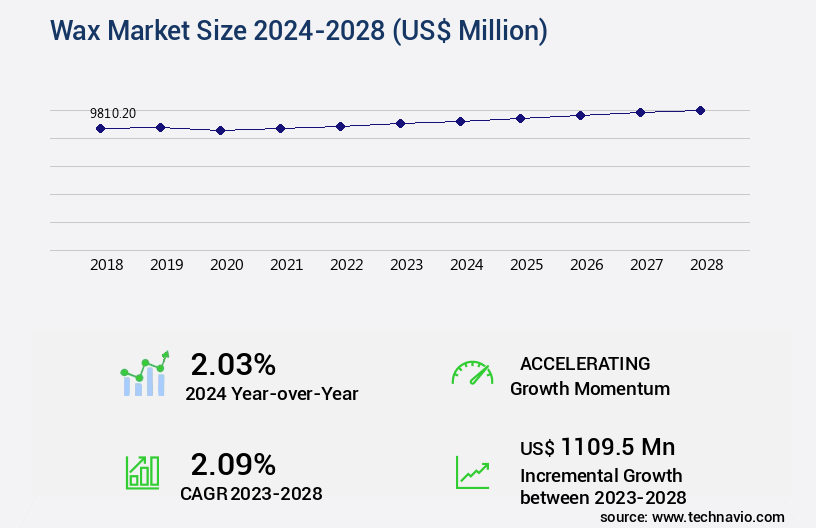
Wax Market Size 2024-2028

The wax market size is forecast to increase by USD 1.11 billion, at a CAGR of 2.09% between 2023 and 2028.

Major Market Trends & Insights

  • APAC dominated the market and accounted for a 40% growth during the forecast period.
  • By the Application - Candle segment was valued at USD 3.43 billion in 2022
  • By the Type - Mineral wax segment accounted for the largest market revenue share in 2022

Market Size & Forecast

  • Market Opportunities: USD 15.25 million
  • Market Future Opportunities: USD 1109.50 million
  • CAGR : 2.09%
  • APAC: Largest market in 2022

Market Summary

  • The market is a dynamic and evolving industry, characterized by continuous growth and innovation. Synthetic and bio-based waxes are increasingly preferred due to their environmental sustainability and cost-effectiveness. According to recent market studies, the global synthetic the market is projected to grow at a steady pace, with a significant increase in demand from the packaging and automotive industries. In contrast, the bio-based the market is experiencing a surge in adoption, particularly in the cosmetics sector, due to its eco-friendly attributes. Recycled plastics are also gaining popularity in wax production, contributing to the reduction of waste and the promotion of circular economy principles.
  • However, price volatility of crude oil, a key raw material for wax production, poses a challenge to market stability. Despite this, the market remains a resilient and adaptive industry, with players continually exploring new applications and technologies to meet the evolving demands of various sectors. 

What will be the Size of the Wax Market during the forecast period?

Wax Market Size

Explore market size, adoption trends, and growth potential for wax market Request Free Sample

  • The market encompasses a diverse range of applications, from agricultural to industrial sectors. In 2020, the global demand for plant-derived waxes was estimated at 1.2 million metric tons, with agricultural waxes accounting for approximately 70% of the total market share. In contrast, industrial waxes represented the remaining 30%, primarily used in various industries such as packaging, cosmetics, and pharmaceuticals. Plant physiology plays a crucial role in the production of waxes, influencing nutrient cycling, grain yield, and quality parameters. Label requirements, carbon footprint, and certification standards are essential considerations in the market, driving the need for sustainable production methods and formulations.
  • For instance, lipid metabolism and protein synthesis are key processes in the biosynthesis of waxes, with biomass accumulation and secondary metabolites significantly impacting product quality. Quality control, gene expression, and storage conditions are essential aspects of wax production, ensuring consistency, shelf life, and environmental impact. Application methods, testing protocols, and sustainability metrics are also critical factors, as the market continues to evolve and adapt to emerging trends and regulations.

How is this Wax Industry segmented?

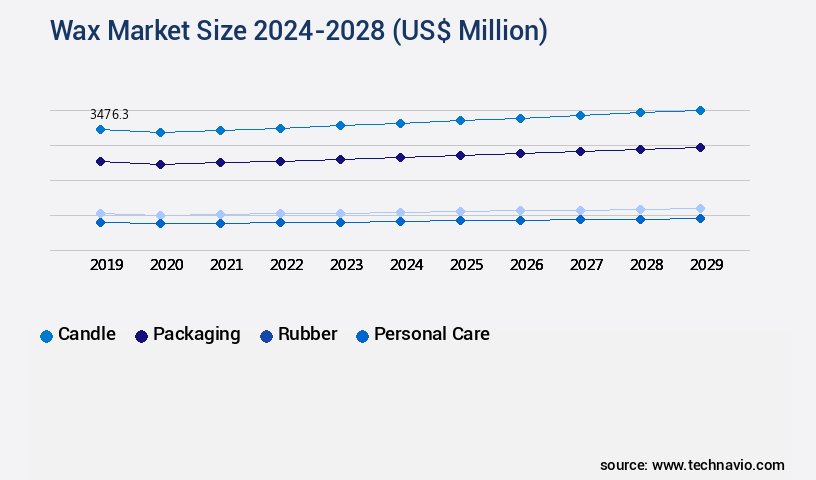
The wax industry research report provides comprehensive data (region-wise segment analysis), with forecasts and estimates in "USD million" for the period 2024-2028, as well as historical data from 2018-2022 for the following segments.

  • Application
    • Candle
    • Packaging
    • Rubber
    • Personal care
    • Others
  • Type
    • Mineral wax
    • Synthetic
    • Natural
  • Form
    • Liquid
    • Solid
    • Emulsion
  • End-use Industry
    • Industrial
    • Consumer Goods
    • Pharmaceutical
    • Automotive
  • Geography
    • North America
      • US
      • Canada
    • Europe
      • France
      • Germany
      • Italy
      • UK
    • Middle East and Africa
      • Egypt
      • KSA
      • Oman
      • UAE
    • APAC
      • China
      • India
      • Japan
    • South America
      • Argentina
      • Brazil
    • Rest of World (ROW)

By Application Insights

The candle segment is estimated to witness significant growth during the forecast period.

The market exhibits remarkable growth, with the candle segment experiencing substantial expansion. Paraffin wax, a dominant player in candle manufacturing, holds a significant market share. This popularity is attributed to the increasing demand for aromatherapy and stress relief through scented candles, which have become a staple in households. Approximately 70% of households use scented candles as home fragrances and for stress management, according to the National Candle Association. Moreover, the market encompasses various types, including beeswax, spermaceti, soy wax, palm, carnauba, bayberry, and tallow. The industry's dynamism is driven by the versatility of these waxes, which cater to diverse applications.

For instance, soy wax is preferred for its biodegradability and eco-friendliness, making it a popular choice for organic farming and sustainable agriculture. Additionally, mineral nutrition, nutrient uptake, and pest control are crucial aspects of the market. Waxes play a significant role in enhancing soil health and improving crop production by facilitating mineral absorption and nutrient uptake. Furthermore, they contribute to pest control by providing a protective barrier around plants, thereby ensuring optimal plant health. The market's future growth is promising, with expectations of continued expansion in sectors such as sustainable agriculture, organic farming, and horticulture. The demand for biostimulants, enzyme activity, and humic acid is on the rise due to their role in improving yield, stress tolerance, and disease resistance.

Furthermore, the market is witnessing increased adoption of microbial inoculants, plant growth regulators, and fungal diseases solutions to address biotic and abiotic stress. The market's growth is also influenced by factors such as salinity tolerance, drought tolerance, antioxidant production, cold tolerance, potassium mobilization, and phosphorus solubilization. These properties enable waxes to enhance plant metabolism, root development, and overall plant health, making them indispensable in modern agriculture. In conclusion, the market's continuous growth is fueled by its diverse applications, including candle manufacturing, sustainable agriculture, and horticulture. The industry's future prospects are bright, with increasing demand for biostimulants, enzyme activity, and other value-added solutions.

Wax Market Size

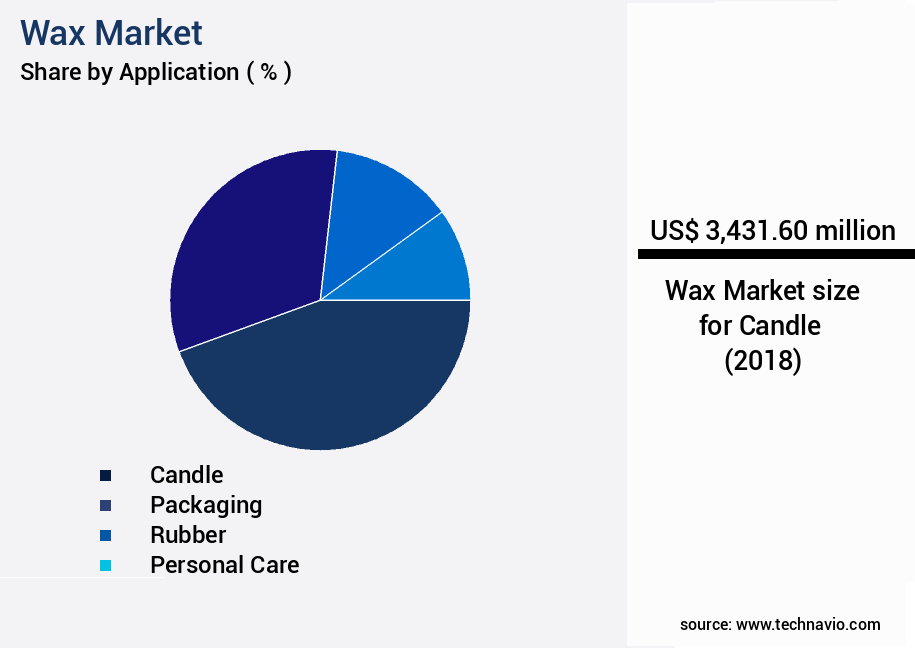
The Candle segment was valued at USD 3.43 billion in 2018 and showed a gradual increase during the forecast period.

Wax Market Size

Request Free Sample

Regional Analysis

APAC is estimated to contribute 40% to the growth of the global market during the forecast period.Technavio's analysts have elaborately explained the regional trends and drivers that shape the market during the forecast period.

Wax Market Share by Geography

See How Wax Market Demand is Rising in APAC Request Free Sample

In The market, China, Malaysia, India, and Indonesia emerge as significant contributors to the industry's consumption. Among these countries, China holds the leading position due to the escalating use of both synthetic and natural waxes. The burgeoning packaging industry, particularly in China and India, has been a primary driver for consumer goods, subsequently fueling the demand for advanced packaging solutions in the Asia Pacific region. Moreover, the production expansion in rubber industries across Malaysia, Indonesia, and other Southeast Asian nations will propel the consumption of wax. P.B. Wax, a widely adopted wax type, is extensively utilized in the rubber sector for internal lubrication and metal surface release.

The Asia Pacific market is expected to witness substantial growth, with an increasing demand for wax in various sectors such as automotive, food, and pharmaceuticals. The automotive industry's continuous expansion, driven by the rising demand for fuel-efficient vehicles, will contribute to the market's growth. Furthermore, the food industry's increasing focus on food preservation and packaging will also boost the market's expansion. In the pharmaceutical sector, waxes are employed in the production of tablets and capsules, making it a crucial component in the pharmaceutical industry's growth. The market's growth is also influenced by the increasing demand for personal care products, which use waxes in their formulation.

In conclusion, the market is witnessing significant growth, with the Asia Pacific region leading the charge. The increasing demand for wax in various sectors, including automotive, food, pharmaceuticals, and personal care, is driving the market's expansion. China and India, in particular, are expected to contribute significantly to the market's growth due to their burgeoning industries and rising demand for advanced packaging solutions.

Market Dynamics

Our researchers analyzed the data with 2023 as the base year, along with the key drivers, trends, and challenges. A holistic analysis of drivers will help companies refine their marketing strategies to gain a competitive advantage.

The market continues to evolve as producers and researchers emphasize biological inputs that enhance crop performance and soil health. The humic acid impact crop yield has become a key area of focus, supported by innovations in plant growth regulators application techniques that optimize plant responses throughout the production cycle. Increasing attention to soil microbial communities influence nutrient uptake and the rhizosphere biology role disease suppression highlights how natural processes can strengthen crop resilience and reduce chemical dependency. Advances in nitrogen fixation enhancing fertilizer efficiency, phosphorus solubilization improving root development, and potassium mobilization promoting stress tolerance are shaping nutrient management strategies that improve both productivity and sustainability.

Physiological improvements are driven by plant hormone modulation improving crop quality, along with studies on enzyme activity improving photosynthesis rates and antioxidant production enhancing disease resistance. Crops are also benefiting from targeted research into abiotic stress tolerance mechanisms plants, including drought tolerance improving water use efficiency, salinity tolerance enhancing crop productivity, heat tolerance improving grain yield, and cold tolerance enhancing plant survival.

Disease and pest control remain critical, with fungal diseases biological control agents, bacterial diseases management strategies, and insect damage integrated pest management being integrated into broader programs. Together, these innovations align with crop production sustainable practices, positioning biostimulants as a core enabler of efficiency, resilience, and profitability in modern agriculture.

Wax Market Size

What are the key market drivers leading to the rise in the adoption of Wax Industry?

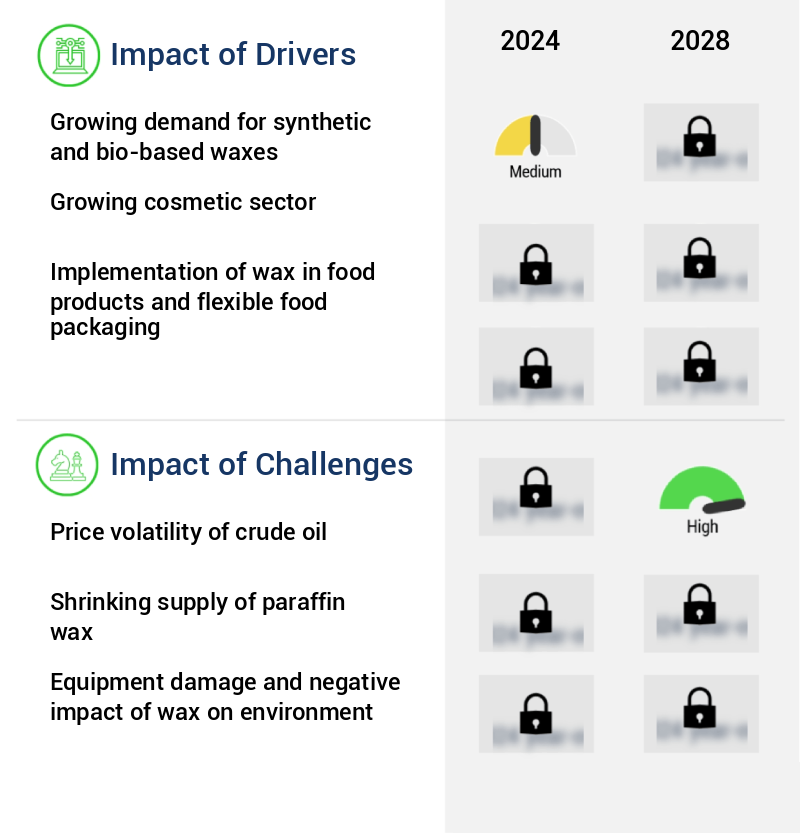
  • The increasing demand for synthetic and bio-based waxes, driven by their superior performance and environmental sustainability, is the primary growth factor for the market. 
  • The market encompasses three main categories: mineral, synthetic, and natural or bio-based waxes. Mineral waxes, derived from crude oil, have traditionally held a significant market share. However, their demand is anticipated to decrease due to several factors. Firstly, the fluctuating prices of crude oil impact the supply of mineral waxes. Secondly, growing environmental concerns, particularly regarding the use of paraffin-based (P.B.) waxes, further reduce their demand. In contrast, synthetic and vegetable waxes are experiencing a surge in popularity. Synthetic waxes, including polyethylene and polypropylene waxes, are increasingly used in industries such as automotive and metal for polishing purposes.
  • Their demand is expected to escalate significantly during the forecast period. Natural or bio-based waxes, derived from renewable resources, are gaining traction due to their eco-friendly nature. These waxes are widely used in the cosmetics and personal care sectors, contributing to their growing demand. The market dynamics are continuously evolving, with new applications and technological advancements shaping the industry landscape. In summary, the market is undergoing significant changes, with synthetic and natural waxes gaining prominence over mineral waxes. The demand for synthetic waxes is driven by their versatility and applications in various industries, while natural waxes benefit from the increasing focus on sustainability and eco-friendly practices.
  • The market's ongoing transformation offers ample opportunities for businesses to innovate and expand their offerings.

What are the market trends shaping the Wax Industry?

  • The use of recycled plastics in wax production is becoming increasingly popular in the market trend. A significant market trend emerges in the wax industry, emphasizing the effective utilization of recycled plastics.
  • Wax, derived from recycled plastics, has emerged as a sustainable alternative to traditional waxes in various industries. Two primary types of wax are manufactured from recycled plastics: a candle wax-like oil and a thick brown wax oil. The former is commonly used in ship engines, while the latter is suitable for shoe polishing and cosmetics. Both types are produced by breaking down the hydrocarbon content in crude oil. The adoption of recycled plastic waxes has gained traction due to their environmental benefits. By recycling plastics, the hazardous effects on the environment are significantly reduced. The market has shown continuous growth as industries increasingly prioritize sustainability.
  • The demand for these eco-friendly alternatives is particularly strong in sectors such as cosmetics, where consumers are increasingly conscious of the environmental impact of their purchases. Compared to traditional waxes, recycled plastic waxes offer several advantages. They are renewable, reducing reliance on non-renewable resources. Additionally, they offer improved performance characteristics, such as better heat resistance and longer burn times for candle wax. Furthermore, the production process of recycled plastic waxes generates fewer greenhouse gas emissions compared to traditional wax production. In conclusion, the market is evolving, with recycled plastic waxes gaining popularity due to their environmental benefits and improved performance characteristics.
  • The use of recycled plastics in wax production offers a sustainable solution, reducing the environmental impact of traditional waxes while offering superior performance.

What challenges does the Wax Industry face during its growth?

  • The price volatility of crude oil poses a significant challenge to the growth of the industry, requiring professionals to closely monitor and adapt to market fluctuations. 
  • Waxes are essential components in various industries, including cosmetics, pharmaceuticals, food, and manufacturing. They are available in different forms, including mineral, synthetic, and natural. Mineral wax is derived from lube-oil refining, which is obtained from crude oil. The price of mineral wax is influenced by the fluctuations in crude oil prices, which can significantly impact the costs of raw materials. In 2020, the COVID-19 pandemic led to a substantial decrease in the demand for oil and gas, resulting in a significant drop in oil prices. Consequently, many oil companies faced revenue declines and had to lower oil prices in the region due to decreased consumer demand from countries like India.
  • This situation affected the production and pricing of mineral wax. Synthetic waxes, on the other hand, are produced from petrochemicals and other raw materials. Their production is less dependent on crude oil prices and can be more stable. Natural waxes, such as beeswax and soy wax, are derived from renewable resources and have gained popularity due to their eco-friendliness. The market is continuously evolving, with new applications and technologies emerging. For instance, the use of waxes in renewable energy, particularly in solar panels, is growing. Additionally, advancements in wax formulation and production techniques are improving the performance and sustainability of waxes in various industries.
  • In terms of market size, The market was valued at approximately USD17.5 billion in 2020 and is projected to reach around USD22.5 billion by 2026, growing at a steady pace during the forecast period. The market's growth is driven by factors such as increasing demand from the cosmetics and pharmaceuticals industries, rising awareness of eco-friendly alternatives, and advancements in wax technology. Despite the challenges posed by the COVID-19 pandemic, the market is expected to recover and continue its growth trajectory. Companies in the wax industry are focusing on innovation, sustainability, and cost-effective production to stay competitive and meet the evolving needs of their customers.

Exclusive Customer Landscape

The wax market forecasting report includes the adoption lifecycle of the market, covering from the innovator's stage to the laggard's stage. It focuses on adoption rates in different regions based on penetration. Furthermore, the wax market report also includes key purchase criteria and drivers of price sensitivity to help companies evaluate and develop their market growth analysis strategies.

Wax Market Share by Geography

 Customer Landscape of Wax Industry

Key Companies & Market Insights

Companies are implementing various strategies, such as strategic alliances, wax market forecast, partnerships, mergers and acquisitions, geographical expansion, and product/service launches, to enhance their presence in the industry.

Archer Daniels Midland Company - This company specializes in providing high-quality waxes and wax emulsions, including Poligen Wax V Flakes, catering to various industries with innovative solutions. Their offerings ensure optimal performance and durability, contributing significantly to the market.

The industry research and growth report includes detailed analyses of the competitive landscape of the market and information about key companies, including:

  • Archer Daniels Midland Company
  • BASF SE
  • Calumet Specialty Products Partners
  • Cargill
  • CEPSA
  • Clariant AG
  • ExxonMobil
  • HollyFrontier Corporation
  • Honeywell International Inc.
  • Indian Oil Corporation
  • Kerax Limited
  • Koster Keunen
  • Lukoil
  • Nippon Seiro Co. Ltd.
  • PetroChina
  • Rosneft
  • Royal Dutch Shell
  • Sasol Limited
  • Strahl & Pitsch Inc.
  • The International Group Inc.

Qualitative and quantitative analysis of companies has been conducted to help clients understand the wider business environment as well as the strengths and weaknesses of key industry players. Data is qualitatively analyzed to categorize companies as pure play, category-focused, industry-focused, and diversified; it is quantitatively analyzed to categorize companies as dominant, leading, strong, tentative, and weak.

Recent Development and News in Wax Market

  • In January 2024, Sasol, a leading integrated energy and chemical company, announced the successful commercialization of its Eco-friendly Paraffin Wax production process at its Secunda Operations in South Africa. This new process reduces greenhouse gas emissions by up to 30% compared to traditional methods (Sasol Press Release, 2024).
  • In March 2024, L'Oréal, the world's largest cosmetics company, entered into a strategic partnership with Renewable Wax Co., a leading producer of renewable waxes. This collaboration aimed to develop sustainable wax solutions for L'Oréal's cosmetic products (L'Oréal Press Release, 2024).
  • In May 2024, INEOS Styrolution, the world's leading styrenics supplier, completed the acquisition of BASF's wax business. This acquisition significantly expanded INEOS Styrolution's product portfolio and market reach (INEOS Styrolution Press Release, 2024).
  • In February 2025, the European Union approved the use of microplastic-free waxes in cosmetic products. This regulatory approval marked a significant milestone in the global shift towards more sustainable and eco-friendly cosmetic products (European Commission Press Release, 2025).

Research Analyst Overview

  • The market encompasses a wide range of applications in agriculture, particularly in enhancing soil health and improving crop productivity. One of the key areas of research and development is the role of enzyme activity and humic acid in phosphorus solubilization. This process is crucial for sustainable agriculture as it increases the availability of this essential nutrient to plants, thereby promoting nutrient uptake and yield improvement. Moreover, the market is witnessing significant advancements in the production of biostimulants, which play a vital role in enhancing plant metabolism, stress tolerance, and disease resistance. For instance, humic acid-based biostimulants have been shown to increase chlorophyll content and improve antioxidant production, contributing to plant health under biotic and abiotic stress conditions.
  • The market's growth is driven by the increasing demand for sustainable farming practices and the need to address the challenges of insect damage, drought tolerance, and cold tolerance. According to a recent industry report, the global biostimulants market is expected to grow at a rate of 11% annually over the next decade. In the realm of sustainable agriculture, microbial inoculants and soil amendments have gained significant attention. These products enhance soil health by promoting beneficial microbial activity, which in turn leads to improved nutrient uptake and crop production. For example, potassium mobilization through mycorrhizal fungi has been shown to increase crop yields by up to 30%.
  • Furthermore, the use of plant growth regulators and bacterial diseases management solutions is becoming increasingly popular in modern agriculture. These products help optimize mineral nutrition and improve root development, ultimately leading to healthier plants and higher yields. In conclusion, the market is a dynamic and evolving landscape, with ongoing research and development focused on enhancing soil health, improving crop productivity, and addressing the challenges of biotic and abiotic stress. The integration of enzyme activity, humic acid, phosphorus solubilization, and various other technologies is driving the market's growth and shaping its future applications in sustainable agriculture.

Dive into Technavio's robust research methodology, blending expert interviews, extensive data synthesis, and validated models for unparalleled Wax Market insights. See full methodology.

Market Scope

Report Coverage

Details

Page number

185

Base year

2023

Historic period

2018-2022

Forecast period

2024-2028

Growth momentum & CAGR

Accelerate at a CAGR of 2.09%

Market growth 2024-2028

USD 1109.5 million

Market structure

Fragmented

YoY growth 2023-2024(%)

2.03

Key countries

US, Canada, Germany, UK, Italy, France, China, India, Japan, Brazil, Egypt, UAE, Oman, Argentina, KSA, UAE, Brazil, and Rest of World (ROW)

Competitive landscape

Leading Companies, Market Positioning of Companies, Competitive Strategies, and Industry Risks

Request Free Sample

What are the Key Data Covered in this Wax Market Research and Growth Report?

  • CAGR of the Wax industry during the forecast period
  • Detailed information on factors that will drive the growth and forecasting between 2024 and 2028
  • Precise estimation of the size of the market and its contribution of the industry in focus to the parent market
  • Accurate predictions about upcoming growth and trends and changes in consumer behaviour
  • Growth of the market across APAC, North America, Europe, South America, and Middle East and Africa
  • Thorough analysis of the market's competitive landscape and detailed information about companies
  • Comprehensive analysis of factors that will challenge the wax market growth of industry companies

We can help! Our analysts can customize this wax market research report to meet your requirements.

Get in touch

1 Executive Summary

  • 1.1 Market overview
    • Executive Summary - Chart on Market Overview
    • Executive Summary - Data Table on Market Overview
    • Executive Summary - Chart on Global Market Characteristics
    • Executive Summary - Chart on Market by Geography
    • Executive Summary - Chart on Market Segmentation by Application
    • Executive Summary - Chart on Market Segmentation by Type
    • Executive Summary - Chart on Incremental Growth
    • Executive Summary - Data Table on Incremental Growth
    • Executive Summary - Chart on Company Market Positioning

2 Market Landscape

  • 2.1 Market ecosystem
    • Parent Market
    • Data Table on - Parent Market
  • 2.2 Market characteristics
    • Market characteristics analysis
  • 2.3 Value chain analysis
    • Value Chain Analysis

3 Market Sizing

  • 3.1 Market definition
    • Offerings of companies included in the market definition
  • 3.2 Market segment analysis
    • Market segments
  • 3.3 Market size 2023
    • 3.4 Market outlook: Forecast for 2023-2028
      • Chart on Global - Market size and forecast 2023-2028 ($ million)
      • Data Table on Global - Market size and forecast 2023-2028 ($ million)
      • Chart on Global Market: Year-over-year growth 2023-2028 (%)
      • Data Table on Global Market: Year-over-year growth 2023-2028 (%)

    4 Historic Market Size

    • 4.1 Global Wax Market 2018 - 2022
      • Historic Market Size - Data Table on Global Wax Market 2018 - 2022 ($ million)
    • 4.2 Application segment analysis 2018 - 2022
      • Historic Market Size - Application Segment 2018 - 2022 ($ million)
    • 4.3 Type segment analysis 2018 - 2022
      • Historic Market Size - Type Segment 2018 - 2022 ($ million)
    • 4.4 Geography segment analysis 2018 - 2022
      • Historic Market Size - Geography Segment 2018 - 2022 ($ million)
    • 4.5 Country segment analysis 2018 - 2022
      • Historic Market Size - Country Segment 2018 - 2022 ($ million)

    5 Five Forces Analysis

    • 5.1 Five forces summary
      • Five forces analysis - Comparison between 2023 and 2028
    • 5.2 Bargaining power of buyers
      • Bargaining power of buyers - Impact of key factors 2023 and 2028
    • 5.3 Bargaining power of suppliers
      • Bargaining power of suppliers - Impact of key factors in 2023 and 2028
    • 5.4 Threat of new entrants
      • Threat of new entrants - Impact of key factors in 2023 and 2028
    • 5.5 Threat of substitutes
      • Threat of substitutes - Impact of key factors in 2023 and 2028
    • 5.6 Threat of rivalry
      • Threat of rivalry - Impact of key factors in 2023 and 2028
    • 5.7 Market condition
      • Chart on Market condition - Five forces 2023 and 2028

    6 Market Segmentation by Application

    • 6.1 Market segments
      • Chart on Application - Market share (2023-2028) (%)
      • Data Table on Application - Market share (2023-2028) (%)
    • 6.2 Comparison by Application
      • Chart on Comparison by Application
      • Data Table on Comparison by Application
    • 6.3 Candle - Market size and forecast (2023-2028)
      • Chart on Candle - Market size and forecast (2023-2028) ($ million)
      • Data Table on Candle - Market size and forecast (2023-2028) ($ million)
      • Chart on Candle - Year-over-year growth (2023-2028) (%)
      • Data Table on Candle - Year-over-year growth (2023-2028) (%)
    • 6.4 Packaging - Market size and forecast (2023-2028)
      • Chart on Packaging - Market size and forecast (2023-2028) ($ million)
      • Data Table on Packaging - Market size and forecast (2023-2028) ($ million)
      • Chart on Packaging - Year-over-year growth (2023-2028) (%)
      • Data Table on Packaging - Year-over-year growth (2023-2028) (%)
    • 6.5 Rubber - Market size and forecast (2023-2028)
      • Chart on Rubber - Market size and forecast (2023-2028) ($ million)
      • Data Table on Rubber - Market size and forecast (2023-2028) ($ million)
      • Chart on Rubber - Year-over-year growth (2023-2028) (%)
      • Data Table on Rubber - Year-over-year growth (2023-2028) (%)
    • 6.6 Personal care - Market size and forecast (2023-2028)
      • Chart on Personal care - Market size and forecast (2023-2028) ($ million)
      • Data Table on Personal care - Market size and forecast (2023-2028) ($ million)
      • Chart on Personal care - Year-over-year growth (2023-2028) (%)
      • Data Table on Personal care - Year-over-year growth (2023-2028) (%)
    • 6.7 Others - Market size and forecast (2023-2028)
      • Chart on Others - Market size and forecast (2023-2028) ($ million)
      • Data Table on Others - Market size and forecast (2023-2028) ($ million)
      • Chart on Others - Year-over-year growth (2023-2028) (%)
      • Data Table on Others - Year-over-year growth (2023-2028) (%)
    • 6.8 Market opportunity by Application
      • Market opportunity by Application ($ million)
      • Data Table on Market opportunity by Application ($ million)

    7 Market Segmentation by Type

    • 7.1 Market segments
      • Chart on Type - Market share (2023-2028) (%)
      • Data Table on Type - Market share (2023-2028) (%)
    • 7.2 Comparison by Type
      • Chart on Comparison by Type
      • Data Table on Comparison by Type
    • 7.3 Mineral wax - Market size and forecast (2023-2028)
      • Chart on Mineral wax - Market size and forecast (2023-2028) ($ million)
      • Data Table on Mineral wax - Market size and forecast (2023-2028) ($ million)
      • Chart on Mineral wax - Year-over-year growth (2023-2028) (%)
      • Data Table on Mineral wax - Year-over-year growth (2023-2028) (%)
    • 7.4 Synthetic - Market size and forecast (2023-2028)
      • Chart on Synthetic - Market size and forecast (2023-2028) ($ million)
      • Data Table on Synthetic - Market size and forecast (2023-2028) ($ million)
      • Chart on Synthetic - Year-over-year growth (2023-2028) (%)
      • Data Table on Synthetic - Year-over-year growth (2023-2028) (%)
    • 7.5 Natural - Market size and forecast (2023-2028)
      • Chart on Natural - Market size and forecast (2023-2028) ($ million)
      • Data Table on Natural - Market size and forecast (2023-2028) ($ million)
      • Chart on Natural - Year-over-year growth (2023-2028) (%)
      • Data Table on Natural - Year-over-year growth (2023-2028) (%)
    • 7.6 Market opportunity by Type
      • Market opportunity by Type ($ million)
      • Data Table on Market opportunity by Type ($ million)

    8 Market Segmentation by Form

    • 8.1 Market segments
      • Chart on Form - Market share (2023-2028) (%)
      • Data Table on Form - Market share (2023-2028) (%)
    • 8.2 Comparison by Form
      • Chart on Comparison by Form
      • Data Table on Comparison by Form
    • 8.3 Liquid - Market size and forecast (2023-2028)
      • Chart on Liquid - Market size and forecast (2023-2028) ($ million)
      • Data Table on Liquid - Market size and forecast (2023-2028) ($ million)
      • Chart on Liquid - Year-over-year growth (2023-2028) (%)
      • Data Table on Liquid - Year-over-year growth (2023-2028) (%)
    • 8.4 Solid - Market size and forecast (2023-2028)
      • Chart on Solid - Market size and forecast (2023-2028) ($ million)
      • Data Table on Solid - Market size and forecast (2023-2028) ($ million)
      • Chart on Solid - Year-over-year growth (2023-2028) (%)
      • Data Table on Solid - Year-over-year growth (2023-2028) (%)
    • 8.5 Emulsion - Market size and forecast (2023-2028)
      • Chart on Emulsion - Market size and forecast (2023-2028) ($ million)
      • Data Table on Emulsion - Market size and forecast (2023-2028) ($ million)
      • Chart on Emulsion - Year-over-year growth (2023-2028) (%)
      • Data Table on Emulsion - Year-over-year growth (2023-2028) (%)
    • 8.6 Market opportunity by Form
      • Market opportunity by Form ($ million)
      • Data Table on Market opportunity by Form ($ million)

    9 Market Segmentation by End-use Industry

    • 9.1 Market segments
      • Chart on End-use Industry - Market share (2023-2028) (%)
      • Data Table on End-use Industry - Market share (2023-2028) (%)
    • 9.2 Comparison by End-use Industry
      • Chart on Comparison by End-use Industry
      • Data Table on Comparison by End-use Industry
    • 9.3 Industrial - Market size and forecast (2023-2028)
      • Chart on Industrial - Market size and forecast (2023-2028) ($ million)
      • Data Table on Industrial - Market size and forecast (2023-2028) ($ million)
      • Chart on Industrial - Year-over-year growth (2023-2028) (%)
      • Data Table on Industrial - Year-over-year growth (2023-2028) (%)
    • 9.4 Consumer Goods - Market size and forecast (2023-2028)
      • Chart on Consumer Goods - Market size and forecast (2023-2028) ($ million)
      • Data Table on Consumer Goods - Market size and forecast (2023-2028) ($ million)
      • Chart on Consumer Goods - Year-over-year growth (2023-2028) (%)
      • Data Table on Consumer Goods - Year-over-year growth (2023-2028) (%)
    • 9.5 Pharmaceutical - Market size and forecast (2023-2028)
      • Chart on Pharmaceutical - Market size and forecast (2023-2028) ($ million)
      • Data Table on Pharmaceutical - Market size and forecast (2023-2028) ($ million)
      • Chart on Pharmaceutical - Year-over-year growth (2023-2028) (%)
      • Data Table on Pharmaceutical - Year-over-year growth (2023-2028) (%)
    • 9.6 Automotive - Market size and forecast (2023-2028)
      • Chart on Automotive - Market size and forecast (2023-2028) ($ million)
      • Data Table on Automotive - Market size and forecast (2023-2028) ($ million)
      • Chart on Automotive - Year-over-year growth (2023-2028) (%)
      • Data Table on Automotive - Year-over-year growth (2023-2028) (%)
    • 9.7 Market opportunity by End-use Industry
      • Market opportunity by End-use Industry ($ million)
      • Data Table on Market opportunity by End-use Industry ($ million)

    10 Customer Landscape

    • 10.1 Customer landscape overview
      • Analysis of price sensitivity, lifecycle, customer purchase basket, adoption rates, and purchase criteria

    11 Geographic Landscape

    • 11.1 Geographic segmentation
      • Chart on Market share by geography 2023-2028 (%)
      • Data Table on Market share by geography 2023-2028 (%)
    • 11.2 Geographic comparison
      • Chart on Geographic comparison
      • Data Table on Geographic comparison
    • 11.3 APAC - Market size and forecast 2023-2028
      • Chart on APAC - Market size and forecast 2023-2028 ($ million)
      • Data Table on APAC - Market size and forecast 2023-2028 ($ million)
      • Chart on APAC - Year-over-year growth 2023-2028 (%)
      • Data Table on APAC - Year-over-year growth 2023-2028 (%)
    • 11.4 North America - Market size and forecast 2023-2028
      • Chart on North America - Market size and forecast 2023-2028 ($ million)
      • Data Table on North America - Market size and forecast 2023-2028 ($ million)
      • Chart on North America - Year-over-year growth 2023-2028 (%)
      • Data Table on North America - Year-over-year growth 2023-2028 (%)
    • 11.5 Europe - Market size and forecast 2023-2028
      • Chart on Europe - Market size and forecast 2023-2028 ($ million)
      • Data Table on Europe - Market size and forecast 2023-2028 ($ million)
      • Chart on Europe - Year-over-year growth 2023-2028 (%)
      • Data Table on Europe - Year-over-year growth 2023-2028 (%)
    • 11.6 South America - Market size and forecast 2023-2028
      • Chart on South America - Market size and forecast 2023-2028 ($ million)
      • Data Table on South America - Market size and forecast 2023-2028 ($ million)
      • Chart on South America - Year-over-year growth 2023-2028 (%)
      • Data Table on South America - Year-over-year growth 2023-2028 (%)
    • 11.7 Middle East and Africa - Market size and forecast 2023-2028
      • Chart on Middle East and Africa - Market size and forecast 2023-2028 ($ million)
      • Data Table on Middle East and Africa - Market size and forecast 2023-2028 ($ million)
      • Chart on Middle East and Africa - Year-over-year growth 2023-2028 (%)
      • Data Table on Middle East and Africa - Year-over-year growth 2023-2028 (%)
    • 11.8 US - Market size and forecast 2023-2028
      • Chart on US - Market size and forecast 2023-2028 ($ million)
      • Data Table on US - Market size and forecast 2023-2028 ($ million)
      • Chart on US - Year-over-year growth 2023-2028 (%)
      • Data Table on US - Year-over-year growth 2023-2028 (%)
    • 11.9 China - Market size and forecast 2023-2028
      • Chart on China - Market size and forecast 2023-2028 ($ million)
      • Data Table on China - Market size and forecast 2023-2028 ($ million)
      • Chart on China - Year-over-year growth 2023-2028 (%)
      • Data Table on China - Year-over-year growth 2023-2028 (%)
    • 11.10 Japan - Market size and forecast 2023-2028
      • Chart on Japan - Market size and forecast 2023-2028 ($ million)
      • Data Table on Japan - Market size and forecast 2023-2028 ($ million)
      • Chart on Japan - Year-over-year growth 2023-2028 (%)
      • Data Table on Japan - Year-over-year growth 2023-2028 (%)
    • 11.11 Germany - Market size and forecast 2023-2028
      • Chart on Germany - Market size and forecast 2023-2028 ($ million)
      • Data Table on Germany - Market size and forecast 2023-2028 ($ million)
      • Chart on Germany - Year-over-year growth 2023-2028 (%)
      • Data Table on Germany - Year-over-year growth 2023-2028 (%)
    • 11.12 Canada - Market size and forecast 2023-2028
      • Chart on Canada - Market size and forecast 2023-2028 ($ million)
      • Data Table on Canada - Market size and forecast 2023-2028 ($ million)
      • Chart on Canada - Year-over-year growth 2023-2028 (%)
      • Data Table on Canada - Year-over-year growth 2023-2028 (%)
    • 11.13 Market opportunity by geography
      • Market opportunity by geography ($ million)
      • Data Tables on Market opportunity by geography ($ million)
    • 11.14 UK - Market size and forecast (2023-2028)
      • Chart on UK - Market size and forecast (2023-2028) ($ million)
      • Data Table on UK - Market size and forecast (2023-2028) ($ million)
      • Chart on UK - Year-over-year growth (2023-2028) (%)
      • Data Table on UK - Year-over-year growth (2023-2028) (%)
    • 11.15 Italy - Market size and forecast (2023-2028)
      • Chart on Italy - Market size and forecast (2023-2028) ($ million)
      • Data Table on Italy - Market size and forecast (2023-2028) ($ million)
      • Chart on Italy - Year-over-year growth (2023-2028) (%)
      • Data Table on Italy - Year-over-year growth (2023-2028) (%)
    • 11.16 France - Market size and forecast (2023-2028)
      • Chart on France - Market size and forecast (2023-2028) ($ million)
      • Data Table on France - Market size and forecast (2023-2028) ($ million)
      • Chart on France - Year-over-year growth (2023-2028) (%)
      • Data Table on France - Year-over-year growth (2023-2028) (%)
    • 11.17 India - Market size and forecast (2023-2028)
      • Chart on India - Market size and forecast (2023-2028) ($ million)
      • Data Table on India - Market size and forecast (2023-2028) ($ million)
      • Chart on India - Year-over-year growth (2023-2028) (%)
      • Data Table on India - Year-over-year growth (2023-2028) (%)
    • 11.18 Brazil - Market size and forecast (2023-2028)
      • Chart on Brazil - Market size and forecast (2023-2028) ($ million)
      • Data Table on Brazil - Market size and forecast (2023-2028) ($ million)
      • Chart on Brazil - Year-over-year growth (2023-2028) (%)
      • Data Table on Brazil - Year-over-year growth (2023-2028) (%)
    • 11.19 Egypt - Market size and forecast (2023-2028)
      • Chart on Egypt - Market size and forecast (2023-2028) ($ million)
      • Data Table on Egypt - Market size and forecast (2023-2028) ($ million)
      • Chart on Egypt - Year-over-year growth (2023-2028) (%)
      • Data Table on Egypt - Year-over-year growth (2023-2028) (%)
    • 11.20 UAE - Market size and forecast (2023-2028)
      • Chart on UAE - Market size and forecast (2023-2028) ($ million)
      • Data Table on UAE - Market size and forecast (2023-2028) ($ million)
      • Chart on UAE - Year-over-year growth (2023-2028) (%)
      • Data Table on UAE - Year-over-year growth (2023-2028) (%)
    • 11.21 Oman - Market size and forecast (2023-2028)
      • Chart on Oman - Market size and forecast (2023-2028) ($ million)
      • Data Table on Oman - Market size and forecast (2023-2028) ($ million)
      • Chart on Oman - Year-over-year growth (2023-2028) (%)
      • Data Table on Oman - Year-over-year growth (2023-2028) (%)
    • 11.22 Argentina - Market size and forecast (2023-2028)
      • Chart on Argentina - Market size and forecast (2023-2028) ($ million)
      • Data Table on Argentina - Market size and forecast (2023-2028) ($ million)
      • Chart on Argentina - Year-over-year growth (2023-2028) (%)
      • Data Table on Argentina - Year-over-year growth (2023-2028) (%)
    • 11.23 KSA - Market size and forecast (2023-2028)
      • Chart on KSA - Market size and forecast (2023-2028) ($ million)
      • Data Table on KSA - Market size and forecast (2023-2028) ($ million)
      • Chart on KSA - Year-over-year growth (2023-2028) (%)
      • Data Table on KSA - Year-over-year growth (2023-2028) (%)
    • 11.24 Rest of World (ROW) - Market size and forecast (2023-2028)
      • Chart on Rest of World (ROW) - Market size and forecast (2023-2028) ($ million)
      • Data Table on Rest of World (ROW) - Market size and forecast (2023-2028) ($ million)
      • Chart on Rest of World (ROW) - Year-over-year growth (2023-2028) (%)
      • Data Table on Rest of World (ROW) - Year-over-year growth (2023-2028) (%)

    12 Drivers, Challenges, and Opportunity/Restraints

    • 12.1 Market drivers
      • 12.2 Market challenges
        • 12.3 Impact of drivers and challenges
          • Impact of drivers and challenges in 2023 and 2028
        • 12.4 Market opportunities/restraints

          13 Competitive Landscape

          • 13.1 Overview
            • 13.2 Competitive Landscape
              • Overview on criticality of inputs and factors of differentiation
            • 13.3 Landscape disruption
              • Overview on factors of disruption
            • 13.4 Industry risks
              • Impact of key risks on business

            14 Competitive Analysis

            • 14.1 Companies profiled
              • Companies covered
            • 14.2 Market positioning of companies
              • Matrix on companies position and classification
            • 14.3 Archer Daniels Midland Company
              • Archer Daniels Midland Company - Overview
              • Archer Daniels Midland Company - Product / Service
              • Archer Daniels Midland Company - Key offerings
            • 14.4 BASF SE
              • BASF SE - Overview
              • BASF SE - Product / Service
              • BASF SE - Key offerings
            • 14.5 Calumet Specialty Products Partners
              • Calumet Specialty Products Partners - Overview
              • Calumet Specialty Products Partners - Product / Service
              • Calumet Specialty Products Partners - Key offerings
            • 14.6 Cargill
              • Cargill - Overview
              • Cargill - Product / Service
              • Cargill - Key offerings
            • 14.7 CEPSA
              • CEPSA - Overview
              • CEPSA - Product / Service
              • CEPSA - Key offerings
            • 14.8 Clariant AG
              • Clariant AG - Overview
              • Clariant AG - Product / Service
              • Clariant AG - Key offerings
            • 14.9 ExxonMobil
              • ExxonMobil - Overview
              • ExxonMobil - Product / Service
              • ExxonMobil - Key offerings
            • 14.10 HollyFrontier Corporation
              • HollyFrontier Corporation - Overview
              • HollyFrontier Corporation - Product / Service
              • HollyFrontier Corporation - Key offerings
            • 14.11 Honeywell International Inc.
              • Honeywell International Inc. - Overview
              • Honeywell International Inc. - Product / Service
              • Honeywell International Inc. - Key offerings
            • 14.12 Indian Oil Corporation
              • Indian Oil Corporation - Overview
              • Indian Oil Corporation - Product / Service
              • Indian Oil Corporation - Key offerings
            • 14.13 Kerax Limited
              • Kerax Limited - Overview
              • Kerax Limited - Product / Service
              • Kerax Limited - Key offerings
            • 14.14 Koster Keunen
              • Koster Keunen - Overview
              • Koster Keunen - Product / Service
              • Koster Keunen - Key offerings
            • 14.15 Lukoil
              • Lukoil - Overview
              • Lukoil - Product / Service
              • Lukoil - Key offerings
            • 14.16 Nippon Seiro Co. Ltd.
              • Nippon Seiro Co. Ltd. - Overview
              • Nippon Seiro Co. Ltd. - Product / Service
              • Nippon Seiro Co. Ltd. - Key offerings
            • 14.17 PetroChina
              • PetroChina - Overview
              • PetroChina - Product / Service
              • PetroChina - Key offerings
            • 14.18 Rosneft
              • Rosneft - Overview
              • Rosneft - Product / Service
              • Rosneft - Key offerings
            • 14.19 Royal Dutch Shell
              • Royal Dutch Shell - Overview
              • Royal Dutch Shell - Product / Service
              • Royal Dutch Shell - Key offerings
            • 14.20 Sasol Limited
              • Sasol Limited - Overview
              • Sasol Limited - Product / Service
              • Sasol Limited - Key offerings
            • 14.21 Strahl & Pitsch Inc.
              • Strahl & Pitsch Inc. - Overview
              • Strahl & Pitsch Inc. - Product / Service
              • Strahl & Pitsch Inc. - Key offerings
            • 14.22 The International Group Inc.
              • The International Group Inc. - Overview
              • The International Group Inc. - Product / Service
              • The International Group Inc. - Key offerings
            • 14.23 ExxonMobil
              • ExxonMobil - Overview
              • ExxonMobil - Product / Service
              • ExxonMobil - Key offerings
            • 14.24 Royal Dutch Shell
              • Royal Dutch Shell - Overview
              • Royal Dutch Shell - Product / Service
              • Royal Dutch Shell - Key offerings
            • 14.25 Sasol Limited
              • Sasol Limited - Overview
              • Sasol Limited - Product / Service
              • Sasol Limited - Key offerings
            • 14.26 The International Group Inc.
              • The International Group Inc. - Overview
              • The International Group Inc. - Product / Service
              • The International Group Inc. - Key offerings
            • 14.27 PetroChina
              • PetroChina - Overview
              • PetroChina - Product / Service
              • PetroChina - Key offerings
            • 14.28 HollyFrontier Corporation
              • HollyFrontier Corporation - Overview
              • HollyFrontier Corporation - Product / Service
              • HollyFrontier Corporation - Key offerings
            • 14.29 Calumet Specialty Products Partners
              • Calumet Specialty Products Partners - Overview
              • Calumet Specialty Products Partners - Product / Service
              • Calumet Specialty Products Partners - Key offerings
            • 14.30 Indian Oil Corporation
              • Indian Oil Corporation - Overview
              • Indian Oil Corporation - Product / Service
              • Indian Oil Corporation - Key offerings
            • 14.31 CEPSA
              • CEPSA - Overview
              • CEPSA - Product / Service
              • CEPSA - Key offerings
            • 14.32 Nippon Seiro Co. Ltd.
              • Nippon Seiro Co. Ltd. - Overview
              • Nippon Seiro Co. Ltd. - Product / Service
              • Nippon Seiro Co. Ltd. - Key offerings
            • 14.33 Lukoil
              • Lukoil - Overview
              • Lukoil - Product / Service
              • Lukoil - Key offerings
            • 14.34 Rosneft
              • Rosneft - Overview
              • Rosneft - Product / Service
              • Rosneft - Key offerings
            • 14.35 Honeywell International Inc.
              • Honeywell International Inc. - Overview
              • Honeywell International Inc. - Product / Service
              • Honeywell International Inc. - Key offerings
            • 14.36 Koster Keunen
              • Koster Keunen - Overview
              • Koster Keunen - Product / Service
              • Koster Keunen - Key offerings
            • 14.37 Kerax Limited
              • Kerax Limited - Overview
              • Kerax Limited - Product / Service
              • Kerax Limited - Key offerings
            • 14.38 Strahl & Pitsch Inc.
              • Strahl & Pitsch Inc. - Overview
              • Strahl & Pitsch Inc. - Product / Service
              • Strahl & Pitsch Inc. - Key offerings
            • 14.39 Cargill
              • Cargill - Overview
              • Cargill - Product / Service
              • Cargill - Key offerings
            • 14.40 Archer Daniels Midland Company
              • Archer Daniels Midland Company - Overview
              • Archer Daniels Midland Company - Product / Service
              • Archer Daniels Midland Company - Key offerings
            • 14.41 BASF SE
              • BASF SE - Overview
              • BASF SE - Product / Service
              • BASF SE - Key offerings
            • 14.42 Clariant AG
              • Clariant AG - Overview
              • Clariant AG - Product / Service
              • Clariant AG - Key offerings

            15 Appendix

            • 15.1 Scope of the report
              • 15.2 Inclusions and exclusions checklist
                • Inclusions checklist
                • Exclusions checklist
              • 15.3 Currency conversion rates for US$
                • Currency conversion rates for US$
              • 15.4 Research methodology
                • Research methodology
              • 15.5 Data procurement
                • Information sources
              • 15.6 Data validation
                • Data validation
              • 15.7 Validation techniques employed for market sizing
                • Validation techniques employed for market sizing
              • 15.8 Data synthesis
                • Data synthesis
              • 15.9 360 degree market analysis
                • 360 degree market analysis
              • 15.10 List of abbreviations
                • List of abbreviations

              Research Methodology

              Technavio presents a detailed picture of the market by way of study, synthesis, and summation of data from multiple sources. The analysts have presented the various facets of the market with a particular focus on identifying the key industry influencers. The data thus presented is comprehensive, reliable, and the result of extensive research, both primary and secondary.

              INFORMATION SOURCES

              Primary sources

              • Manufacturers and suppliers
              • Channel partners
              • Industry experts
              • Strategic decision makers

              Secondary sources

              • Industry journals and periodicals
              • Government data
              • Financial reports of key industry players
              • Historical data
              • Press releases

              DATA ANALYSIS

              Data Synthesis

              • Collation of data
              • Estimation of key figures
              • Analysis of derived insights

              Data Validation

              • Triangulation with data models
              • Reference against proprietary databases
              • Corroboration with industry experts

              REPORT WRITING

              Qualitative

              • Market drivers
              • Market challenges
              • Market trends
              • Five forces analysis

              Quantitative

              • Market size and forecast
              • Market segmentation
              • Geographical insights
              • Competitive landscape

              Interested in this report?

              Get your sample now to see our research methodology and insights!

              Download Now

              Frequently Asked Questions

              Wax market growth will increase by $ 1109.5 mn during 2024-2028.

              The Wax market is expected to grow at a CAGR of 2.09% during 2024-2028.

              Wax market is segmented by Application( Candle, Packaging, Rubber, Personal care, Others) Type( Mineral wax, Synthetic, Natural, Personal care, Others)

              Archer Daniels Midland Company, BASF SE, Calumet Specialty Products Partners, Cargill, CEPSA, Clariant AG, ExxonMobil, HollyFrontier Corporation, Honeywell International Inc., Indian Oil Corporation, Kerax Limited, Koster Keunen, Lukoil, Nippon Seiro Co. Ltd., PetroChina, Rosneft, Royal Dutch Shell, Sasol Limited, Strahl & Pitsch Inc., The International Group Inc. are a few of the key vendors in the Wax market.

              APAC will register the highest growth rate of 40% among the other regions. Therefore, the Wax market in APAC is expected to garner significant business opportunities for the vendors during the forecast period.

              US, Canada, Germany, UK, Italy, France, China, India, Japan, Brazil, Egypt, UAE, Oman, Argentina, KSA, UAE, Brazil, Rest of World (ROW)

              • Growing demand for synthetic and bio-based waxesIn terms of product is the driving factor this market.
              • the global wax market has been segmented into mineral is the driving factor this market.
              • synthetic is the driving factor this market.
              • and natural or bio-based wax. Also is the driving factor this market.
              • a decline in the supply of mineral waxes is expected to affect their demand during the forecast period. Fluctuating crude oil prices and increasing environmental concerns pertaining to the use of P.B. waxes are attributable to the declining supply of mineral wax in the market. However is the driving factor this market.
              • synthetic and vegetable waxes are gaining traction is the driving factor this market.
              • and their demand is expected to increase significantly during the forecast period. Synthetic waxes is the driving factor this market.
              • such as polyethylene and polypropylene waxes is the driving factor this market.
              • are commonly used in the automotive and metal industries as polishing waxes. Similarly is the driving factor this market.
              • vegetable waxes such as bayberry is the driving factor this market.
              • Myrica faya is the driving factor this market.
              • candelilla wax is the driving factor this market.
              • carnauba wax is the driving factor this market.
              • and others are used in manufacturing candles and in the cosmetic industry. The increase in the supply of hydrogenated vegetable waxes and F.T. wax will drive the demand for vegetable waxes during the forecast period. Moreover is the driving factor this market.
              • the increasing consumer preference for eco-friendly products will fuel the growth of vegetable waxes is the driving factor this market.
              • which is the driving factor this market.
              • in turn is the driving factor this market.
              • will drive the growth of the global wax market. Thus is the driving factor this market.
              • the growing demand for synthetic and bio-based waxes will drive the global wax market during the forecast period. is the driving factor this market.

              The Wax market vendors should focus on grabbing business opportunities from the Candle segment as it accounted for the largest market share in the base year.