
Web 3.0 Blockchain Market Size 2025-2029
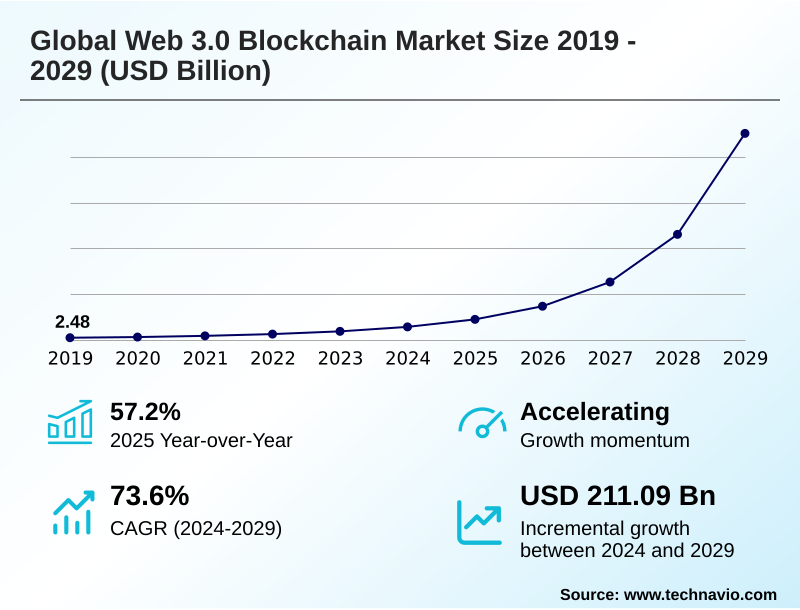
The web 3.0 blockchain market size is valued to increase by USD 211.09 billion, at a CAGR of 73.6% from 2024 to 2029. Institutionalization of real-world asset tokenization will drive the web 3.0 blockchain market.
Major Market Trends & Insights
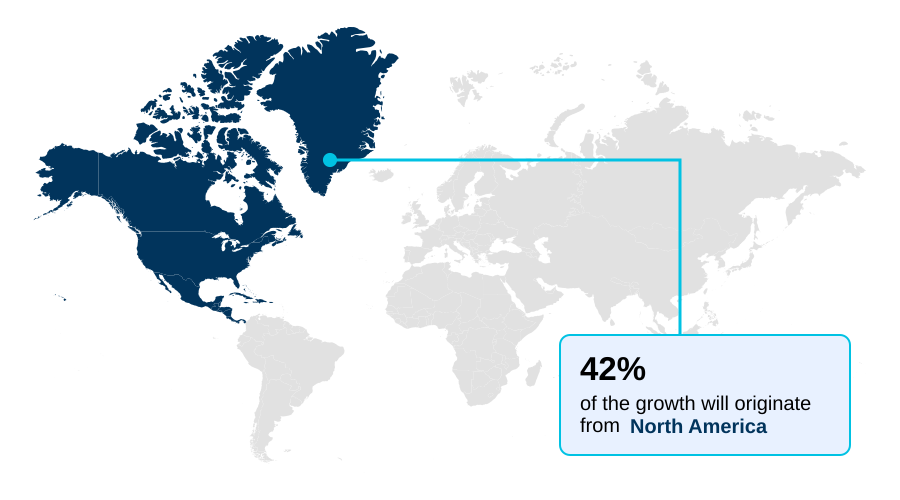
- North America dominated the market and accounted for a 42.2% growth during the forecast period.
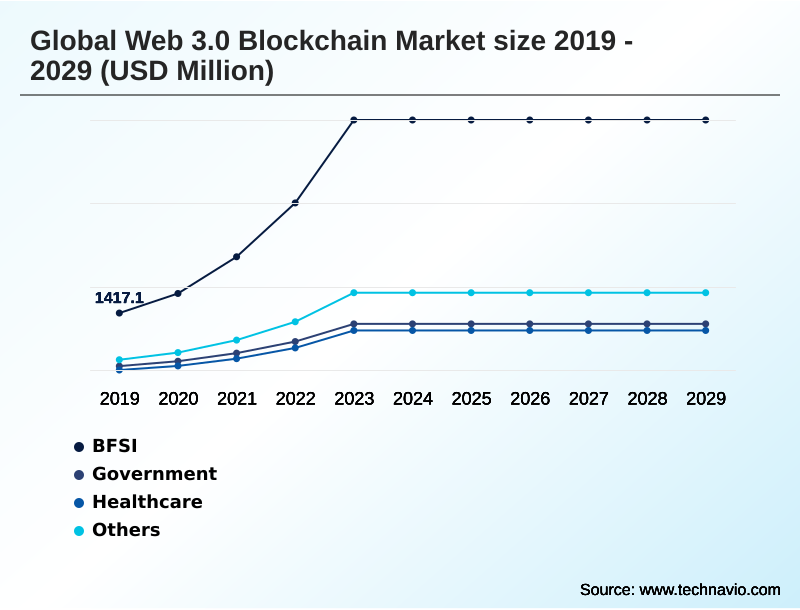
- By End-user - BFSI segment was valued at USD 5.34 billion in 2023
- By Application - Cryptocurrency trading and investment segment accounted for the largest market revenue share in 2023
Market Size & Forecast
- Market Opportunities: USD 222.92 billion
- Market Future Opportunities: USD 211.09 billion
- CAGR from 2024 to 2029 : 73.6%
Market Summary
- The web 3.0 blockchain market is transitioning from a speculative phase to one defined by foundational infrastructure development and practical applications. This evolution is propelled by innovations in decentralized physical infrastructure networks (DePIN) and the increasing institutional adoption of real-world asset (RWA) tokenization.
- Core technologies such as layer 2 scaling solutions, cross-chain interoperability protocols, and zero-knowledge (ZK) proofs are addressing previous limitations in scalability and privacy. However, the landscape is constrained by significant regulatory fragmentation, creating compliance challenges that can stifle innovation.
- In a practical business scenario, a logistics company can utilize a permissionless blockchain to create an immutable record of its supply chain. By using smart contract automation, payments to suppliers are automatically triggered upon delivery confirmation, while data NFTs grant selective access to shipment data for auditors, enhancing transparency and operational efficiency without compromising sensitive information.
- This shift toward utility-first applications, including decentralized autonomous organizations (DAOs) and on-chain identity management, underscores the market's maturation into a robust, user-centric digital economy.
What will be the Size of the Web 3.0 Blockchain Market during the forecast period?
Get Key Insights on Market Forecast (PDF) Get Free Sample
How is the Web 3.0 Blockchain Market Segmented?
The web 3.0 blockchain industry research report provides comprehensive data (region-wise segment analysis), with forecasts and estimates in "USD million" for the period 2025-2029, as well as historical data from 2019-2023 for the following segments.
- End-user
- BFSI
- Government
- Healthcare
- Others
- Application
- Cryptocurrency trading and investment
- Payments and smart contracts infrastructure
- Data and transaction storage
- Conversational AI
- Others
- Type
- Public
- Private
- Consortium
- Hybrid
- Geography
- North America
- US
- Canada
- Mexico
- Europe
- Germany
- UK
- France
- APAC
- China
- Japan
- India
- South America
- Brazil
- Argentina
- Colombia
- Middle East and Africa
- Saudi Arabia
- UAE
- South Africa
- Rest of World (ROW)
- North America
By End-user Insights
The bfsi segment is estimated to witness significant growth during the forecast period.
The BFSI sector's adoption of Web 3.0 blockchain is driven by the demand for enhanced efficiency and security. This includes the application of real-world asset (RWA) tokenization for securities and the use of decentralized finance (DeFi) for novel credit services.
Financial institutions are leveraging smart contract automation for peer-to-peer (P2P) transactions and on-chain solutions for trade settlement, achieving over 90% reduction in processing times.
The integration of permissionless access protocols and robust digital asset custody frameworks are central to this transformation.
These advancements support a more user-centric digital economy, where institutional-grade custody and advanced digital asset risk management are paramount, moving beyond simple fiat-to-crypto trading toward sophisticated prime brokerage services.
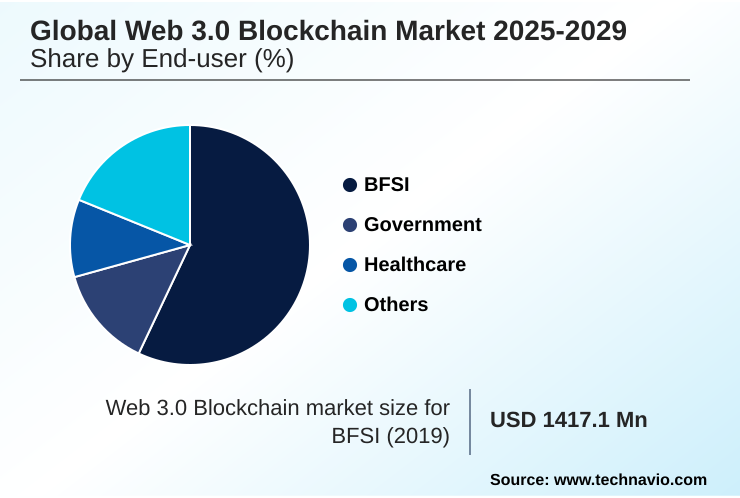
The BFSI segment was valued at USD 5.34 billion in 2023 and showed a gradual increase during the forecast period.
Regional Analysis
North America is estimated to contribute 42.2% to the growth of the global market during the forecast period.Technavio’s analysts have elaborately explained the regional trends and drivers that shape the market during the forecast period.
See How Web 3.0 Blockchain Market Demand is Rising in North America Get Free Sample
The geographic landscape of the Web 3.0 blockchain market is led by North America, which accounts for over 42% of the incremental growth, driven by deep venture capital pools and strong institutional adoption in the US.
This region is a hub for developing layer 2 scaling solutions and advanced blockchain APIs. In Europe, the implementation of comprehensive crypto-asset oversight frameworks is creating a structured, albeit complex, compliance environment.
Meanwhile, the APAC region exhibits a diverse approach, with some nations fostering innovation in decentralized autonomous organizations (DAOs) and scalable proof-of-work (PoW) systems.
The development of geographically distributed infrastructure remains a global priority, with protocol-level software and node infrastructure evolving to meet varied regional demands.
The emphasis on on-chain identity management is also growing worldwide, reflecting a collective move toward creating a more secure and interoperable digital ecosystem.
Market Dynamics
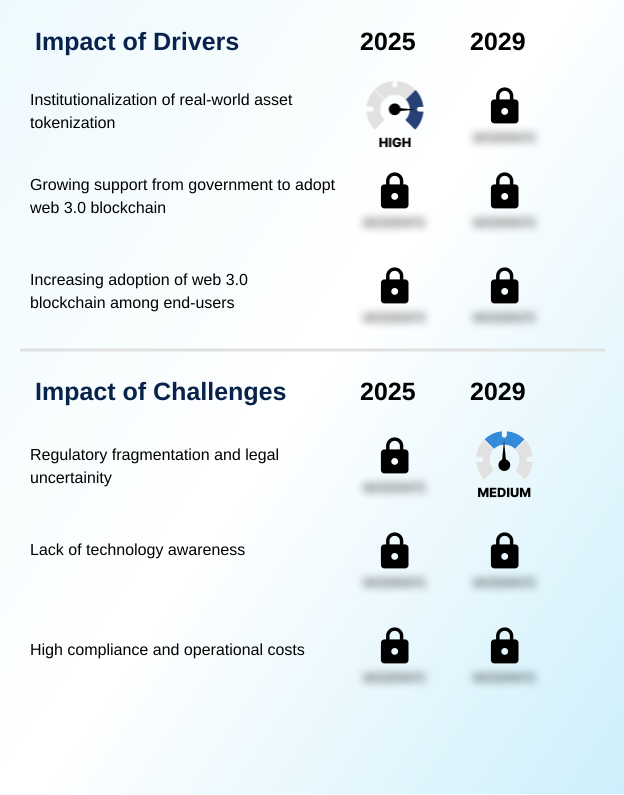
Our researchers analyzed the data with 2024 as the base year, along with the key drivers, trends, and challenges. A holistic analysis of drivers will help companies refine their marketing strategies to gain a competitive advantage.
- The maturation of the Web 3.0 blockchain ecosystem is increasingly defined by the practical implementation of sophisticated technologies. Strategic focus is shifting toward building scalable decentralized applications that solve real-world problems. The development of institutional adoption of digital assets is a key factor, with a growing number of firms exploring tokenizing private equity funds to enhance liquidity.
- This trend is supported by robust smart contract audit and security protocols, ensuring assets are managed securely on-chain. Concurrently, decentralized AI model training is emerging as a novel use case, leveraging distributed computing resources. The security of decentralized storage is paramount for enterprise data solutions, while on-chain identity verification systems address critical compliance needs.
- In the background, DAO governance models and voting mechanisms are being refined to improve decentralized decision-making. The development of stablecoin payment and settlement systems is proving to be more than twice as efficient as legacy financial rails for cross-border transactions. Further innovation is seen in NFT marketplace development tools and the application of zero-knowledge proofs in blockchain for privacy.
- Finally, ensuring interoperability between public blockchains and advancing blockchain for supply chain traceability remain critical for creating a seamless, interconnected digital economy. This is complemented by the growth of utility tokens for physical infrastructure and advancements in cross-chain communication protocols.
What are the key market drivers leading to the rise in the adoption of Web 3.0 Blockchain Industry?
- The institutionalization of real-world asset tokenization is emerging as a key driver for market growth.
- A significant driver is the institutional push toward tokenized US Treasuries and private credit tokenization. These on-chain assets provide stable, yield-bearing instruments that reduce portfolio volatility, with adoption in institutional treasury management growing by over 200% in the last year.
- This movement is powered by advancements in zero-knowledge (ZK) proofs and modular chain frameworks, which ensure both privacy and regulatory compliance. The proliferation of decentralized exchanges (DEX) and crypto staking services offers new avenues for liquidity and yield generation.
- Concurrently, the availability of dedicated blockchain accelerator chips and secure hardware modules is improving network performance and security.
- These cryptographic accelerators and edge computing solutions enable faster transaction processing, with some networks demonstrating a 50% increase in throughput without compromising decentralization.
What are the market trends shaping the Web 3.0 Blockchain Industry?
- The growth of decentralized physical infrastructure networks represents a significant upcoming market trend. This model is reshaping the deployment, management, and ownership of physical hardware resources.
- A primary trend shaping the market is the expansion of decentralized physical infrastructure networks (DePIN), which leverage tokenization platforms to bootstrap real-world hardware resources. This model, supported by smart wallets and multi-chain APIs, allows for the creation of decentralized service networks that offer competitive alternatives to centralized providers, reducing infrastructure deployment costs by up to 40%.
- The use of non-fungible tokens (NFTs) is evolving beyond collectibles into utility-focused applications, such as representing ownership in these networks. The development of sophisticated AI-integrated loyalty systems and rollup engines is enhancing user engagement and network efficiency.
- Furthermore, compute-to-data frameworks are enabling secure data analysis, with some platforms improving data processing speeds by 25% while maintaining privacy through censorship-resistant infrastructure and tokenized data networks.
What challenges does the Web 3.0 Blockchain Industry face during its growth?
- Regulatory fragmentation and legal uncertainty present a key challenge affecting industry growth.
- A key challenge remains the operational complexity and security risks inherent in decentralized systems. Despite robust distributed consensus mechanisms and cryptographic security protocols, vulnerabilities in decentralized applications (dApps) can lead to significant losses, with smart contract exploits accounting for over 90% of all value stolen from platforms.
- The management of decentralized data storage and data NFTs requires sophisticated tooling and expertise, which presents a barrier to entry for many enterprises. The development of tokenized AI models introduces new threat vectors related to data poisoning and model integrity.
- Furthermore, navigating the landscape of digital asset discovery and utilizing tools like token unlock trackers and crypto research tools effectively demands specialized knowledge, hindering broader mainstream adoption and increasing reliance on expert-led virtual trading labs.
Exclusive Technavio Analysis on Customer Landscape
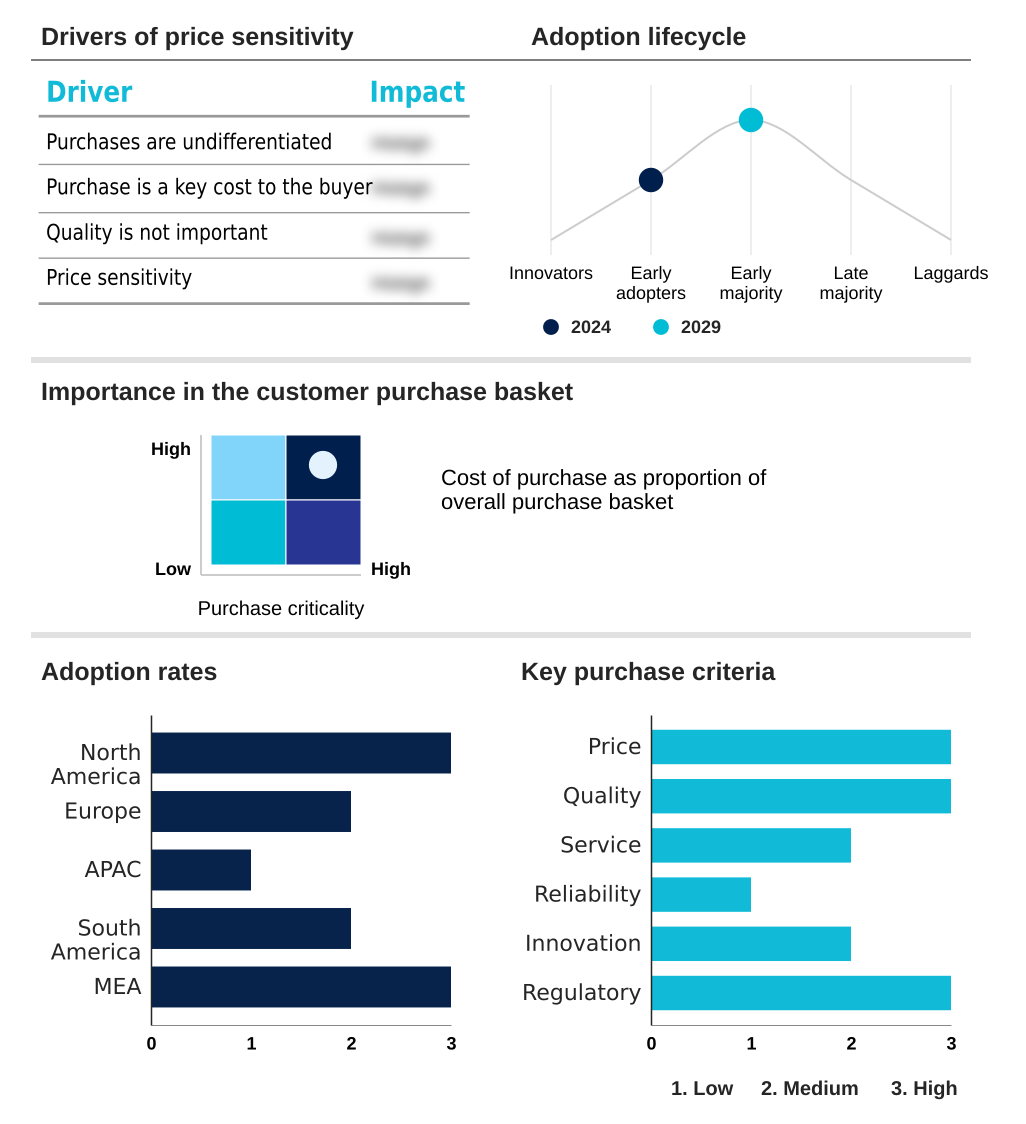
The web 3.0 blockchain market forecasting report includes the adoption lifecycle of the market, covering from the innovator’s stage to the laggard’s stage. It focuses on adoption rates in different regions based on penetration. Furthermore, the web 3.0 blockchain market report also includes key purchase criteria and drivers of price sensitivity to help companies evaluate and develop their market growth analysis strategies.
Customer Landscape of Web 3.0 Blockchain Industry
Competitive Landscape
Companies are implementing various strategies, such as strategic alliances, web 3.0 blockchain market forecast, partnerships, mergers and acquisitions, geographical expansion, and product/service launches, to enhance their presence in the industry.
Alchemy Insights Inc. - Provides foundational developer tools, including multichain APIs and smart wallet infrastructure, enabling the construction of scalable decentralized applications and NFT-based ecosystems.
The industry research and growth report includes detailed analyses of the competitive landscape of the market and information about key companies, including:
- Alchemy Insights Inc.
- Antier Solutions Pvt. Ltd.
- Binance Holdings Ltd.
- Coinbase Global Inc.
- Crypsense Digital Group
- Guardian Blockchain Labs
- Helium Systems Inc.
- hi Technologies Ltd. UAB
- Intel Corp.
- Kadena LLC
- Messari Inc.
- Ocean Protocol Foundation Ltd.
- Ozone Networks Inc.
- Polygon Labs
- Protocol Labs
- Seracle Ltd.
- Web 3.0 Technologies
Qualitative and quantitative analysis of companies has been conducted to help clients understand the wider business environment as well as the strengths and weaknesses of key industry players. Data is qualitatively analyzed to categorize companies as pure play, category-focused, industry-focused, and diversified; it is quantitatively analyzed to categorize companies as dominant, leading, strong, tentative, and weak.
Recent Development and News in Web 3.0 blockchain market
- In September 2024, Polygon Labs announced a strategic partnership with a leading cloud service provider to integrate its Layer 2 scaling solutions, simplifying enterprise adoption of decentralized applications.
- In November 2024, Coinbase Global Inc. launched its institutional-grade platform for real-world asset (RWA) tokenization, focusing initially on tokenized US Treasury bonds and private credit funds.
- In February 2025, Messari Inc. successfully closed a significant funding round to expand its AI-powered market intelligence dashboards and on-chain analytics tools for institutional clients.
- In April 2025, Protocol Labs published research detailing a technological breakthrough in its decentralized storage network, demonstrating a 30% improvement in data retrieval efficiency and reduced energy consumption.
Dive into Technavio’s robust research methodology, blending expert interviews, extensive data synthesis, and validated models for unparalleled Web 3.0 Blockchain Market insights. See full methodology.
| Market Scope | |
|---|---|
| Page number | 299 |
| Base year | 2024 |
| Historic period | 2019-2023 |
| Forecast period | 2025-2029 |
| Growth momentum & CAGR | Accelerate at a CAGR of 73.6% |
| Market growth 2025-2029 | USD 211086.7 million |
| Market structure | Fragmented |
| YoY growth 2024-2025(%) | 57.2% |
| Key countries | US, Canada, Mexico, Germany, UK, France, Italy, The Netherlands, Spain, China, Japan, India, South Korea, Australia, Indonesia, Brazil, Argentina, Colombia, Saudi Arabia, UAE, South Africa, Israel and Turkey |
| Competitive landscape | Leading Companies, Market Positioning of Companies, Competitive Strategies, and Industry Risks |
Research Analyst Overview
- The Web 3.0 blockchain market is characterized by a rapid evolution from theoretical concepts to tangible enterprise solutions. The integration of real-world asset (RWA) tokenization into corporate balance sheets is a primary catalyst, influencing boardroom-level capital allocation strategies.
- This is enabled by core technologies like decentralized applications (dApps), smart contract automation, and decentralized finance (DeFi), which are built upon permissionless access protocols. Innovations such as decentralized physical infrastructure networks (DePIN), cross-chain interoperability protocols, and layer 2 scaling solutions are addressing critical performance bottlenecks.
- The development of zero-knowledge (ZK) proofs, zk-rollups, and modular chain frameworks is enhancing privacy and scalability, with some implementations reducing transaction verification times by over 80%. Key components like decentralized autonomous organizations (DAOs), non-fungible tokens (NFTs), peer-to-peer (P2P) transactions, and distributed consensus mechanisms are becoming standard.
- The ecosystem is further supported by infrastructure including on-chain solutions, digital asset custody, decentralized data storage, and scalable proof-of-work (PoW) systems, all underpinned by cryptographic security.
What are the Key Data Covered in this Web 3.0 Blockchain Market Research and Growth Report?
-
What is the expected growth of the Web 3.0 Blockchain Market between 2025 and 2029?
-
USD 211.09 billion, at a CAGR of 73.6%
-
-
What segmentation does the market report cover?
-
The report is segmented by End-user (BFSI, Government, Healthcare, and Others), Application (Cryptocurrency trading and investment, Payments and smart contracts infrastructure, Data and transaction storage, Conversational AI, and Others), Type (Public, Private, Consortium, and Hybrid) and Geography (North America, Europe, APAC, South America, Middle East and Africa)
-
-
Which regions are analyzed in the report?
-
North America, Europe, APAC, South America and Middle East and Africa
-
-
What are the key growth drivers and market challenges?
-
Institutionalization of real-world asset tokenization, Regulatory fragmentation and legal uncertainity
-
-
Who are the major players in the Web 3.0 Blockchain Market?
-
Alchemy Insights Inc., Antier Solutions Pvt. Ltd., Binance Holdings Ltd., Coinbase Global Inc., Crypsense Digital Group, Guardian Blockchain Labs, Helium Systems Inc., hi Technologies Ltd. UAB, Intel Corp., Kadena LLC, Messari Inc., Ocean Protocol Foundation Ltd., Ozone Networks Inc., Polygon Labs, Protocol Labs, Seracle Ltd. and Web 3.0 Technologies
-
Market Research Insights
- The market's dynamics are shaped by a strategic shift toward a utility-first application of technology. This is evident in the rise of token incentive mechanisms, which have been shown to accelerate the buildout of decentralized service networks by over 50% compared to traditional models.
- The adoption of tokenized data networks is enhancing data sovereignty, with some platforms demonstrating a 99.9% reduction in unauthorized access. As digital asset risk management becomes standard, institutional-grade custody solutions are seeing increased demand.
- This move toward a more secure and user-centric digital economy is also reflected in the professionalization of crypto-related services, including prime brokerage services and streamlined fiat-to-crypto trading, which are critical for broader market acceptance.
We can help! Our analysts can customize this web 3.0 blockchain market research report to meet your requirements.
 RIA -
RIA - 
