
Web Development Market Analysis, Size, and Forecast 2026-2030: North America (US, Canada, and Mexico), Europe (Germany, UK, and France), APAC (China, Japan, and India), South America (Brazil, Argentina, and Chile), Middle East and Africa (Saudi Arabia, UAE, and South Africa), and Rest of World (ROW)

Web Development Market Analysis, Size, and Forecast 2026-2030:
North America (US, Canada, and Mexico), Europe (Germany, UK, and France), APAC (China, Japan, and India), South America (Brazil, Argentina, and Chile), Middle East and Africa (Saudi Arabia, UAE, and South Africa), and Rest of World (ROW)

Published: Oct 2026 308 Pages SKU: IRTNTR80611

Market Overview at a Glance

$42.54 B
Market Opportunity
9.9%
CAGR 2025 - 2030
29.2%
North America Growth
$18.59 B
Retail and e-commerce segment 2024

Web Development Market Size 2026-2030

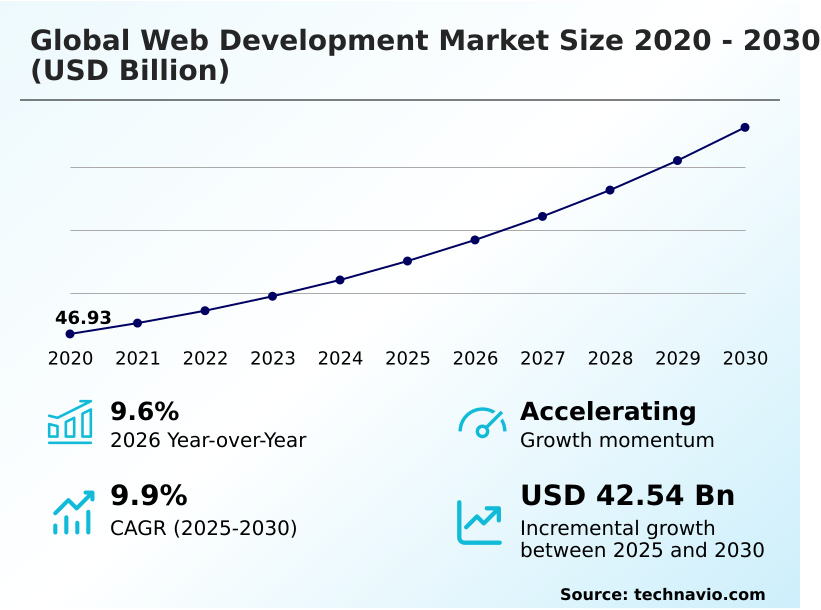
The web development market size is valued to increase by USD 42.54 billion, at a CAGR of 9.9% from 2025 to 2030. Growing digital commerce expansion across industries will drive the web development market.

Major Market Trends & Insights

  • North America dominated the market and accounted for a 29.2% growth during the forecast period.
  • By End-user - Retail and e-commerce segment was valued at USD 18.59 billion in 2024
  • By Business Segment - SMEs segment accounted for the largest market revenue share in 2024

Market Size & Forecast

  • Market Opportunities: USD 65.73 billion
  • Market Future Opportunities: USD 42.54 billion
  • CAGR from 2025 to 2030 : 9.9%

Market Summary

  • The Web Development Market represents a critical foundation for modern business infrastructure, driven by the escalating necessity for scalable online engagement and robust digital service environments. Organizations increasingly depend on sophisticated digital ecosystems to support distributed workflows and uninterrupted consumer access.
  • For instance, manufacturing firms optimizing digital supply chain visibility rely on integrated web portals to track real-time logistics, leading to inventory management efficiency being improved by 22% compared to legacy offline processes. The primary catalyst propelling this market is the widespread expansion of digital commerce, which compels enterprises to construct responsive, secure, and highly personalized web interfaces.
  • Conversely, the industry faces substantial constraints due to the complexity of data privacy regulations and cybersecurity vulnerabilities, forcing companies to allocate significant resources toward continuous compliance audits rather than core innovation. Navigating these dynamics requires the implementation of advanced frameworks to secure data while meeting consumer expectations for seamless functionality.
  • Ultimately, continuous architectural modernization remains essential for businesses to maintain competitive agility and operational resilience in a digitally driven economy.

What will be the Size of the Web Development Market during the forecast period?
Get Key Insights on Market Forecast (PDF) Get Free Sample

How is the Web Development Market Segmented?

The web development industry research report provides comprehensive data (region-wise segment analysis), with forecasts and estimates in "USD million" for the period 2026-2030, as well as historical data from 2020-2024 for the following segments.

  • End-user
    • Retail and e-commerce
    • BFSI
    • IT and telecom
    • Healthcare
    • Others
  • Business segment
    • SMEs
    • Large enterprise
  • Deployment
    • Cloud-based
    • On-premises
    • Hybrid
  • Geography
    • North America
      • US
      • Canada
      • Mexico
    • Europe
      • Germany
      • UK
      • France
      • Italy
      • Spain
      • The Netherlands
    • APAC
      • China
      • Japan
      • India
      • South Korea
      • Australia
      • Indonesia
    • South America
      • Brazil
      • Argentina
      • Chile
    • Middle East and Africa
      • Saudi Arabia
      • UAE
      • South Africa
      • Israel
      • Turkey

By End-user Insights

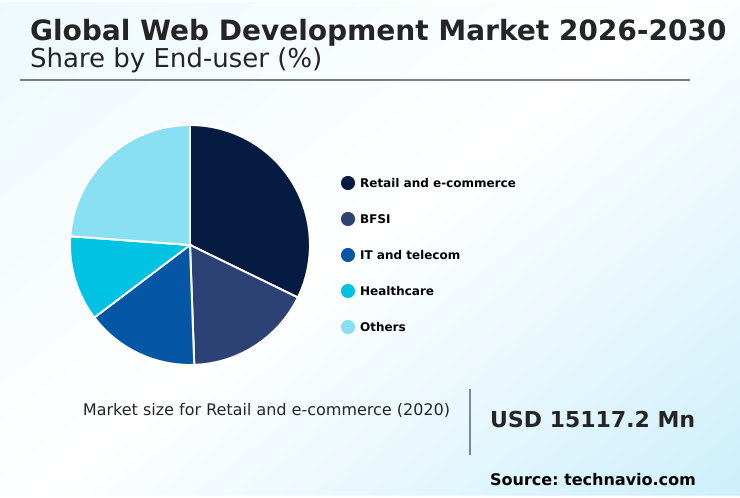
The retail and e-commerce segment is estimated to witness significant growth during the forecast period.

Retail and e-commerce organizations continuously enhance their online presence to support expanding digital commerce requirements and omnichannel commerce strategies.

The evolving nature of the Global Web Development Market 2026-2030 in this sector emphasizes the adoption of headless architecture and progressive web applications, driving operational efficiency gains.

Businesses are leveraging decoupled content architectures and data-driven personalization to create seamless user navigation and integrated customer journey mapping experiences. Implementing these digital transformation initiatives allows retailers to seamlessly connect inventory systems with digital touchpoints.

This strategic shift results in reduced system latency, with customer retention improved by 15% following legacy system modernization. Furthermore, organizations utilize robust cybersecurity frameworks and secure payment integration to maintain trust and protect sensitive consumer data across digital ecosystems.

By relying on content management systems, retailers ensure multiregional content distribution adapts dynamically to shifting consumer demands.
Get Free Sample

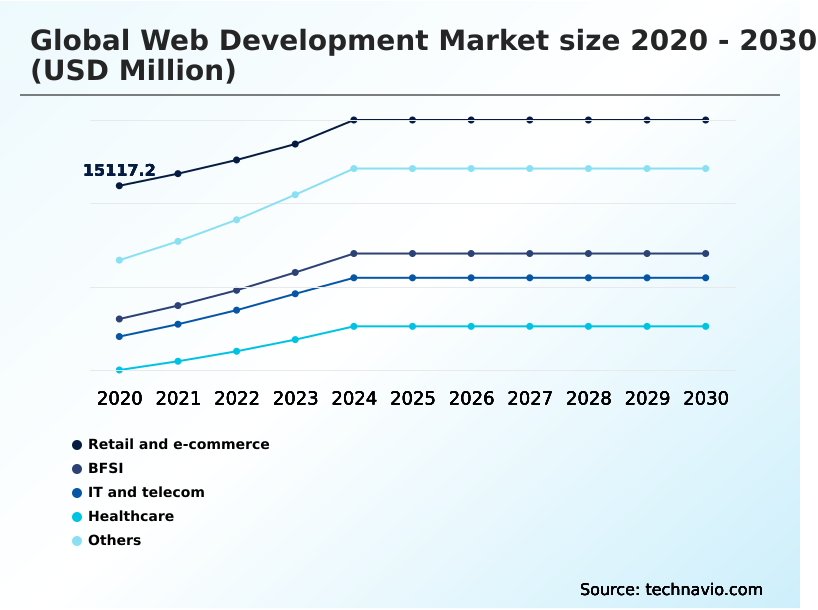
The Retail and e-commerce segment was valued at USD 18.59 billion in 2024 and showed a gradual increase during the forecast period.
Get Free Sample

Regional Analysis

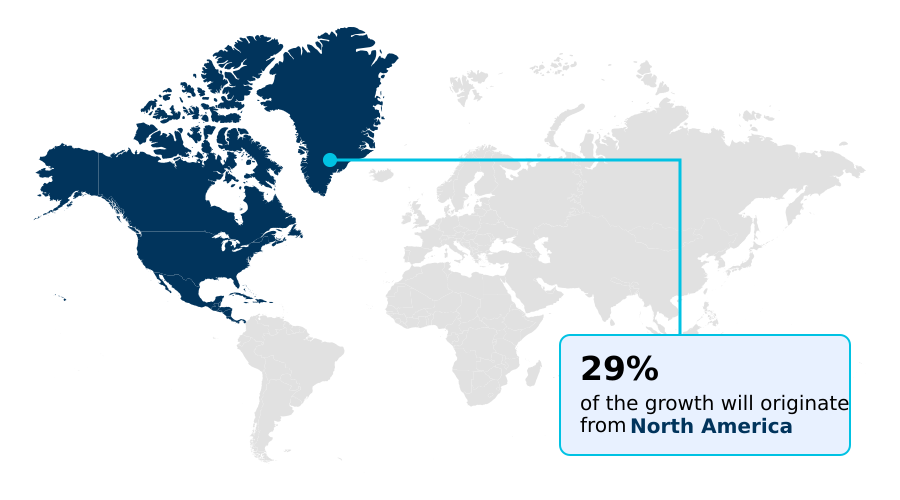
North America is estimated to contribute 29.2% to the growth of the global market during the forecast period.Technavio’s analysts have elaborately explained the regional trends and drivers that shape the market during the forecast period.
See How Web Development Market Demand is Rising in North America Get Free Sample

The geographic landscape of the Global Web Development Market 2026-2030 highlights distinct adoption patterns driven by varying infrastructure maturity and regulatory environments.

North America leads in adopting edge computing environments and microservices architecture to support massive enterprise technology infrastructure, resulting in digital supply chain visibility improving by 30%.

In contrast, the market in APAC is characterized by rapid mobile-first development and the aggressive deployment of progressive web applications to capture a heavily smartphone-reliant consumer base.

This divergence means APAC organizations frequently achieve application deployment speeds that are 20% faster than traditional models. Meanwhile, European organizations prioritize data privacy compliance and digital identity verification to meet stringent regional regulations, reducing compliance-related operational friction by 15%.

These regional priorities force businesses to adapt their digital service delivery models, balancing rapid innovation with strict governance frameworks to ensure optimal performance and seamless cross-border service delivery.

Market Dynamics

Our researchers analyzed the data with 2025 as the base year, along with the key drivers, trends, and challenges. A holistic analysis of drivers will help companies refine their marketing strategies to gain a competitive advantage.

  • The evolution of digital infrastructure is fundamentally changing how enterprises approach online engagement, driving a significant shift toward modern engineering frameworks to ensure customer experience optimization. As businesses prioritize flexibility, the adoption of headless content management deployment frameworks has become critical. This approach allows organizations to separate backend content repositories from frontend presentation layers, enabling faster updates across multiple devices.
  • Concurrently, companies are investing in cloud-native enterprise web application development to ensure that digital platforms can seamlessly scale during peak traffic periods without compromising user experience. To further enhance system agility, IT leaders are transitioning toward modular architecture implementation models. By breaking down monolithic applications into interchangeable components, businesses can swap or upgrade specific functions without disrupting the entire ecosystem.
  • This strategic restructuring often yields substantial operational improvements; for instance, organizations utilizing modular frameworks report that system integration times are accelerated by nearly 40% compared to legacy monolithic deployments, drastically improving project planning and resource allocation. Additionally, achieving composable digital experience integration allows marketing and commerce teams to rapidly deploy tailored customer journeys, ensuring highly personalized interactions.
  • Finally, as cyber threats grow more sophisticated, secure online transaction platform development remains a paramount focus, safeguarding sensitive consumer financial data while complying with complex international privacy standards. Together, these advanced methodologies ensure organizations maintain robust, adaptable, and highly competitive digital environments.
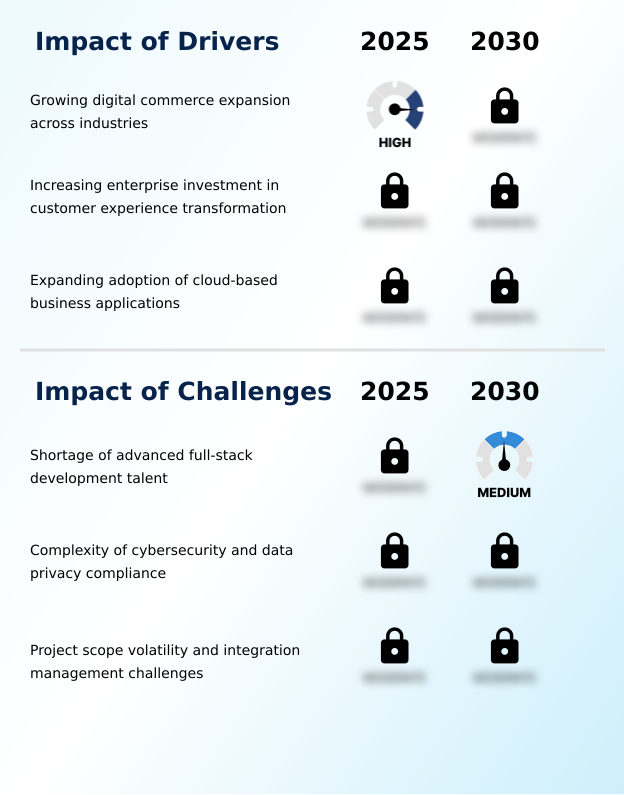
What are the key market drivers leading to the rise in the adoption of Web Development Industry?

  • The growing expansion of digital commerce across multiple industries serves as a primary driver propelling advanced digital platform integration and market growth.

  • The continuous expansion of omnichannel commerce strategies acts as a primary catalyst accelerating demand within the Global Web Development Market 2026-2030.
  • Modern retailers are compelled to overhaul their legacy systems, adopting microservices architecture and decoupled content architectures to unify fragmented consumer touchpoints. This behavioral shift is fueled by rising consumer expectations for seamless cross-channel interactions and instant digital service delivery.
  • Consequently, businesses implementing data-driven personalization and progressive web applications observe distinct operational benefits, including customer engagement rates improved by 30%.
  • Furthermore, by utilizing scalable cloud computing adoption to synchronize real-time inventory and pricing data, organizations successfully achieve transaction failure rates reduced by 18%.
  • These infrastructure upgrades empower enterprises to maximize revenue capture, optimize supply chain coordination, and foster long-term brand loyalty.

What are the market trends shaping the Web Development Industry?

  • The accelerating adoption of artificial intelligence-assisted development workflows represents a significant emerging trend. This operational shift enhances coding efficiency and structural design across enterprise digital platforms.

  • A pivotal trend within the Global Web Development Market 2026-2030 is the accelerated adoption of artificial intelligence-enabled automated testing solutions and modular architecture to streamline software engineering lifecycles. Organizations are shifting away from traditional manual coding practices, replacing them with intelligent workflow automation tools that optimize resource utilization.
  • This fundamental change is driven by the need to deploy cloud-native development environments faster while maintaining rigorous quality control. The transition has a profound impact on business operations, as development teams leverage these tools to achieve testing cycles accelerated by 35%.
  • Additionally, by integrating advanced application programming interfaces and edge computing environments, enterprises can process requests closer to the user, resulting in application latency reduced by 25%. These technological advancements directly empower companies to innovate rapidly, adapt to shifting consumer demands, and sustain high-performance digital ecosystems.

What challenges does the Web Development Industry face during its growth?

  • A persistent shortage of advanced full-stack development talent remains a critical challenge constraining rapid project execution and industry expansion.

  • The escalating complexity of data privacy compliance and the persistent threat of cyberattacks present formidable structural limitations for the Global Web Development Market 2026-2030. Organizations are heavily burdened by the necessity to integrate comprehensive cybersecurity frameworks and digital identity verification systems across diverse regulatory jurisdictions.
  • This rigorous compliance requirement forces IT departments to divert critical resources away from front-end innovation toward continuous backend auditing. Because legacy system modernization projects often uncover deeply embedded security vulnerabilities, remediation efforts significantly extend project timelines. Consequently, enterprises grappling with these integration bottlenecks report that average deployment cycles are delayed by 22%.
  • Furthermore, the overhead costs associated with maintaining multiregional content distribution in strict adherence to data protection mandates lead to compliance management expenses increased by 15%, squeezing overall project margins.

Exclusive Technavio Analysis on Customer Landscape

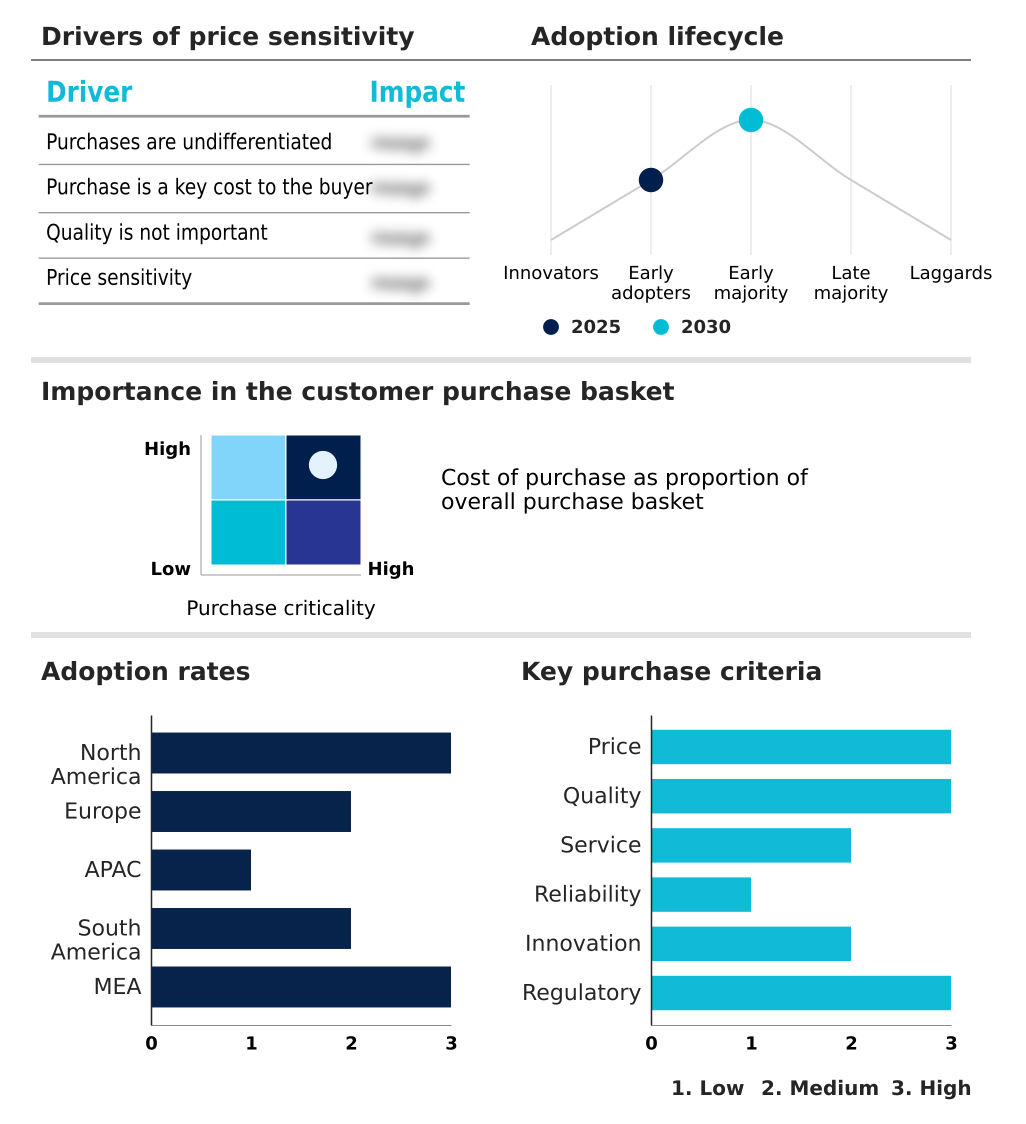
The web development market forecasting report includes the adoption lifecycle of the market, covering from the innovator’s stage to the laggard’s stage. It focuses on adoption rates in different regions based on penetration. Furthermore, the web development market report also includes key purchase criteria and drivers of price sensitivity to help companies evaluate and develop their market growth analysis strategies.
Customer Landscape of Web Development Industry

Competitive Landscape

Companies are implementing various strategies, such as strategic alliances, web development market forecast, partnerships, mergers and acquisitions, geographical expansion, and product/service launches, to enhance their presence in the industry.

Accenture Plc - The entity delivers comprehensive web application programming, scalable ecommerce platforms, and advanced content management systems designed to optimize digital ecosystems and enhance user engagement.

The industry research and growth report includes detailed analyses of the competitive landscape of the market and information about key companies, including:

  • Accenture Plc
  • BairesDev LLC
  • Capgemini SE
  • Cognizant Technology Solution
  • Cyient Ltd.
  • Datamatics Global Services Ltd.
  • Endava plc
  • EPAM Systems Inc.
  • Globant SA
  • HCL Technologies Ltd.
  • Hexaware Technologies Ltd.
  • Infosys Ltd.
  • LTIMindtree Ltd.
  • Mphasis Ltd.
  • Persistent Systems Ltd.
  • SoftServe Inc.
  • Tata Consultancy Services
  • Tech Mahindra Ltd.
  • Thoughtworks Holding Inc.
  • Virtusa Corp.
  • Wipro Ltd.
  • Zensar Technologies Inc.

Qualitative and quantitative analysis of companies has been conducted to help clients understand the wider business environment as well as the strengths and weaknesses of key industry players. Data is qualitatively analyzed to categorize companies as pure play, category-focused, industry-focused, and diversified; it is quantitatively analyzed to categorize companies as dominant, leading, strong, tentative, and weak.

Recent Development and News in Web development market

  • In the Application Software industry, the transition toward modular architecture and workflow automation tools has accelerated enterprise modernization, directly impacting the Global Web Development Market 2026-2030 demand by requiring robust application programming interfaces that improve deployment efficiency by 20%.
  • Stringent data privacy compliance regulations, such as the EU General Data Protection Regulation, have forced enterprise technology infrastructure overhauls, driving developers to implement advanced digital identity verification and web accessibility compliance protocols that reduce non-compliance risks by 35%.
  • Widespread cloud computing adoption and the shift to cloud orchestration platforms have restructured how software is delivered, increasing the need for cloud-native development and serverless architectures to handle high-traffic volume management across distributed geographical networks.
  • Rising demand for digital service delivery in healthcare and finance has catalyzed the deployment of telehealth platforms and digital lending interfaces, leading to a 25% increase in cross-border service delivery investments to support real-time data processing and secure integrations.

Dive into Technavio’s robust research methodology, blending expert interviews, extensive data synthesis, and validated models for unparalleled Web Development Market insights. See full methodology.

Market Scope
Page number 308
Base year 2025
Historic period 2020-2024
Forecast period 2026-2030
Growth momentum & CAGR Accelerate at a CAGR of 9.9%
Market growth 2026-2030 USD 42540.3 million
Market structure Fragmented
YoY growth 2025-2026(%) 9.6%
Key countries US, Canada, Mexico, Germany, UK, France, Italy, Spain, The Netherlands, China, Japan, India, South Korea, Australia, Indonesia, Brazil, Argentina, Chile, Saudi Arabia, UAE, South Africa, Israel and Turkey
Competitive landscape Leading Companies, Market Positioning of Companies, Competitive Strategies, and Industry Risks

Request Free Sample

Research Analyst Overview

  • The Global Web Development Market 2026-2030 is undergoing a profound structural transformation as enterprises transition from rigid legacy systems to highly adaptable digital ecosystems. A definitive trend shaping boardroom-level strategic planning is the shift toward containerization technologies and low-code environments.
  • Executives are increasingly allocating IT budgets toward these agile development methodologies to accelerate product launches and mitigate the risks associated with volatile market demands. By leveraging automated testing solutions and responsive web design, organizations can systematically reduce coding errors and enhance platform stability.
  • Consequently, enterprises adopting these advanced frameworks have reported that application downtime is reduced by 28% compared to traditional hosting models, directly protecting revenue streams. Furthermore, the integration of application modernization strategies enables businesses to deploy scalable serverless architectures, minimizing infrastructure overhead. As leaders prioritize operational resilience, investments in application programming interfaces become non-negotiable for seamless internal and external system connectivity.
  • Ultimately, utilizing these dynamic engineering practices empowers organizations to maintain a robust competitive edge while navigating complex technological shifts.

What are the Key Data Covered in this Web Development Market Research and Growth Report?

  • What is the expected growth of the Web Development Market between 2026 and 2030?

    • USD 42.54 billion, at a CAGR of 9.9%

  • What segmentation does the market report cover?

    • The report is segmented by End-user (Retail and e-commerce, BFSI, IT and telecom, Healthcare, and Others), Business Segment (SMEs, and Large enterprise), Deployment (Cloud-based, On-premises, and Hybrid) and Geography (North America, Europe, APAC, South America, Middle East and Africa)

  • Which regions are analyzed in the report?

    • North America, Europe, APAC, South America and Middle East and Africa

  • What are the key growth drivers and market challenges?

    • Growing digital commerce expansion across industries, Shortage of advanced full-stack development talent

  • Who are the major players in the Web Development Market?

    • Accenture Plc, BairesDev LLC, Capgemini SE, Cognizant Technology Solution, Cyient Ltd., Datamatics Global Services Ltd., Endava plc, EPAM Systems Inc., Globant SA, HCL Technologies Ltd., Hexaware Technologies Ltd., Infosys Ltd., LTIMindtree Ltd., Mphasis Ltd., Persistent Systems Ltd., SoftServe Inc., Tata Consultancy Services, Tech Mahindra Ltd., Thoughtworks Holding Inc., Virtusa Corp., Wipro Ltd. and Zensar Technologies Inc.

Market Research Insights

  • The Web Development Market serves as the critical backbone for enterprise web technologies and online customer engagement. As organizations accelerate digital ecosystem integration, robust platforms are essential to support expanding commercial channels. Implementing scalable online infrastructure allows businesses to handle demand fluctuations efficiently, resulting in server downtime reduced by 18%.
  • Furthermore, the transition toward automated workflow deployment enables teams to accelerate time-to-market and optimize resource allocation. By adopting mobile-first development strategies, retailers have seen mobile conversion rates increased by 25%, directly boosting revenue generation capabilities. These operational efficiency gains ensure that companies remain resilient and highly competitive while delivering consistent value across continuously evolving digital touchpoints.

We can help! Our analysts can customize this web development market research report to meet your requirements.

Get in touch

1. Executive Summary

1.1 Market overview

Executive Summary - Chart on Market Overview
Executive Summary - Data Table on Market Overview
Executive Summary - Chart on Global Market Characteristics
Executive Summary - Chart on Market by Geography
Executive Summary - Chart on Market Segmentation by End-user
Executive Summary - Chart on Market Segmentation by Business Segment
Executive Summary - Chart on Market Segmentation by Deployment
Executive Summary - Chart on Incremental Growth
Executive Summary - Data Table on Incremental Growth
Executive Summary - Chart on Company Market Positioning

2. Technavio Analysis

2.1 Analysis of price sensitivity, lifecycle, customer purchase basket, adoption rates, and purchase criteria

2.2 Criticality of inputs and Factors of differentiation

Chart on Overview on criticality of inputs and factors of differentiation

2.3 Factors of disruption

Chart on Overview on factors of disruption

2.4 Impact of drivers and challenges

Chart on Impact of drivers and challenges in 2025 and 2030

3. Market Landscape

3.1 Market ecosystem

Chart on Parent Market
Data Table on - Parent Market

3.2 Market characteristics

Chart on Market characteristics analysis

3.3 Value chain analysis

Chart on Value chain analysis

4. Market Sizing

4.1 Market definition

Data Table on Offerings of companies included in the market definition

4.2 Market segment analysis

Market segments

4.3 Market size 2025

4.4 Market outlook: Forecast for 2025-2030

Chart on Global - Market size and forecast 2025-2030 ($ million)
Data Table on Global - Market size and forecast 2025-2030 ($ million)
Chart on Global Market: Year-over-year growth 2025-2030 (%)
Data Table on Global Market: Year-over-year growth 2025-2030 (%)

5. Historic Market Size

5.1 Global Web Development Market 2020 - 2024

Historic Market Size - Data Table on Global Web Development Market 2020 - 2024 ($ million)

5.2 End-user segment analysis 2020 - 2024

Historic Market Size - End-user Segment 2020 - 2024 ($ million)

5.3 Business segment analysis 2020 - 2024

Historic Market Size - Business Segment 2020 - 2024 ($ million)

5.4 Deployment segment analysis 2020 - 2024

Historic Market Size - Deployment Segment 2020 - 2024 ($ million)

5.5 Geography segment analysis 2020 - 2024

Historic Market Size - Geography Segment 2020 - 2024 ($ million)

5.6 Country segment analysis 2020 - 2024

Historic Market Size - Country Segment 2020 - 2024 ($ million)

6. Qualitative Analysis

6.1 Impact of AI on global web development market

6.2 Impact of geopolitical conflicts on global web development market

7. Five Forces Analysis

7.1 Five forces summary

Five forces analysis - Comparison between 2025 and 2030

7.2 Bargaining power of buyers

Bargaining power of buyers - Impact of key factors 2025 and 2030

7.3 Bargaining power of suppliers

Bargaining power of suppliers - Impact of key factors in 2025 and 2030

7.4 Threat of new entrants

Threat of new entrants - Impact of key factors in 2025 and 2030

7.5 Threat of substitutes

Threat of substitutes - Impact of key factors in 2025 and 2030

7.6 Threat of rivalry

Threat of rivalry - Impact of key factors in 2025 and 2030

7.7 Market condition

Chart on Market condition - Five forces 2025 and 2030

8. Market Segmentation by End-user

8.1 Market segments

Chart on End-user - Market share 2025-2030 (%)
Data Table on End-user - Market share 2025-2030 (%)

8.2 Comparison by End-user

Chart on Comparison by End-user
Data Table on Comparison by End-user

8.3 Retail and e-commerce - Market size and forecast 2025-2030

Chart on Retail and e-commerce - Market size and forecast 2025-2030 ($ million)
Data Table on Retail and e-commerce - Market size and forecast 2025-2030 ($ million)
Chart on Retail and e-commerce - Year-over-year growth 2025-2030 (%)
Data Table on Retail and e-commerce - Year-over-year growth 2025-2030 (%)

8.4 BFSI - Market size and forecast 2025-2030

Chart on BFSI - Market size and forecast 2025-2030 ($ million)
Data Table on BFSI - Market size and forecast 2025-2030 ($ million)
Chart on BFSI - Year-over-year growth 2025-2030 (%)
Data Table on BFSI - Year-over-year growth 2025-2030 (%)

8.5 IT and telecom - Market size and forecast 2025-2030

Chart on IT and telecom - Market size and forecast 2025-2030 ($ million)
Data Table on IT and telecom - Market size and forecast 2025-2030 ($ million)
Chart on IT and telecom - Year-over-year growth 2025-2030 (%)
Data Table on IT and telecom - Year-over-year growth 2025-2030 (%)

8.6 Healthcare - Market size and forecast 2025-2030

Chart on Healthcare - Market size and forecast 2025-2030 ($ million)
Data Table on Healthcare - Market size and forecast 2025-2030 ($ million)
Chart on Healthcare - Year-over-year growth 2025-2030 (%)
Data Table on Healthcare - Year-over-year growth 2025-2030 (%)

8.7 Others - Market size and forecast 2025-2030

Chart on Others - Market size and forecast 2025-2030 ($ million)
Data Table on Others - Market size and forecast 2025-2030 ($ million)
Chart on Others - Year-over-year growth 2025-2030 (%)
Data Table on Others - Year-over-year growth 2025-2030 (%)

8.8 Market opportunity by End-user

Market opportunity by End-user ($ million)
Data Table on Market opportunity by End-user ($ million)

9. Market Segmentation by Business Segment

9.1 Market segments

Chart on Market Segmentation by Business Segment - Market share 2025-2030 (%)
Data Table on Market Segmentation by Business Segment - Market share 2025-2030 (%)

9.2 Comparison by Market Segmentation by Business Segment

Chart on Comparison by Market Segmentation by Business Segment
Data Table on Comparison by Market Segmentation by Business Segment

9.3 SMEs - Market size and forecast 2025-2030

Chart on SMEs - Market size and forecast 2025-2030 ($ million)
Data Table on SMEs - Market size and forecast 2025-2030 ($ million)
Chart on SMEs - Year-over-year growth 2025-2030 (%)
Data Table on SMEs - Year-over-year growth 2025-2030 (%)

9.4 Large enterprise - Market size and forecast 2025-2030

Chart on Large enterprise - Market size and forecast 2025-2030 ($ million)
Data Table on Large enterprise - Market size and forecast 2025-2030 ($ million)
Chart on Large enterprise - Year-over-year growth 2025-2030 (%)
Data Table on Large enterprise - Year-over-year growth 2025-2030 (%)

9.5 Market opportunity by Market Segmentation by Business Segment

Market opportunity by Market Segmentation by Business Segment ($ million)
Data Table on Market opportunity by Market Segmentation by Business Segment ($ million)

10. Market Segmentation by Deployment

10.1 Market segments

Chart on Deployment - Market share 2025-2030 (%)
Data Table on Deployment - Market share 2025-2030 (%)

10.2 Comparison by Deployment

Chart on Comparison by Deployment
Data Table on Comparison by Deployment

10.3 Cloud-based - Market size and forecast 2025-2030

Chart on Cloud-based - Market size and forecast 2025-2030 ($ million)
Data Table on Cloud-based - Market size and forecast 2025-2030 ($ million)
Chart on Cloud-based - Year-over-year growth 2025-2030 (%)
Data Table on Cloud-based - Year-over-year growth 2025-2030 (%)

10.4 On-premises - Market size and forecast 2025-2030

Chart on On-premises - Market size and forecast 2025-2030 ($ million)
Data Table on On-premises - Market size and forecast 2025-2030 ($ million)
Chart on On-premises - Year-over-year growth 2025-2030 (%)
Data Table on On-premises - Year-over-year growth 2025-2030 (%)

10.5 Hybrid - Market size and forecast 2025-2030

Chart on Hybrid - Market size and forecast 2025-2030 ($ million)
Data Table on Hybrid - Market size and forecast 2025-2030 ($ million)
Chart on Hybrid - Year-over-year growth 2025-2030 (%)
Data Table on Hybrid - Year-over-year growth 2025-2030 (%)

10.6 Market opportunity by Deployment

Market opportunity by Deployment ($ million)
Data Table on Market opportunity by Deployment ($ million)

11. Customer Landscape

11.1 Customer landscape overview

Analysis of price sensitivity, lifecycle, customer purchase basket, adoption rates, and purchase criteria

12. Geographic Landscape

12.1 Geographic segmentation

Chart on Market share by geography 2025-2030 (%)
Data Table on Market share by geography 2025-2030 (%)

12.2 Geographic comparison

Chart on Geographic comparison
Data Table on Geographic comparison

12.3 North America - Market size and forecast 2025-2030

Chart on North America - Market size and forecast 2025-2030 ($ million)
Data Table on North America - Market size and forecast 2025-2030 ($ million)
Chart on North America - Year-over-year growth 2025-2030 (%)
Data Table on North America - Year-over-year growth 2025-2030 (%)
Chart on Regional Comparison - North America
Data Table on Regional Comparison - North America

12.3.1 US - Market size and forecast 2025-2030

Chart on US - Market size and forecast 2025-2030 ($ million)
Data Table on US - Market size and forecast 2025-2030 ($ million)
Chart on US - Year-over-year growth 2025-2030 (%)
Data Table on US - Year-over-year growth 2025-2030 (%)

12.3.2 Canada - Market size and forecast 2025-2030

Chart on Canada - Market size and forecast 2025-2030 ($ million)
Data Table on Canada - Market size and forecast 2025-2030 ($ million)
Chart on Canada - Year-over-year growth 2025-2030 (%)
Data Table on Canada - Year-over-year growth 2025-2030 (%)

12.3.3 Mexico - Market size and forecast 2025-2030

Chart on Mexico - Market size and forecast 2025-2030 ($ million)
Data Table on Mexico - Market size and forecast 2025-2030 ($ million)
Chart on Mexico - Year-over-year growth 2025-2030 (%)
Data Table on Mexico - Year-over-year growth 2025-2030 (%)

12.4 Europe - Market size and forecast 2025-2030

Chart on Europe - Market size and forecast 2025-2030 ($ million)
Data Table on Europe - Market size and forecast 2025-2030 ($ million)
Chart on Europe - Year-over-year growth 2025-2030 (%)
Data Table on Europe - Year-over-year growth 2025-2030 (%)
Chart on Regional Comparison - Europe
Data Table on Regional Comparison - Europe

12.4.1 Germany - Market size and forecast 2025-2030

Chart on Germany - Market size and forecast 2025-2030 ($ million)
Data Table on Germany - Market size and forecast 2025-2030 ($ million)
Chart on Germany - Year-over-year growth 2025-2030 (%)
Data Table on Germany - Year-over-year growth 2025-2030 (%)

12.4.2 UK - Market size and forecast 2025-2030

Chart on UK - Market size and forecast 2025-2030 ($ million)
Data Table on UK - Market size and forecast 2025-2030 ($ million)
Chart on UK - Year-over-year growth 2025-2030 (%)
Data Table on UK - Year-over-year growth 2025-2030 (%)

12.4.3 France - Market size and forecast 2025-2030

Chart on France - Market size and forecast 2025-2030 ($ million)
Data Table on France - Market size and forecast 2025-2030 ($ million)
Chart on France - Year-over-year growth 2025-2030 (%)
Data Table on France - Year-over-year growth 2025-2030 (%)

12.4.4 Italy - Market size and forecast 2025-2030

Chart on Italy - Market size and forecast 2025-2030 ($ million)
Data Table on Italy - Market size and forecast 2025-2030 ($ million)
Chart on Italy - Year-over-year growth 2025-2030 (%)
Data Table on Italy - Year-over-year growth 2025-2030 (%)

12.4.5 Spain - Market size and forecast 2025-2030

Chart on Spain - Market size and forecast 2025-2030 ($ million)
Data Table on Spain - Market size and forecast 2025-2030 ($ million)
Chart on Spain - Year-over-year growth 2025-2030 (%)
Data Table on Spain - Year-over-year growth 2025-2030 (%)

12.4.6 The Netherlands - Market size and forecast 2025-2030

Chart on The Netherlands - Market size and forecast 2025-2030 ($ million)
Data Table on The Netherlands - Market size and forecast 2025-2030 ($ million)
Chart on The Netherlands - Year-over-year growth 2025-2030 (%)
Data Table on The Netherlands - Year-over-year growth 2025-2030 (%)

12.5 APAC - Market size and forecast 2025-2030

Chart on APAC - Market size and forecast 2025-2030 ($ million)
Data Table on APAC - Market size and forecast 2025-2030 ($ million)
Chart on APAC - Year-over-year growth 2025-2030 (%)
Data Table on APAC - Year-over-year growth 2025-2030 (%)
Chart on Regional Comparison - APAC
Data Table on Regional Comparison - APAC

12.5.1 China - Market size and forecast 2025-2030

Chart on China - Market size and forecast 2025-2030 ($ million)
Data Table on China - Market size and forecast 2025-2030 ($ million)
Chart on China - Year-over-year growth 2025-2030 (%)
Data Table on China - Year-over-year growth 2025-2030 (%)

12.5.2 Japan - Market size and forecast 2025-2030

Chart on Japan - Market size and forecast 2025-2030 ($ million)
Data Table on Japan - Market size and forecast 2025-2030 ($ million)
Chart on Japan - Year-over-year growth 2025-2030 (%)
Data Table on Japan - Year-over-year growth 2025-2030 (%)

12.5.3 India - Market size and forecast 2025-2030

Chart on India - Market size and forecast 2025-2030 ($ million)
Data Table on India - Market size and forecast 2025-2030 ($ million)
Chart on India - Year-over-year growth 2025-2030 (%)
Data Table on India - Year-over-year growth 2025-2030 (%)

12.5.4 South Korea - Market size and forecast 2025-2030

Chart on South Korea - Market size and forecast 2025-2030 ($ million)
Data Table on South Korea - Market size and forecast 2025-2030 ($ million)
Chart on South Korea - Year-over-year growth 2025-2030 (%)
Data Table on South Korea - Year-over-year growth 2025-2030 (%)

12.5.5 Australia - Market size and forecast 2025-2030

Chart on Australia - Market size and forecast 2025-2030 ($ million)
Data Table on Australia - Market size and forecast 2025-2030 ($ million)
Chart on Australia - Year-over-year growth 2025-2030 (%)
Data Table on Australia - Year-over-year growth 2025-2030 (%)

12.5.6 Indonesia - Market size and forecast 2025-2030

Chart on Indonesia - Market size and forecast 2025-2030 ($ million)
Data Table on Indonesia - Market size and forecast 2025-2030 ($ million)
Chart on Indonesia - Year-over-year growth 2025-2030 (%)
Data Table on Indonesia - Year-over-year growth 2025-2030 (%)

12.6 South America - Market size and forecast 2025-2030

Chart on South America - Market size and forecast 2025-2030 ($ million)
Data Table on South America - Market size and forecast 2025-2030 ($ million)
Chart on South America - Year-over-year growth 2025-2030 (%)
Data Table on South America - Year-over-year growth 2025-2030 (%)
Chart on Regional Comparison - South America
Data Table on Regional Comparison - South America

12.6.1 Brazil - Market size and forecast 2025-2030

Chart on Brazil - Market size and forecast 2025-2030 ($ million)
Data Table on Brazil - Market size and forecast 2025-2030 ($ million)
Chart on Brazil - Year-over-year growth 2025-2030 (%)
Data Table on Brazil - Year-over-year growth 2025-2030 (%)

12.6.2 Argentina - Market size and forecast 2025-2030

Chart on Argentina - Market size and forecast 2025-2030 ($ million)
Data Table on Argentina - Market size and forecast 2025-2030 ($ million)
Chart on Argentina - Year-over-year growth 2025-2030 (%)
Data Table on Argentina - Year-over-year growth 2025-2030 (%)

12.6.3 Chile - Market size and forecast 2025-2030

Chart on Chile - Market size and forecast 2025-2030 ($ million)
Data Table on Chile - Market size and forecast 2025-2030 ($ million)
Chart on Chile - Year-over-year growth 2025-2030 (%)
Data Table on Chile - Year-over-year growth 2025-2030 (%)

12.7 Middle East and Africa - Market size and forecast 2025-2030

Chart on Middle East and Africa - Market size and forecast 2025-2030 ($ million)
Data Table on Middle East and Africa - Market size and forecast 2025-2030 ($ million)
Chart on Middle East and Africa - Year-over-year growth 2025-2030 (%)
Data Table on Middle East and Africa - Year-over-year growth 2025-2030 (%)
Chart on Regional Comparison - Middle East and Africa
Data Table on Regional Comparison - Middle East and Africa

12.7.1 Saudi Arabia - Market size and forecast 2025-2030

Chart on Saudi Arabia - Market size and forecast 2025-2030 ($ million)
Data Table on Saudi Arabia - Market size and forecast 2025-2030 ($ million)
Chart on Saudi Arabia - Year-over-year growth 2025-2030 (%)
Data Table on Saudi Arabia - Year-over-year growth 2025-2030 (%)

12.7.2 UAE - Market size and forecast 2025-2030

Chart on UAE - Market size and forecast 2025-2030 ($ million)
Data Table on UAE - Market size and forecast 2025-2030 ($ million)
Chart on UAE - Year-over-year growth 2025-2030 (%)
Data Table on UAE - Year-over-year growth 2025-2030 (%)

12.7.3 South Africa - Market size and forecast 2025-2030

Chart on South Africa - Market size and forecast 2025-2030 ($ million)
Data Table on South Africa - Market size and forecast 2025-2030 ($ million)
Chart on South Africa - Year-over-year growth 2025-2030 (%)
Data Table on South Africa - Year-over-year growth 2025-2030 (%)

12.7.4 Israel - Market size and forecast 2025-2030

Chart on Israel - Market size and forecast 2025-2030 ($ million)
Data Table on Israel - Market size and forecast 2025-2030 ($ million)
Chart on Israel - Year-over-year growth 2025-2030 (%)
Data Table on Israel - Year-over-year growth 2025-2030 (%)

12.7.5 Turkey - Market size and forecast 2025-2030

Chart on Turkey - Market size and forecast 2025-2030 ($ million)
Data Table on Turkey - Market size and forecast 2025-2030 ($ million)
Chart on Turkey - Year-over-year growth 2025-2030 (%)
Data Table on Turkey - Year-over-year growth 2025-2030 (%)

12.8 Market opportunity by geography

Market opportunity by geography ($ million)
Data Tables on Market opportunity by geography ($ million)

13. Drivers, Challenges, and Opportunity

13.1 Market drivers

Growing digital commerce expansion across industries
Increasing enterprise investment in customer experience transformation
Expanding adoption of cloud-based business applications

13.2 Market challenges

Shortage of advanced full-stack development talent
Complexity of cybersecurity and data privacy compliance
Project scope volatility and integration management challenges

13.3 Impact of drivers and challenges

Impact of drivers and challenges in 2025 and 2030

13.4 Market opportunities

Accelerating adoption of AI-assisted development workflows
Evolving composable architecture implementation models
Growing shift toward headless content management deployment frameworks

14. Competitive Landscape

14.1 Overview

14.2

Overview on criticality of inputs and factors of differentiation

14.3 Landscape disruption

Overview on factors of disruption

14.4 Industry risks

Impact of key risks on business

15. Competitive Analysis

15.1 Companies profiled

Companies covered

15.2 Company ranking index

15.3 Market positioning of companies

Matrix on companies position and classification

15.4 Accenture Plc

Accenture Plc - Overview
Accenture Plc - Business segments
Accenture Plc - Key news
Accenture Plc - Key offerings
Accenture Plc - Segment focus
SWOT

15.5 Capgemini SE

Capgemini SE - Overview
Capgemini SE - Business segments
Capgemini SE - Key news
Capgemini SE - Key offerings
Capgemini SE - Segment focus
SWOT

15.6 Cognizant Technology Solution

Cognizant Technology Solution - Overview
Cognizant Technology Solution - Business segments
Cognizant Technology Solution - Key news
Cognizant Technology Solution - Key offerings
Cognizant Technology Solution - Segment focus
SWOT

15.7 EPAM Systems Inc.

EPAM Systems Inc. - Overview
EPAM Systems Inc. - Business segments
EPAM Systems Inc. - Key news
EPAM Systems Inc. - Key offerings
EPAM Systems Inc. - Segment focus
SWOT

15.8 Globant SA

Globant SA - Overview
Globant SA - Product / Service
Globant SA - Key offerings
SWOT

15.9 HCL Technologies Ltd.

HCL Technologies Ltd. - Overview
HCL Technologies Ltd. - Business segments
HCL Technologies Ltd. - Key news
HCL Technologies Ltd. - Key offerings
HCL Technologies Ltd. - Segment focus
SWOT

15.10 Hexaware Technologies Ltd.

Hexaware Technologies Ltd. - Overview
Hexaware Technologies Ltd. - Business segments
Hexaware Technologies Ltd. - Key offerings
Hexaware Technologies Ltd. - Segment focus
SWOT

15.11 Infosys Ltd.

Infosys Ltd. - Overview
Infosys Ltd. - Business segments
Infosys Ltd. - Key news
Infosys Ltd. - Key offerings
Infosys Ltd. - Segment focus
SWOT

15.12 LTIMindtree Ltd.

LTIMindtree Ltd. - Overview
LTIMindtree Ltd. - Product / Service
LTIMindtree Ltd. - Key offerings
SWOT

15.13 Mphasis Ltd.

Mphasis Ltd. - Overview
Mphasis Ltd. - Product / Service
Mphasis Ltd. - Key offerings
SWOT

15.14 Persistent Systems Ltd.

Persistent Systems Ltd. - Overview
Persistent Systems Ltd. - Product / Service
Persistent Systems Ltd. - Key offerings
SWOT

15.15 Tata Consultancy Services

Tata Consultancy Services - Overview
Tata Consultancy Services - Business segments
Tata Consultancy Services - Key news
Tata Consultancy Services - Key offerings
Tata Consultancy Services - Segment focus
SWOT

15.16 Tech Mahindra Ltd.

Tech Mahindra Ltd. - Overview
Tech Mahindra Ltd. - Business segments
Tech Mahindra Ltd. - Key news
Tech Mahindra Ltd. - Key offerings
Tech Mahindra Ltd. - Segment focus
SWOT

15.17 Thoughtworks Holding Inc.

Thoughtworks Holding Inc. - Overview
Thoughtworks Holding Inc. - Product / Service
Thoughtworks Holding Inc. - Key offerings
SWOT

15.18 Wipro Ltd.

Wipro Ltd. - Overview
Wipro Ltd. - Business segments
Wipro Ltd. - Key news
Wipro Ltd. - Key offerings
Wipro Ltd. - Segment focus
SWOT

16. Appendix

16.1 Scope of the report

Market definition
Objectives
Notes and caveats

16.2 Inclusions and exclusions checklist

Inclusions checklist
Exclusions checklist

16.3 Currency conversion rates for US$

16.4 Research methodology

16.5 Data procurement

Information sources

16.6 Data validation

16.7 Validation techniques employed for market sizing

16.8 Data synthesis

16.9 360 degree market analysis

16.10 List of abbreviations

Research Methodology

Technavio presents a detailed picture of the market by way of study, synthesis, and summation of data from multiple sources. The analysts have presented the various facets of the market with a particular focus on identifying the key industry influencers. The data thus presented is comprehensive, reliable, and the result of extensive research, both primary and secondary.

INFORMATION SOURCES

Primary sources

  • Manufacturers and suppliers
  • Channel partners
  • Industry experts
  • Strategic decision makers

Secondary sources

  • Industry journals and periodicals
  • Government data
  • Financial reports of key industry players
  • Historical data
  • Press releases

DATA ANALYSIS

Data Synthesis

  • Collation of data
  • Estimation of key figures
  • Analysis of derived insights

Data Validation

  • Triangulation with data models
  • Reference against proprietary databases
  • Corroboration with industry experts

REPORT WRITING

Qualitative

  • Market drivers
  • Market challenges
  • Market trends
  • Five forces analysis

Quantitative

  • Market size and forecast
  • Market segmentation
  • Geographical insights
  • Competitive landscape

Interested in this report?

Get your sample now to see our research methodology and insights!

Download Now

Frequently Asked Questions

Web Development market growth will increase by USD 42540.3 million during 2026-2030.

The Web Development market is expected to grow at a CAGR of 9.9% during 2026-2030.

Web Development market is segmented by End-user (Retail and e-commerce, BFSI, IT and telecom, Healthcare, Others) Business segment (SMEs, Large enterprise) Deployment (Cloud-based, On-premises, Hybrid)

Accenture Plc, BairesDev LLC, Capgemini SE, Cognizant Technology Solution, Cyient Ltd., Datamatics Global Services Ltd., Endava plc, EPAM Systems Inc., Globant SA, HCL Technologies Ltd., Hexaware Technologies Ltd., Infosys Ltd., LTIMindtree Ltd., Mphasis Ltd., Persistent Systems Ltd., SoftServe Inc., Tata Consultancy Services, Tech Mahindra Ltd., Thoughtworks Holding Inc., Virtusa Corp., Wipro Ltd., Zensar Technologies Inc. are a few of the key vendors in the Web Development market.

North America will register the highest growth rate of 29.2% among the other regions. Therefore, the Web Development market in North America is expected to garner significant business opportunities for the vendors during the forecast period.

US, Canada, Mexico, Germany, UK, France, Italy, Spain, The Netherlands, China, Japan, India, South Korea, Australia, Indonesia, Brazil, Argentina, Chile, Saudi Arabia, UAE, South Africa, Israel, Turkey

  • Growing digital commerce expansion across industries is the driving factor this market.

The Web Development market vendors should focus on grabbing business opportunities from the End-user segment as it accounted for the largest market share in the base year.
RIA - Research AI Assistant
Ask RIA
