Whipping Cream Market Analysis, Size, and Forecast 2024-2028: North America (US and Canada), Europe (France, Germany, Italy, and UK), Middle East and Africa (Egypt, KSA, Oman, and UAE), APAC (China, India, and Japan), South America (Argentina and Brazil), and Rest of World (ROW)

Whipping Cream Market Analysis, Size, and Forecast 2024-2028:
North America (US and Canada), Europe (France, Germany, Italy, and UK), Middle East and Africa (Egypt, KSA, Oman, and UAE), APAC (China, India, and Japan), South America (Argentina and Brazil), and Rest of World (ROW)

Published: May 2024 165 Pages SKU: IRTNTR43727

Market Overview at a Glance

$1.77 B
Market Opportunity
5.42%
CAGR
5.04
YoY growth 2023-2024(%)

Whipping Cream Market Size 2024-2028

The whipping cream market size is forecast to increase by USD 1.77 billion, at a CAGR of 5.42% between 2023 and 2028.

  • The market is witnessing significant growth, driven by the increasing number of cafes and the rising demand for organic whipping cream. These trends reflect the evolving consumer preference for premium and healthier dairy products. However, the market faces challenges, including the growing incidence of lactose intolerance, which poses a significant obstacle to market expansion. Producers must innovate to cater to this segment by developing lactose-free or low-lactose whipping cream alternatives. Despite this, the market is expected to continue its growth trajectory, fueled by the versatility of whipping cream in various applications, including cakes, sauces, and baked goods.
  • This strategic response will enable companies to tap into the untapped potential of the lactose-intolerant population while maintaining market competitiveness. Overall, the market presents a compelling growth opportunity for businesses that can effectively address consumer demands and navigate the challenges presented by lactose intolerance.

What will be the Size of the Whipping Cream Market during the forecast period?

Whipping Cream Market Size

Explore in-depth regional segment analysis with market size data - historical 2018-2022 and forecasts 2024-2028 - in the full report.  
Request Free Sample

The market continues to evolve, with dynamic market dynamics shaping its growth and applications across various sectors. The continuous unfolding of market activities is influenced by numerous factors, including sensory evaluation parameters, emulsifier selection, antioxidant preservation methods, and viscosity and stability. These factors are interconnected, with processing temperature effects and ingredient sourcing criteria impacting flavor compound interaction and sensory attribute profiling. Packaging material selection plays a crucial role in maintaining storage temperature stability and inhibiting microbial growth. Churning process efficiency and homogenization process optimization are essential for producing consistent whipped cream with desirable texture and aeration. The sweetener type influence on whipping cream's taste profile and shelf life extension is a significant consideration.

Stabilizer functionality, protein denaturation prevention, and overrun percentage optimization are also critical aspects of ensuring product quality and consistency. Foam structure analysis, fat content measurement, and emulsion stability testing are essential for understanding the complex interplay of whipping cream's components. Cream aging techniques and fat crystallization control further contribute to the evolving nature of this market.

How is this Whipping Cream Industry segmented?

The whipping cream industry research report provides comprehensive data (region-wise segment analysis), with forecasts and estimates in "USD million" for the period 2024-2028, as well as historical data from 2018-2022 for the following segments.

  • Distribution Channel
    • Offline
    • Online
  • Product
    • Dairy-based
    • Non-dairy-based
  • Application
    • Bakery & Confectionery
    • Dairy Products
    • Desserts
    • Beverages
    • Savory Dishes
  • Fat Content
    • High Fat
    • Low Fat
    • Fat-Free
  • Form
    • Aerosol Can
    • Liquid
    • Powder
  • Geography
    • North America
      • US
      • Canada
    • Europe
      • France
      • Germany
      • Italy
      • UK
    • Middle East and Africa
      • Egypt
      • KSA
      • Oman
      • UAE
    • APAC
      • China
      • India
      • Japan
    • South America
      • Argentina
      • Brazil
    • Rest of World (ROW)

By Distribution Channel Insights

The offline segment is estimated to witness significant growth during the forecast period.

The offline the market is a substantial segment in the food industry, encompassing a diverse range of products to cater to various consumer preferences. Supermarkets, hypermarkets, and specialty stores remain pivotal players in this market, offering consumers the opportunity for direct product evaluation before purchase. The tactile and sensory experience of shopping in a physical environment is particularly crucial for whipping cream, as consumers often prioritize visual inspection to ensure product quality. Brand reputation and consumer trust are essential factors influencing the offline the market. Well-established retail chains with long-standing brand names contribute significantly to the market's growth.

The selection of emulsifiers and antioxidant preservation methods is crucial to maintain viscosity and stability, ensuring a desirable whipped cream texture. Microbial contamination risk is a critical concern, necessitating rigorous quality control testing and product consistency evaluation. Air incorporation methods, such as churning and homogenization, play a vital role in achieving the desired overrun percentage and whipping time. Whipping cream density, fat content, and emulsion stability testing are essential factors in ensuring product quality. Shelf life extension and stabilizer functionality are essential considerations to maintain dairy protein stability and prevent protein denaturation. Packaging material impact and microbial growth inhibition are essential factors in maintaining product quality and safety.

Flavor compound interaction and sensory attribute profiling are crucial in creating a harmonious balance of taste and texture. Fat crystallization control and foam structure analysis are essential to ensure the desired whipped cream texture and consistency.

Whipping Cream Market Size

Request Free Sample

The Offline segment was valued at USD 3.79 billion in 2018 and showed a gradual increase during the forecast period.

Regional Analysis

North America is estimated to contribute 35% to the growth of the global market during the forecast period.Technavio's analysts have elaborately explained the regional trends and drivers that shape the market during the forecast period.

Whipping Cream Market Share by Geography

 Request Free Sample

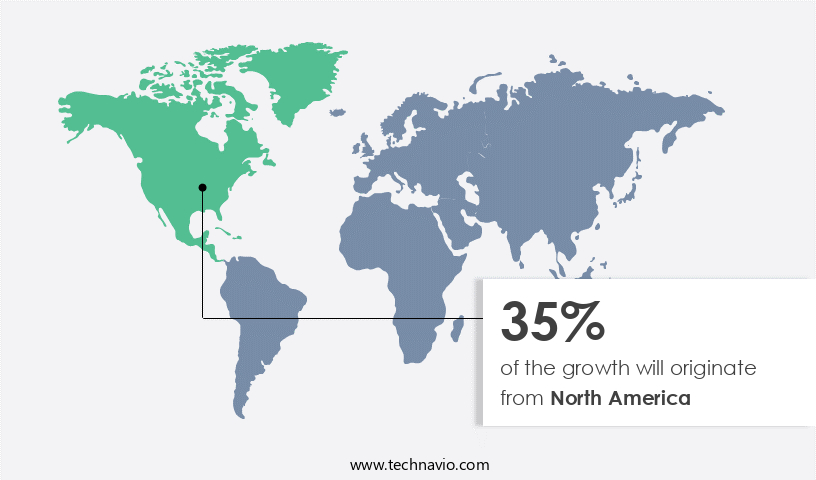
In the dynamic US market, whipping cream continues to be a preferred topping for various food applications, particularly in bakery products and specialty coffee. With an increasing number of coffee shops and the popularity of bakery items, the demand for whipping cream is anticipated to thrive. Globally, the US and Canada lead the market due to their high demand for coffee and over 25,000 chain specialty coffee shops. To cater to health-conscious consumers, companies are introducing fat-free whipping cream options. Emulsifiers are crucial in whipping cream production, ensuring desirable viscosity and stability. Antioxidant preservation methods are essential to maintain product quality and extend shelf life.

Microbial contamination risk necessitates rigorous quality control testing and product consistency evaluation. Air incorporation methods and storage temperature stability impact whipping cream's texture and density. Processing temperature effects and ingredient sourcing criteria influence protein denaturation prevention and dairy protein stability. Flavor compound interaction and sensory attribute profiling are critical for optimizing consumer satisfaction. Packaging material impact and microbial growth inhibition techniques ensure product safety and freshness. Churning process efficiency, sweetener type influence, and homogenization process are key factors for producing consistent, high-quality whipping cream. Fat crystallization control and emulsion stability testing are essential for maintaining optimal product characteristics.

Market Dynamics

The global whipping cream market is experiencing dynamic shifts, driven by evolving whipping cream market trends and a rising preference for diverse options. While dairy whipping cream remains a staple, the burgeoning demand for non-dairy whipping cream and plant-based whipping cream underscores a significant consumer shift towards vegan alternatives. The convenience of aerosol whipping cream and the extended shelf life of UHT whipping cream are key market drivers. Various whipping cream applications span from confectionery, where bakery whipping cream is essential, to beverages and savory dishes. The heavy whipping cream segment continues to dominate in traditional uses, but organic whipping cream and clean label whipping cream are gaining traction. This robust whipping cream industry growth is attracting numerous whipping cream manufacturers aiming to capture a larger whipping cream market share with innovative products like liquid whipping cream and specialized professional whipping cream.

Our researchers analyzed the data with 2023 as the base year, along with the key drivers, trends, and challenges. A holistic analysis of drivers will help companies refine their marketing strategies to gain a competitive advantage.

What are the key market drivers leading to the rise in the adoption of Whipping Cream Industry?

  • The proliferation of cafes serves as the primary catalyst for market growth. 
  • The market experiences growth due to its extensive application in foodservice industries, particularly in cafes and coffee shops. The popularity of whipped cream in beverages such as coffee, milkshakes, iced teas, hot chocolate, and various pastries and desserts has led to an increase in demand. The expanding urban population and the rise of white-collar workers have contributed to the growth of foodservice establishments, including cafes and coffee shops. Leading chains like Starbucks, Costa Coffee, and Dunkin Brands are expanding globally, fueled by diverse consumer preferences for high-quality coffee. In the production of whipping cream, sensory evaluation parameters such as taste, aroma, texture, and appearance play a significant role.
  • Emulsifier selection is crucial for achieving desirable viscosity and stability, while antioxidant preservation methods help maintain product quality. Microbial contamination risk is a concern, necessitating quality control testing and product consistency evaluation. Air incorporation methods, such as whipping or aeration, are essential for creating the characteristic light and fluffy texture of whipped cream.

What are the market trends shaping the Whipping Cream Industry?

  • The increasing preference for organic products is evident in the market, with whipping cream being no exception. The demand for organic whipping cream is on the rise and is expected to continue as a notable trend in the industry.
  • The market is driven by the increasing preference for natural and organic products, with organic whipping cream being a key contributor to market growth. Consumers are increasingly conscious of the food they consume and are seeking to reduce their intake of products containing chemical pesticides and fertilizers. To meet this demand, organic whipping cream is produced using raw materials that are organically sourced, ensuring the absence of synthetic additives. The production process of organic whipping cream involves careful consideration of storage temperature stability and processing temperature effects to preserve the product's quality. The flavor compounds in whipping cream can interact with packaging materials, affecting sensory attributes, and therefore, the choice of packaging material is crucial.
  • Moreover, microbial growth inhibition is a critical factor in ensuring the safety and shelf life of the product. Efficiency in the churning process is essential to maintain the desired texture and consistency of whipping cream. The market dynamics of whipping cream are influenced by various factors, including ingredient sourcing criteria, flavor compound interaction, sensory attribute profiling, packaging material impact, and microbial growth inhibition. These factors collectively contribute to the market's growth and development.

What challenges does the Whipping Cream Industry face during its growth?

  • Lactose intolerance, which is on the rise and poses a significant challenge, hinders the growth of the industry. 
  • The market experiences significant growth due to the increasing prevalence of lactose intolerance and food allergies. Lactose intolerance, a condition where the body cannot digest lactose, affects over 90% of East Asian people and a substantial portion of the population in other ethnicities. This condition limits the consumption of dairy products, leading to a surge in demand for lactose-free alternatives. Food allergies, including lactose intolerance, have reportedly increased by 18% in the US over the last decade. To cater to this demand, the whipping cream industry has responded by producing lactose-free options. These products undergo homogenization, a process that reduces the size of fat globules, ensuring a smoother texture and better mixing properties.
  • Stabilizers and sweeteners are often added to prevent protein denaturation during whipping, extending the shelf life and optimizing the overrun percentage. The optimization of whipping time is crucial to achieving the desired texture and consistency. The functionality of these additives is essential in maintaining the product's quality and enhancing its taste profile.

Exclusive Customer Landscape

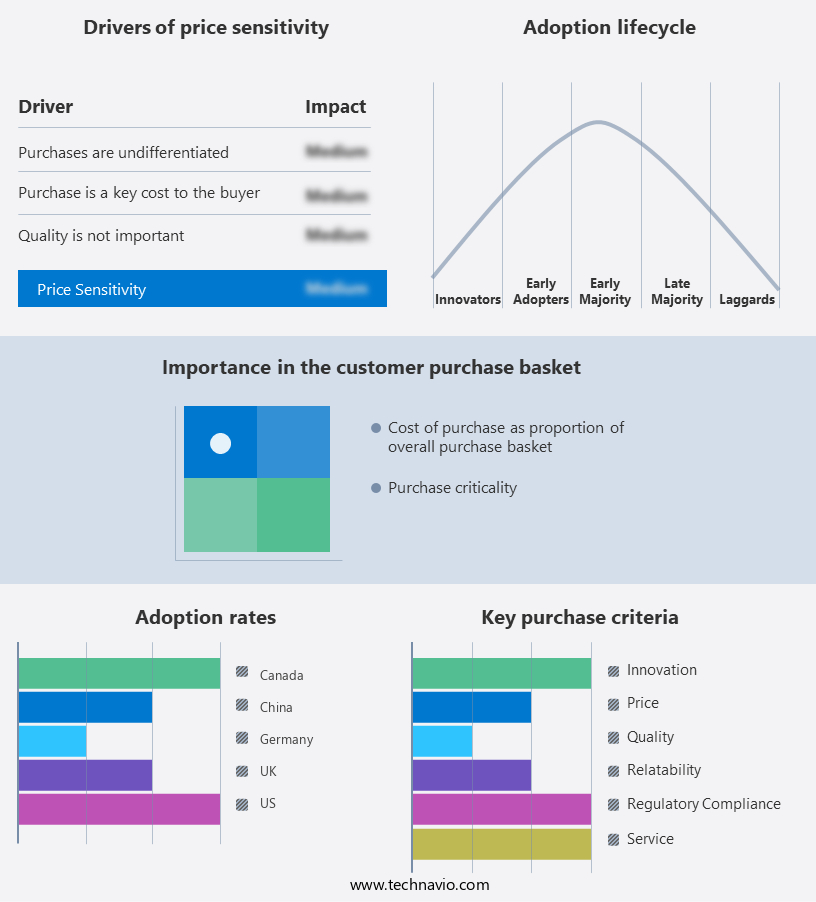
The whipping cream market forecasting report includes the adoption lifecycle of the market, covering from the innovator's stage to the laggard's stage. It focuses on adoption rates in different regions based on penetration. Furthermore, the whipping cream market report also includes key purchase criteria and drivers of price sensitivity to help companies evaluate and develop their market growth analysis strategies.

Whipping Cream Market Share by Geography

 Customer Landscape

Key Companies & Market Insights

Companies are implementing various strategies, such as strategic alliances, whipping cream market forecast, partnerships, mergers and acquisitions, geographical expansion, and product/service launches, to enhance their presence in the industry.

Agropur Dairy Cooperative - This company specializes in the development and distribution of innovative sports products, leveraging advanced technology and materials to enhance athlete performance and consumer experience. Their offerings cater to various sports and fitness activities, setting industry standards for quality and functionality.

The industry research and growth report includes detailed analyses of the competitive landscape of the market and information about key companies, including:

  • Agropur Dairy Cooperative
  • Arla Foods amba
  • Bakels Worldwide
  • Borden Dairy Company
  • Cabot Creamery
  • Califia Farms LLC
  • Conagra Brands Inc.
  • Dairy Farmers of America Inc.
  • DMK Deutsches Milchkontor GmbH
  • Gay Lea Foods Co operative Ltd.
  • Granarolo S.P.A.
  • Gujarat Cooperative Milk Marketing Federation Ltd.
  • Hanan Products Co. Inc.
  • Land O lakes Inc.
  • Natures Charm
  • Palsgaard AS
  • Rich Products Corp.
  • Royal FrieslandCampina NV
  • Tatua Co operative Dairy Co. Ltd.
  • The Kraft Heinz Co.

Qualitative and quantitative analysis of companies has been conducted to help clients understand the wider business environment as well as the strengths and weaknesses of key industry players. Data is qualitatively analyzed to categorize companies as pure play, category-focused, industry-focused, and diversified; it is quantitatively analyzed to categorize companies as dominant, leading, strong, tentative, and weak.

Recent Development and News in Whipping Cream Market

  • In January 2024, Fischer & Company, a leading dairy processor, introduced a new line of organic whipping cream in response to increasing consumer demand for natural and organic food products (Fischer & Company Press Release).
  • In March 2024, Danone and Lactalis, two major players in the global dairy industry, announced a strategic partnership to jointly invest in research and development for innovative whipping cream products, aiming to expand their market shares (Bloomberg).
  • In May 2024, Dairy Farmers of America, the largest dairy cooperative in the United States, completed the acquisition of a significant stake in a European whipping cream manufacturer, significantly expanding its presence in the global market (Dairy Farmers of America Press Release).
  • In February 2025, the European Commission approved a new regulation to reduce the saturated fat content in whipping cream, setting a maximum limit of 18% by weight (European Commission Press Release). This regulatory change is expected to influence the production and marketing strategies of whipping cream manufacturers in Europe.

Research Analyst Overview

  • In the dynamic market, shelf-life prediction models play a crucial role in ensuring product consistency and quality. Understanding the intricacies of whipping cream formulation and foam stability mechanisms is essential for cost-effective processing and process scalability assessment. Flavor release kinetics and quality assurance protocols are key factors in enhancing consumer satisfaction. Production efficiency analysis and waste reduction strategies are critical for optimizing processes and reducing costs. Chemical composition analysis, product standardization methods, and yield optimization techniques are essential for maintaining consistency and meeting consumer expectations. Ingredient interaction effects, rheological properties, and microbial load assessment are crucial in developing innovative whipping cream formulations.
  • Sensory descriptive analysis and packaging design considerations are vital in appealing to consumers' preferences. Furthermore, understanding fat globule aggregation and ingredient substitution effects can lead to novel ingredient applications and sustainable sourcing practices. Protein network formation and optimal whipping parameters are essential in achieving the desired texture and consistency. By implementing process optimization strategies and assessing the impact of various factors, whipping cream manufacturers can stay competitive in the market.

Dive into Technavio's robust research methodology, blending expert interviews, extensive data synthesis, and validated models for unparalleled Whipping Cream Market insights. See full methodology.

Market Scope

Report Coverage

Details

Page number

165

Base year

2023

Historic period

2018-2022

Forecast period

2024-2028

Growth momentum & CAGR

Accelerate at a CAGR of 5.42%

Market growth 2024-2028

USD 1771.9 million

Market structure

Fragmented

YoY growth 2023-2024(%)

5.04

Key countries

US, Canada, Germany, UK, Italy, France, China, India, Japan, Brazil, Egypt, UAE, Oman, Argentina, KSA, UAE, Brazil, and Rest of World (ROW)

Competitive landscape

Leading Companies, Market Positioning of Companies, Competitive Strategies, and Industry Risks

Request Free Sample

What are the Key Data Covered in this Whipping Cream Market Research and Growth Report?

  • CAGR of the Whipping Cream industry during the forecast period
  • Detailed information on factors that will drive the growth and forecasting between 2024 and 2028
  • Precise estimation of the size of the market and its contribution of the industry in focus to the parent market
  • Accurate predictions about upcoming growth and trends and changes in consumer behaviour
  • Growth of the market across North America, Europe, APAC, South America, and Middle East and Africa
  • Thorough analysis of the market's competitive landscape and detailed information about companies
  • Comprehensive analysis of factors that will challenge the whipping cream market growth of industry companies

We can help! Our analysts can customize this whipping cream market research report to meet your requirements.

Get in touch

1 Executive Summary

  • 1.1 Market overview
    • Executive Summary - Chart on Market Overview
    • Executive Summary - Data Table on Market Overview
    • Executive Summary - Chart on Global Market Characteristics
    • Executive Summary - Chart on Market by Geography
    • Executive Summary - Chart on Market Segmentation by Distribution Channel
    • Executive Summary - Chart on Market Segmentation by Product
    • Executive Summary - Chart on Incremental Growth
    • Executive Summary - Data Table on Incremental Growth
    • Executive Summary - Chart on Company Market Positioning

2 Market Landscape

  • 2.1 Market ecosystem
    • Parent Market
    • Data Table on - Parent Market
  • 2.2 Market characteristics
    • Market characteristics analysis
  • 2.3 Value chain analysis
    • Value Chain Analysis

3 Market Sizing

  • 3.1 Market definition
    • Offerings of companies included in the market definition
  • 3.2 Market segment analysis
    • Market segments
  • 3.3 Market size 2023
    • 3.4 Market outlook: Forecast for 2023-2028
      • Chart on Global - Market size and forecast 2023-2028 ($ million)
      • Data Table on Global - Market size and forecast 2023-2028 ($ million)
      • Chart on Global Market: Year-over-year growth 2023-2028 (%)
      • Data Table on Global Market: Year-over-year growth 2023-2028 (%)

    4 Historic Market Size

    • 4.1 Global Whipping Cream Market 2018 - 2022
      • Historic Market Size - Data Table on Global Whipping Cream Market 2018 - 2022 ($ million)
    • 4.2 Distribution Channel segment analysis 2018 - 2022
      • Historic Market Size - Distribution Channel Segment 2018 - 2022 ($ million)
    • 4.3 Product segment analysis 2018 - 2022
      • Historic Market Size - Product Segment 2018 - 2022 ($ million)
    • 4.4 Geography segment analysis 2018 - 2022
      • Historic Market Size - Geography Segment 2018 - 2022 ($ million)
    • 4.5 Country segment analysis 2018 - 2022
      • Historic Market Size - Country Segment 2018 - 2022 ($ million)

    5 Five Forces Analysis

    • 5.1 Five forces summary
      • Five forces analysis - Comparison between 2023 and 2028
    • 5.2 Bargaining power of buyers
      • Bargaining power of buyers - Impact of key factors 2023 and 2028
    • 5.3 Bargaining power of suppliers
      • Bargaining power of suppliers - Impact of key factors in 2023 and 2028
    • 5.4 Threat of new entrants
      • Threat of new entrants - Impact of key factors in 2023 and 2028
    • 5.5 Threat of substitutes
      • Threat of substitutes - Impact of key factors in 2023 and 2028
    • 5.6 Threat of rivalry
      • Threat of rivalry - Impact of key factors in 2023 and 2028
    • 5.7 Market condition
      • Chart on Market condition - Five forces 2023 and 2028

    6 Market Segmentation by Distribution Channel

    • 6.1 Market segments
      • Chart on Distribution Channel - Market share (2023-2028) (%)
      • Data Table on Distribution Channel - Market share (2023-2028) (%)
    • 6.2 Comparison by Distribution Channel
      • Chart on Comparison by Distribution Channel
      • Data Table on Comparison by Distribution Channel
    • 6.3 Offline - Market size and forecast (2023-2028)
      • Chart on Offline - Market size and forecast (2023-2028) ($ million)
      • Data Table on Offline - Market size and forecast (2023-2028) ($ million)
      • Chart on Offline - Year-over-year growth (2023-2028) (%)
      • Data Table on Offline - Year-over-year growth (2023-2028) (%)
    • 6.4 Online - Market size and forecast (2023-2028)
      • Chart on Online - Market size and forecast (2023-2028) ($ million)
      • Data Table on Online - Market size and forecast (2023-2028) ($ million)
      • Chart on Online - Year-over-year growth (2023-2028) (%)
      • Data Table on Online - Year-over-year growth (2023-2028) (%)
    • 6.5 Market opportunity by Distribution Channel
      • Market opportunity by Distribution Channel ($ million)
      • Data Table on Market opportunity by Distribution Channel ($ million)

    7 Market Segmentation by Product

    • 7.1 Market segments
      • Chart on Product - Market share (2023-2028) (%)
      • Data Table on Product - Market share (2023-2028) (%)
    • 7.2 Comparison by Product
      • Chart on Comparison by Product
      • Data Table on Comparison by Product
    • 7.3 Dairy-based - Market size and forecast (2023-2028)
      • Chart on Dairy-based - Market size and forecast (2023-2028) ($ million)
      • Data Table on Dairy-based - Market size and forecast (2023-2028) ($ million)
      • Chart on Dairy-based - Year-over-year growth (2023-2028) (%)
      • Data Table on Dairy-based - Year-over-year growth (2023-2028) (%)
    • 7.4 Non-dairy-based - Market size and forecast (2023-2028)
      • Chart on Non-dairy-based - Market size and forecast (2023-2028) ($ million)
      • Data Table on Non-dairy-based - Market size and forecast (2023-2028) ($ million)
      • Chart on Non-dairy-based - Year-over-year growth (2023-2028) (%)
      • Data Table on Non-dairy-based - Year-over-year growth (2023-2028) (%)
    • 7.5 Market opportunity by Product
      • Market opportunity by Product ($ million)
      • Data Table on Market opportunity by Product ($ million)

    8 Market Segmentation by Application

    • 8.1 Market segments
      • Chart on Application - Market share (2023-2028) (%)
      • Data Table on Application - Market share (2023-2028) (%)
    • 8.2 Comparison by Application
      • Chart on Comparison by Application
      • Data Table on Comparison by Application
    • 8.3 Bakery & Confectionery - Market size and forecast (2023-2028)
      • Chart on Bakery & Confectionery - Market size and forecast (2023-2028) ($ million)
      • Data Table on Bakery & Confectionery - Market size and forecast (2023-2028) ($ million)
      • Chart on Bakery & Confectionery - Year-over-year growth (2023-2028) (%)
      • Data Table on Bakery & Confectionery - Year-over-year growth (2023-2028) (%)
    • 8.4 Dairy Products - Market size and forecast (2023-2028)
      • Chart on Dairy Products - Market size and forecast (2023-2028) ($ million)
      • Data Table on Dairy Products - Market size and forecast (2023-2028) ($ million)
      • Chart on Dairy Products - Year-over-year growth (2023-2028) (%)
      • Data Table on Dairy Products - Year-over-year growth (2023-2028) (%)
    • 8.5 Desserts - Market size and forecast (2023-2028)
      • Chart on Desserts - Market size and forecast (2023-2028) ($ million)
      • Data Table on Desserts - Market size and forecast (2023-2028) ($ million)
      • Chart on Desserts - Year-over-year growth (2023-2028) (%)
      • Data Table on Desserts - Year-over-year growth (2023-2028) (%)
    • 8.6 Beverages - Market size and forecast (2023-2028)
      • Chart on Beverages - Market size and forecast (2023-2028) ($ million)
      • Data Table on Beverages - Market size and forecast (2023-2028) ($ million)
      • Chart on Beverages - Year-over-year growth (2023-2028) (%)
      • Data Table on Beverages - Year-over-year growth (2023-2028) (%)
    • 8.7 Savory Dishes - Market size and forecast (2023-2028)
      • Chart on Savory Dishes - Market size and forecast (2023-2028) ($ million)
      • Data Table on Savory Dishes - Market size and forecast (2023-2028) ($ million)
      • Chart on Savory Dishes - Year-over-year growth (2023-2028) (%)
      • Data Table on Savory Dishes - Year-over-year growth (2023-2028) (%)
    • 8.8 Market opportunity by Application
      • Market opportunity by Application ($ million)
      • Data Table on Market opportunity by Application ($ million)

    9 Market Segmentation by Fat Content

    • 9.1 Market segments
      • Chart on Fat Content - Market share (2023-2028) (%)
      • Data Table on Fat Content - Market share (2023-2028) (%)
    • 9.2 Comparison by Fat Content
      • Chart on Comparison by Fat Content
      • Data Table on Comparison by Fat Content
    • 9.3 High Fat - Market size and forecast (2023-2028)
      • Chart on High Fat - Market size and forecast (2023-2028) ($ million)
      • Data Table on High Fat - Market size and forecast (2023-2028) ($ million)
      • Chart on High Fat - Year-over-year growth (2023-2028) (%)
      • Data Table on High Fat - Year-over-year growth (2023-2028) (%)
    • 9.4 Low Fat - Market size and forecast (2023-2028)
      • Chart on Low Fat - Market size and forecast (2023-2028) ($ million)
      • Data Table on Low Fat - Market size and forecast (2023-2028) ($ million)
      • Chart on Low Fat - Year-over-year growth (2023-2028) (%)
      • Data Table on Low Fat - Year-over-year growth (2023-2028) (%)
    • 9.5 Fat-Free - Market size and forecast (2023-2028)
      • Chart on Fat-Free - Market size and forecast (2023-2028) ($ million)
      • Data Table on Fat-Free - Market size and forecast (2023-2028) ($ million)
      • Chart on Fat-Free - Year-over-year growth (2023-2028) (%)
      • Data Table on Fat-Free - Year-over-year growth (2023-2028) (%)
    • 9.6 Market opportunity by Fat Content
      • Market opportunity by Fat Content ($ million)
      • Data Table on Market opportunity by Fat Content ($ million)

    10 Market Segmentation by Form

    • 10.1 Market segments
      • Chart on Form - Market share (2023-2028) (%)
      • Data Table on Form - Market share (2023-2028) (%)
    • 10.2 Comparison by Form
      • Chart on Comparison by Form
      • Data Table on Comparison by Form
    • 10.3 Aerosol Can - Market size and forecast (2023-2028)
      • Chart on Aerosol Can - Market size and forecast (2023-2028) ($ million)
      • Data Table on Aerosol Can - Market size and forecast (2023-2028) ($ million)
      • Chart on Aerosol Can - Year-over-year growth (2023-2028) (%)
      • Data Table on Aerosol Can - Year-over-year growth (2023-2028) (%)
    • 10.4 Liquid - Market size and forecast (2023-2028)
      • Chart on Liquid - Market size and forecast (2023-2028) ($ million)
      • Data Table on Liquid - Market size and forecast (2023-2028) ($ million)
      • Chart on Liquid - Year-over-year growth (2023-2028) (%)
      • Data Table on Liquid - Year-over-year growth (2023-2028) (%)
    • 10.5 Powder - Market size and forecast (2023-2028)
      • Chart on Powder - Market size and forecast (2023-2028) ($ million)
      • Data Table on Powder - Market size and forecast (2023-2028) ($ million)
      • Chart on Powder - Year-over-year growth (2023-2028) (%)
      • Data Table on Powder - Year-over-year growth (2023-2028) (%)
    • 10.6 Market opportunity by Form
      • Market opportunity by Form ($ million)
      • Data Table on Market opportunity by Form ($ million)

    11 Customer Landscape

    • 11.1 Customer landscape overview
      • Analysis of price sensitivity, lifecycle, customer purchase basket, adoption rates, and purchase criteria

    12 Geographic Landscape

    • 12.1 Geographic segmentation
      • Chart on Market share by geography 2023-2028 (%)
      • Data Table on Market share by geography 2023-2028 (%)
    • 12.2 Geographic comparison
      • Chart on Geographic comparison
      • Data Table on Geographic comparison
    • 12.3 North America - Market size and forecast 2023-2028
      • Chart on North America - Market size and forecast 2023-2028 ($ million)
      • Data Table on North America - Market size and forecast 2023-2028 ($ million)
      • Chart on North America - Year-over-year growth 2023-2028 (%)
      • Data Table on North America - Year-over-year growth 2023-2028 (%)
    • 12.4 Europe - Market size and forecast 2023-2028
      • Chart on Europe - Market size and forecast 2023-2028 ($ million)
      • Data Table on Europe - Market size and forecast 2023-2028 ($ million)
      • Chart on Europe - Year-over-year growth 2023-2028 (%)
      • Data Table on Europe - Year-over-year growth 2023-2028 (%)
    • 12.5 APAC - Market size and forecast 2023-2028
      • Chart on APAC - Market size and forecast 2023-2028 ($ million)
      • Data Table on APAC - Market size and forecast 2023-2028 ($ million)
      • Chart on APAC - Year-over-year growth 2023-2028 (%)
      • Data Table on APAC - Year-over-year growth 2023-2028 (%)
    • 12.6 South America - Market size and forecast 2023-2028
      • Chart on South America - Market size and forecast 2023-2028 ($ million)
      • Data Table on South America - Market size and forecast 2023-2028 ($ million)
      • Chart on South America - Year-over-year growth 2023-2028 (%)
      • Data Table on South America - Year-over-year growth 2023-2028 (%)
    • 12.7 Middle East and Africa - Market size and forecast 2023-2028
      • Chart on Middle East and Africa - Market size and forecast 2023-2028 ($ million)
      • Data Table on Middle East and Africa - Market size and forecast 2023-2028 ($ million)
      • Chart on Middle East and Africa - Year-over-year growth 2023-2028 (%)
      • Data Table on Middle East and Africa - Year-over-year growth 2023-2028 (%)
    • 12.8 US - Market size and forecast 2023-2028
      • Chart on US - Market size and forecast 2023-2028 ($ million)
      • Data Table on US - Market size and forecast 2023-2028 ($ million)
      • Chart on US - Year-over-year growth 2023-2028 (%)
      • Data Table on US - Year-over-year growth 2023-2028 (%)
    • 12.9 China - Market size and forecast 2023-2028
      • Chart on China - Market size and forecast 2023-2028 ($ million)
      • Data Table on China - Market size and forecast 2023-2028 ($ million)
      • Chart on China - Year-over-year growth 2023-2028 (%)
      • Data Table on China - Year-over-year growth 2023-2028 (%)
    • 12.10 Canada - Market size and forecast 2023-2028
      • Chart on Canada - Market size and forecast 2023-2028 ($ million)
      • Data Table on Canada - Market size and forecast 2023-2028 ($ million)
      • Chart on Canada - Year-over-year growth 2023-2028 (%)
      • Data Table on Canada - Year-over-year growth 2023-2028 (%)
    • 12.11 Germany - Market size and forecast 2023-2028
      • Chart on Germany - Market size and forecast 2023-2028 ($ million)
      • Data Table on Germany - Market size and forecast 2023-2028 ($ million)
      • Chart on Germany - Year-over-year growth 2023-2028 (%)
      • Data Table on Germany - Year-over-year growth 2023-2028 (%)
    • 12.12 UK - Market size and forecast 2023-2028
      • Chart on UK - Market size and forecast 2023-2028 ($ million)
      • Data Table on UK - Market size and forecast 2023-2028 ($ million)
      • Chart on UK - Year-over-year growth 2023-2028 (%)
      • Data Table on UK - Year-over-year growth 2023-2028 (%)
    • 12.13 Market opportunity by geography
      • Market opportunity by geography ($ million)
      • Data Tables on Market opportunity by geography ($ million)
    • 12.14 Italy - Market size and forecast (2023-2028)
      • Chart on Italy - Market size and forecast (2023-2028) ($ million)
      • Data Table on Italy - Market size and forecast (2023-2028) ($ million)
      • Chart on Italy - Year-over-year growth (2023-2028) (%)
      • Data Table on Italy - Year-over-year growth (2023-2028) (%)
    • 12.15 France - Market size and forecast (2023-2028)
      • Chart on France - Market size and forecast (2023-2028) ($ million)
      • Data Table on France - Market size and forecast (2023-2028) ($ million)
      • Chart on France - Year-over-year growth (2023-2028) (%)
      • Data Table on France - Year-over-year growth (2023-2028) (%)
    • 12.16 India - Market size and forecast (2023-2028)
      • Chart on India - Market size and forecast (2023-2028) ($ million)
      • Data Table on India - Market size and forecast (2023-2028) ($ million)
      • Chart on India - Year-over-year growth (2023-2028) (%)
      • Data Table on India - Year-over-year growth (2023-2028) (%)
    • 12.17 Japan - Market size and forecast (2023-2028)
      • Chart on Japan - Market size and forecast (2023-2028) ($ million)
      • Data Table on Japan - Market size and forecast (2023-2028) ($ million)
      • Chart on Japan - Year-over-year growth (2023-2028) (%)
      • Data Table on Japan - Year-over-year growth (2023-2028) (%)
    • 12.18 Brazil - Market size and forecast (2023-2028)
      • Chart on Brazil - Market size and forecast (2023-2028) ($ million)
      • Data Table on Brazil - Market size and forecast (2023-2028) ($ million)
      • Chart on Brazil - Year-over-year growth (2023-2028) (%)
      • Data Table on Brazil - Year-over-year growth (2023-2028) (%)
    • 12.19 Egypt - Market size and forecast (2023-2028)
      • Chart on Egypt - Market size and forecast (2023-2028) ($ million)
      • Data Table on Egypt - Market size and forecast (2023-2028) ($ million)
      • Chart on Egypt - Year-over-year growth (2023-2028) (%)
      • Data Table on Egypt - Year-over-year growth (2023-2028) (%)
    • 12.20 UAE - Market size and forecast (2023-2028)
      • Chart on UAE - Market size and forecast (2023-2028) ($ million)
      • Data Table on UAE - Market size and forecast (2023-2028) ($ million)
      • Chart on UAE - Year-over-year growth (2023-2028) (%)
      • Data Table on UAE - Year-over-year growth (2023-2028) (%)
    • 12.21 Oman - Market size and forecast (2023-2028)
      • Chart on Oman - Market size and forecast (2023-2028) ($ million)
      • Data Table on Oman - Market size and forecast (2023-2028) ($ million)
      • Chart on Oman - Year-over-year growth (2023-2028) (%)
      • Data Table on Oman - Year-over-year growth (2023-2028) (%)
    • 12.22 Argentina - Market size and forecast (2023-2028)
      • Chart on Argentina - Market size and forecast (2023-2028) ($ million)
      • Data Table on Argentina - Market size and forecast (2023-2028) ($ million)
      • Chart on Argentina - Year-over-year growth (2023-2028) (%)
      • Data Table on Argentina - Year-over-year growth (2023-2028) (%)
    • 12.23 KSA - Market size and forecast (2023-2028)
      • Chart on KSA - Market size and forecast (2023-2028) ($ million)
      • Data Table on KSA - Market size and forecast (2023-2028) ($ million)
      • Chart on KSA - Year-over-year growth (2023-2028) (%)
      • Data Table on KSA - Year-over-year growth (2023-2028) (%)
    • 12.24 Rest of World (ROW) - Market size and forecast (2023-2028)
      • Chart on Rest of World (ROW) - Market size and forecast (2023-2028) ($ million)
      • Data Table on Rest of World (ROW) - Market size and forecast (2023-2028) ($ million)
      • Chart on Rest of World (ROW) - Year-over-year growth (2023-2028) (%)
      • Data Table on Rest of World (ROW) - Year-over-year growth (2023-2028) (%)

    13 Drivers, Challenges, and Opportunity/Restraints

    • 13.1 Market drivers
      • 13.2 Market challenges
        • 13.3 Impact of drivers and challenges
          • Impact of drivers and challenges in 2023 and 2028
        • 13.4 Market opportunities/restraints

          14 Competitive Landscape

          • 14.1 Overview
            • 14.2 Competitive Landscape
              • Overview on criticality of inputs and factors of differentiation
            • 14.3 Landscape disruption
              • Overview on factors of disruption
            • 14.4 Industry risks
              • Impact of key risks on business

            15 Competitive Analysis

            • 15.1 Companies profiled
              • Companies covered
            • 15.2 Market positioning of companies
              • Matrix on companies position and classification
            • 15.3 Agropur Dairy Cooperative
              • Agropur Dairy Cooperative - Overview
              • Agropur Dairy Cooperative - Product / Service
              • Agropur Dairy Cooperative - Key offerings
            • 15.4 Arla Foods amba
              • Arla Foods amba - Overview
              • Arla Foods amba - Product / Service
              • Arla Foods amba - Key offerings
            • 15.5 Bakels Worldwide
              • Bakels Worldwide - Overview
              • Bakels Worldwide - Product / Service
              • Bakels Worldwide - Key offerings
            • 15.6 Cabot Creamery
              • Cabot Creamery - Overview
              • Cabot Creamery - Product / Service
              • Cabot Creamery - Key offerings
            • 15.7 Califia Farms LLC
              • Califia Farms LLC - Overview
              • Califia Farms LLC - Product / Service
              • Califia Farms LLC - Key news
              • Califia Farms LLC - Key offerings
            • 15.8 Conagra Brands Inc.
              • Conagra Brands Inc. - Overview
              • Conagra Brands Inc. - Business segments
              • Conagra Brands Inc. - Key news
              • Conagra Brands Inc. - Key offerings
              • Conagra Brands Inc. - Segment focus
            • 15.9 Dairy Farmers of America Inc.
              • Dairy Farmers of America Inc. - Overview
              • Dairy Farmers of America Inc. - Product / Service
              • Dairy Farmers of America Inc. - Key offerings
            • 15.10 DMK Deutsches Milchkontor GmbH
              • DMK Deutsches Milchkontor GmbH - Overview
              • DMK Deutsches Milchkontor GmbH - Product / Service
              • DMK Deutsches Milchkontor GmbH - Key offerings
            • 15.11 Gay Lea Foods Co operative Ltd.
              • Gay Lea Foods Co operative Ltd. - Overview
              • Gay Lea Foods Co operative Ltd. - Product / Service
              • Gay Lea Foods Co operative Ltd. - Key offerings
            • 15.12 Granarolo S.P.A.
              • Granarolo S.P.A. - Overview
              • Granarolo S.P.A. - Product / Service
              • Granarolo S.P.A. - Key offerings
            • 15.13 Gujarat Cooperative Milk Marketing Federation Ltd.
              • Gujarat Cooperative Milk Marketing Federation Ltd. - Overview
              • Gujarat Cooperative Milk Marketing Federation Ltd. - Product / Service
              • Gujarat Cooperative Milk Marketing Federation Ltd. - Key offerings
            • 15.14 Palsgaard AS
              • Palsgaard AS - Overview
              • Palsgaard AS - Product / Service
              • Palsgaard AS - Key offerings
            • 15.15 Rich Products Corp.
              • Rich Products Corp. - Overview
              • Rich Products Corp. - Product / Service
              • Rich Products Corp. - Key offerings
            • 15.16 Royal FrieslandCampina NV
              • Royal FrieslandCampina NV - Overview
              • Royal FrieslandCampina NV - Business segments
              • Royal FrieslandCampina NV - Key offerings
              • Royal FrieslandCampina NV - Segment focus
            • 15.17 The Kraft Heinz Co.
              • The Kraft Heinz Co. - Overview
              • The Kraft Heinz Co. - Business segments
              • The Kraft Heinz Co. - Key news
              • The Kraft Heinz Co. - Key offerings
              • The Kraft Heinz Co. - Segment focus

            16 Appendix

            • 16.1 Scope of the report
              • 16.2 Inclusions and exclusions checklist
                • Inclusions checklist
                • Exclusions checklist
              • 16.3 Currency conversion rates for US$
                • Currency conversion rates for US$
              • 16.4 Research methodology
                • Research methodology
              • 16.5 Data procurement
                • Information sources
              • 16.6 Data validation
                • Data validation
              • 16.7 Validation techniques employed for market sizing
                • Validation techniques employed for market sizing
              • 16.8 Data synthesis
                • Data synthesis
              • 16.9 360 degree market analysis
                • 360 degree market analysis
              • 16.10 List of abbreviations
                • List of abbreviations

              Research Methodology

              Technavio presents a detailed picture of the market by way of study, synthesis, and summation of data from multiple sources. The analysts have presented the various facets of the market with a particular focus on identifying the key industry influencers. The data thus presented is comprehensive, reliable, and the result of extensive research, both primary and secondary.

              INFORMATION SOURCES

              Primary sources

              • Manufacturers and suppliers
              • Channel partners
              • Industry experts
              • Strategic decision makers

              Secondary sources

              • Industry journals and periodicals
              • Government data
              • Financial reports of key industry players
              • Historical data
              • Press releases

              DATA ANALYSIS

              Data Synthesis

              • Collation of data
              • Estimation of key figures
              • Analysis of derived insights

              Data Validation

              • Triangulation with data models
              • Reference against proprietary databases
              • Corroboration with industry experts

              REPORT WRITING

              Qualitative

              • Market drivers
              • Market challenges
              • Market trends
              • Five forces analysis

              Quantitative

              • Market size and forecast
              • Market segmentation
              • Geographical insights
              • Competitive landscape

              Interested in this report?

              Get your sample now to see our research methodology and insights!

              Download Now

              Frequently Asked Questions

              Whipping Cream market growth will increase by $ 1771.9 mn during 2024-2028 .

              The Whipping Cream market is expected to grow at a CAGR of 5.42% during 2024-2028 .

              Whipping Cream market is segmented by Distribution Channel( Offline, Online) Product( Dairy-based, Non-dairy-based, APAC, South America, MEA)

              Agropur Dairy Cooperative, Arla Foods amba, Bakels Worldwide, Borden Dairy Company, Cabot Creamery, Califia Farms LLC, Conagra Brands Inc., Dairy Farmers of America Inc., DMK Deutsches Milchkontor GmbH, Gay Lea Foods Co operative Ltd., Granarolo S.P.A., Gujarat Cooperative Milk Marketing Federation Ltd., Hanan Products Co. Inc., Land O lakes Inc., Natures Charm, Palsgaard AS, Rich Products Corp., Royal FrieslandCampina NV, Tatua Co operative Dairy Co. Ltd., The Kraft Heinz Co. are a few of the key vendors in the Whipping Cream market.

              North America will register the highest growth rate of 35% among the other regions. Therefore, the Whipping Cream market in North America is expected to garner significant business opportunities for the vendors during the forecast period.

              US, Canada, Germany, UK, Italy, France, China, India, Japan, Brazil, Egypt, UAE, Oman, Argentina, KSA, UAE, Brazil, Rest of World (ROW)

              • Increasing number of cafesThe rise in the number of cafes and coffee shops is a driving factor for the market. This is because whipped cream is widely used in beverages like coffee is the driving factor this market.
              • milkshakes is the driving factor this market.
              • iced teas is the driving factor this market.
              • hot chocolate is the driving factor this market.
              • and others. Several cafes also offer pastries is the driving factor this market.
              • cupcakes is the driving factor this market.
              • waffles is the driving factor this market.
              • scones is the driving factor this market.
              • and other food products where whipping cream is used as a topping. The increased influx of people to urban regions is the driving factor this market.
              • along with a sizable white-collar populace is the driving factor this market.
              • has resulted in an increase in the number of foodservice establishments. The rise of specialized coffee shops has been fueled by diverse tastes and preferences for quality coffee. Leading cafe chains such as Starbucks is the driving factor this market.
              • Costa Coffee is the driving factor this market.
              • and Dunkin Brands are expanding into many growing Asian and South American economies.The number of coffee chains that offer products like iced coffee has attracted the attention of the youth. The growth in infrastructures like new airports and expressways in developing countries also gives major coffee chains the scope to establish their outlets and is expected to contribute to the growth of the market in focus during the forecast period. is the driving factor this market.

              The Whipping Cream market vendors should focus on grabbing business opportunities from the Offline segment as it accounted for the largest market share in the base year.