White Spirits Market Analysis, Size, and Forecast 2025-2029: APAC (China, Japan, and India), Europe (Germany, UK, and France), North America (US, Canada, and Mexico), Middle East and Africa (Saudi Arabia, UAE, and South Africa), South America (Brazil, Argentina, and Colombia), and Rest of World (ROW)

White Spirits Market Analysis, Size, and Forecast 2025-2029:
APAC (China, Japan, and India), Europe (Germany, UK, and France), North America (US, Canada, and Mexico), Middle East and Africa (Saudi Arabia, UAE, and South Africa), South America (Brazil, Argentina, and Colombia), and Rest of World (ROW)

Published: Dec 2025 299 Pages SKU: IRTNTR73746

Market Overview at a Glance

$2.29 B
Market Opportunity
5.7%
CAGR 2024 - 2029
35.2%
APAC Growth
$2.01 B
Thinner and solvent segment 2023

White Spirits Market Size 2025-2029

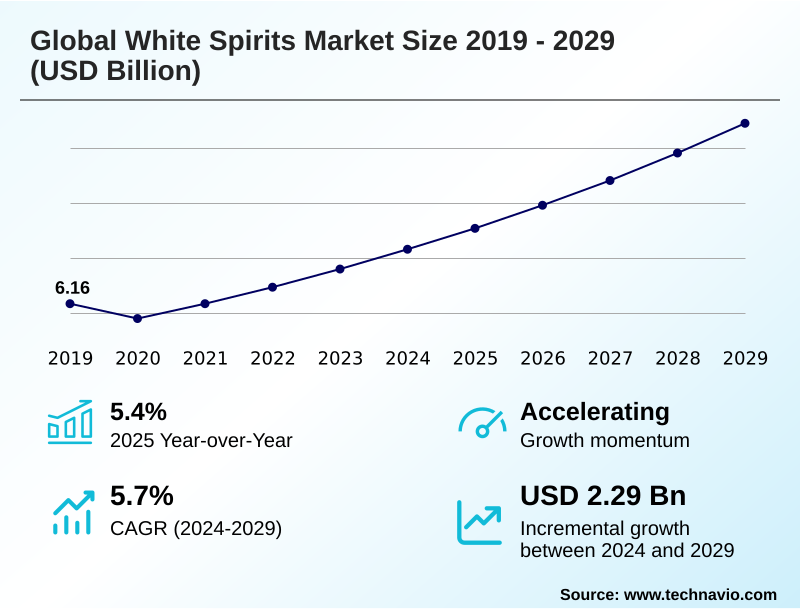
The white spirits market size is valued to increase by USD 2.29 billion, at a CAGR of 5.7% from 2024 to 2029. Growing usage of white spirits as cleaning and degreasing agent will drive the white spirits market.

Major Market Trends & Insights

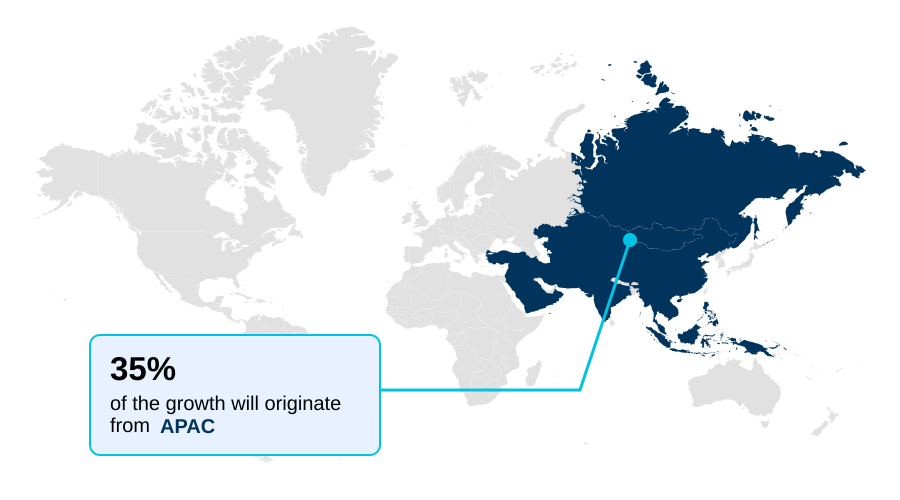
  • APAC dominated the market and accounted for a 35.2% growth during the forecast period.
  • By Application - Thinner and solvent segment was valued at USD 2.01 billion in 2023
  • By Grade Type - Regular flash segment accounted for the largest market revenue share in 2023

Market Size & Forecast

  • Market Opportunities: USD 3.27 billion
  • Market Future Opportunities: USD 2.29 billion
  • CAGR from 2024 to 2029 : 5.7%

Market Summary

  • The white spirits market is undergoing a significant transformation, balancing its foundational role in industries like paints and coatings with a pressing need for environmental responsibility. Demand is sustained by the performance of these hydrocarbon-based solvent products as a paint thinner formulation and an industrial degreasing agent. However, concerns over volatile organic compounds are reshaping the landscape.
  • A key business scenario involves a manufacturer reformulating its product line away from standard petroleum distillate to a low aromatic white spirit. This requires significant R&D investment in processes like hydrodesulfurization and solvent extraction to produce dearomatized solvent options, such as type 3 hydrogenated spirits, which offer lower toxicity.
  • This strategic pivot aims to meet stricter regulatory compliance for VOCs while maintaining the high solvency power and controlled evaporation rate that industrial customers depend on. The success of this transition hinges on balancing cost, performance, and sustainability, with a focus on developing eco-friendly solvent alternatives and bio-based solvent technology.
  • The market's future direction will be defined by the ability of producers to innovate within these constraints, offering products that are both effective and compliant.

What will be the Size of the White Spirits Market during the forecast period?

Get Key Insights on Market Forecast (PDF) Request Free Sample

How is the White Spirits Market Segmented?

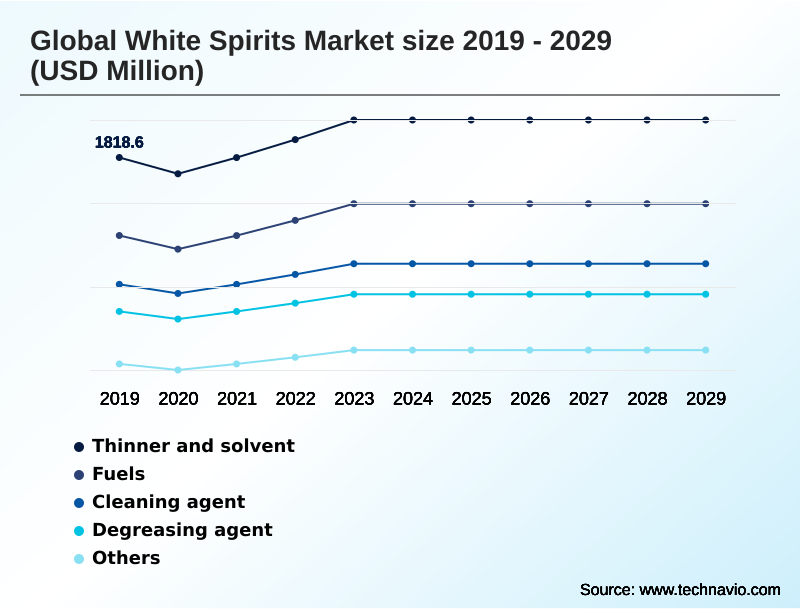
The white spirits industry research report provides comprehensive data (region-wise segment analysis), with forecasts and estimates in "USD million" for the period 2025-2029, as well as historical data from 2019-2023 for the following segments.

  • Application
    • Thinner and solvent
    • Fuels
    • Cleaning agent
    • Degreasing agent
    • Others
  • Grade type
    • Regular flash
    • Low flash
    • High flash
  • Product type
    • Type 1
    • Type 2
    • Type 3
    • Type 0
  • Geography
    • APAC
      • China
      • Japan
      • India
    • Europe
      • Germany
      • UK
      • France
    • North America
      • US
      • Canada
      • Mexico
    • Middle East and Africa
      • Saudi Arabia
      • UAE
      • South Africa
    • South America
      • Brazil
      • Argentina
      • Colombia
    • Rest of World (ROW)

By Application Insights

The thinner and solvent segment is estimated to witness significant growth during the forecast period.

The thinner and solvent segment is the principal application, driven by its use in adjusting the viscosity of oil-based paints and coatings.

A critical dynamic is the market's evolution from traditional options like stoddard solvent toward low aromatic white spirit alternatives, a move accelerated by stringent regulations.

This is evident in architectural coatings thinner formulations, where manufacturers are compelled to reduce volatile organic compounds. Formulations using type 1 hydrodesulfurized solvents are being refined for compliance while retaining high solvency power.

The effectiveness of a paint thinner formulation is judged by its evaporation rate, with new variants improving coating uniformity by over 15%.

This involves careful selection of a hydrocarbon-based solvent via specialty chemical distribution, ensuring safe solvent handling and adherence to occupational exposure limits for a safer industrial surface cleaning process.

These developments also consider eco-friendly solvent alternatives and the product's flash point determination.

Request Free Sample

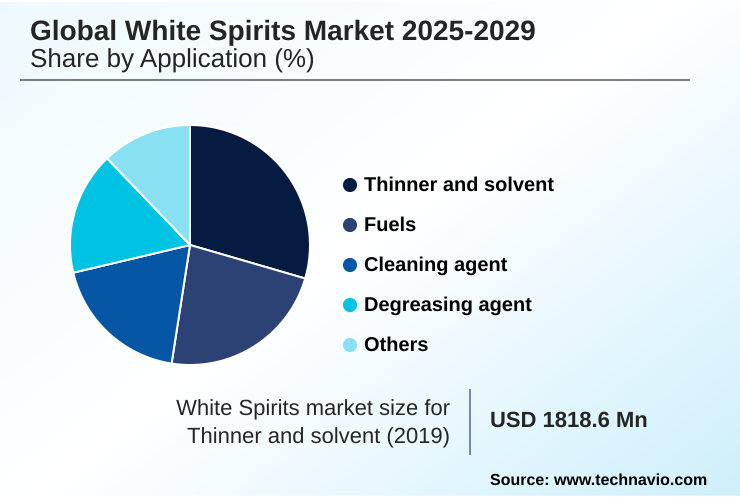
The Thinner and solvent segment was valued at USD 2.01 billion in 2023 and showed a gradual increase during the forecast period.

Request Free Sample

Regional Analysis

APAC is estimated to contribute 35.2% to the growth of the global market during the forecast period.Technavio’s analysts have elaborately explained the regional trends and drivers that shape the market during the forecast period.

See How White Spirits Market Demand is Rising in APAC Request Free Sample

The geographic landscape is diverse. APAC leads with over 35% of incremental growth, driven by construction industry chemicals demand. Here, type 0 straight-run products and those with a low flash point remain common.

In contrast, North America and Europe prioritize low VOC coating formulation and high-purity aliphatic solvent products for uses like precision cleaning solvent applications.

This has spurred demand for spirits with a high flash point for safer industrial use, such as in metalworking fluid and rubber industry solvent applications. European regulations have driven a 50% increase in compliant coatings adoption.

Demand is also shaped by specialized regional industries, including oil and gas exploration chemicals in the Middle East, bitumen extraction in Canada, and use as a pharmaceutical extraction solvent.

This varied demand influences the use of different solvent grades, including those produced via solvent extraction.

Market Dynamics

Our researchers analyzed the data with 2024 as the base year, along with the key drivers, trends, and challenges. A holistic analysis of drivers will help companies refine their marketing strategies to gain a competitive advantage.

  • Understanding the white spirits market requires a deep dive into its technical nuances. A common query is about low aromatic content white spirit uses, which are primarily in applications demanding lower toxicity and odor, such as indoor coatings. The hydrodesulfurization process for solvents is a key technology for achieving this, reducing impurities and aromatic compounds.
  • This leads to questions about Type 3 hydrogenated solvent properties, which include high purity and minimal environmental impact, making them ideal for sensitive applications. In contrast, the flash point of regular mineral spirits makes it a versatile choice for general workshop use. Navigating VOC limits in industrial coatings is a major compliance challenge, driving the market toward cleaner alternatives.
  • This also brings up the classic question of stoddard solvent vs mineral turpentine, where differences in distillation range and composition dictate their best use. For operational safety, protocols for the safe handling of aliphatic hydrocarbons are paramount, as is understanding the evaporation rate of paint thinners for achieving a desired finish.
  • The technical side of production involves processes like solvent extraction in petroleum refining, which separates aromatic from aliphatic components. The resulting dearomatized solvents for cleaning offer superior safety profiles. For heavy-duty tasks, a high flash point degreasing agent is preferred. The versatility extends to white spirit in adhesive formulation and as a key component in automotive paint thinner specifications.
  • Stakeholders are increasingly exploring alternatives to petroleum distillate solvents and biodegradable substitutes for mineral spirits.
  • The market also includes niche applications for Type 0 straight-run naphtha applications, making it crucial to understand the right product for specific tasks, from enhancing solvency power for industrial resins to choosing solvents for wood preservatives and adhering to regulatory standards for dry cleaning fluids, all while considering the environmental impact of hydrocarbon solvents.
  • The complexity is evident, as solvent choice impacts performance more than cost-effectiveness in many scenarios. For instance, using the correct solvent can improve process efficiency by over 20% compared to a cheaper, less suitable alternative.

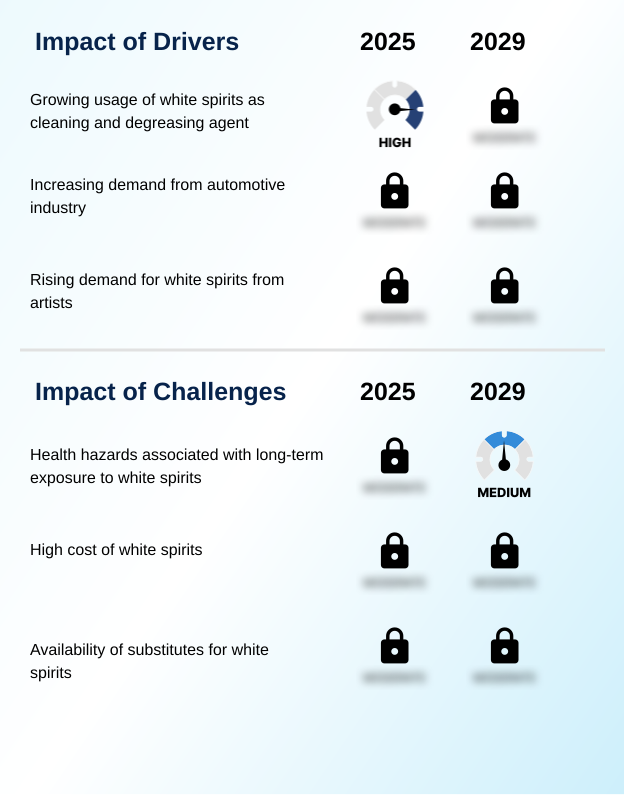
What are the key market drivers leading to the rise in the adoption of White Spirits Industry?

  • The market is primarily driven by the expanding use of white spirits as an effective and affordable cleaning and degreasing agent in various industrial and household applications.

  • A primary market driver is its widespread use as a cleaning and degreasing agent.
  • The solvency power of aliphatic hydrocarbons makes them highly effective for industrial surface cleaning, with studies showing they can reduce cleaning times by up to 25% compared to some water-based degreaser alternatives.
  • This efficiency is critical in the automotive industry for automotive refinishing solvent applications and general maintenance.
  • The demand is also bolstered by its utility as a wood preservative and in dry cleaning fluid formulations, where a low flash point is often required.
  • The versatility of petroleum distillate products, including their role as a chemical synthesis intermediate, supports steady demand.
  • Increased adoption of odorless mineral spirits for indoor applications has broadened their appeal, part of a larger push for bio-based solvent technology and creating a non-toxic degreaser.

What are the market trends shaping the White Spirits Industry?

  • A key market trend is the rising demand from the global construction industry. This is driven by increased use in paints and coatings for new infrastructure and residential projects.

  • A significant trend is the rising demand from the construction industry, fueling consumption for protective coating application and as a paint viscosity modifier. With infrastructure investments growing over 10% in key emerging markets, the need for these solvents is escalating.
  • This is complemented by its role as an industrial degreasing agent, where formulations with a regular flash point, like mineral turpentine, are preferred. The demand for a fast-drying solvent is another key factor. Furthermore, there is a rising demand for type 2 solvent-extracted products in specialized uses like adhesive formulation.
  • This trend is pushing innovation towards biodegradable hydrocarbon solvent options, with new applications emerging in bitumen-based waterproofing and as an agrochemical solvent carrier, expanding beyond traditional uses as a printing ink solvent. New formulations reduce drying time by 15%.

What challenges does the White Spirits Industry face during its growth?

  • A significant challenge restraining market growth is the documented health hazards associated with long-term exposure to white spirits, leading to stricter safety regulations and handling protocols.

  • Significant market challenges stem from the health risks associated with the aromatic hydrocarbon content in many formulations, necessitating strict regulatory compliance for VOCs. The availability of substitutes, such as water-based solvent alternatives, presents a persistent challenge, capturing up to 30% of the market share in certain categories like textile cleaning agent products.
  • The cost and complexity of implementing solvent recovery systems can also be a barrier. Moreover, the process of solvent extraction and subsequent treatment to produce dearomatized solvent types like type 3 hydrogenated spirits adds to production costs, which can be 15-20% higher than for untreated variants. The industry also faces scrutiny over the environmental impact of petroleum refining byproduct streams.
  • These challenges are driving research into bio-based solvent development and advanced hydrodesulfurization techniques to produce cleaner products for uses like pesticide formulation and as an aerosol propellant.

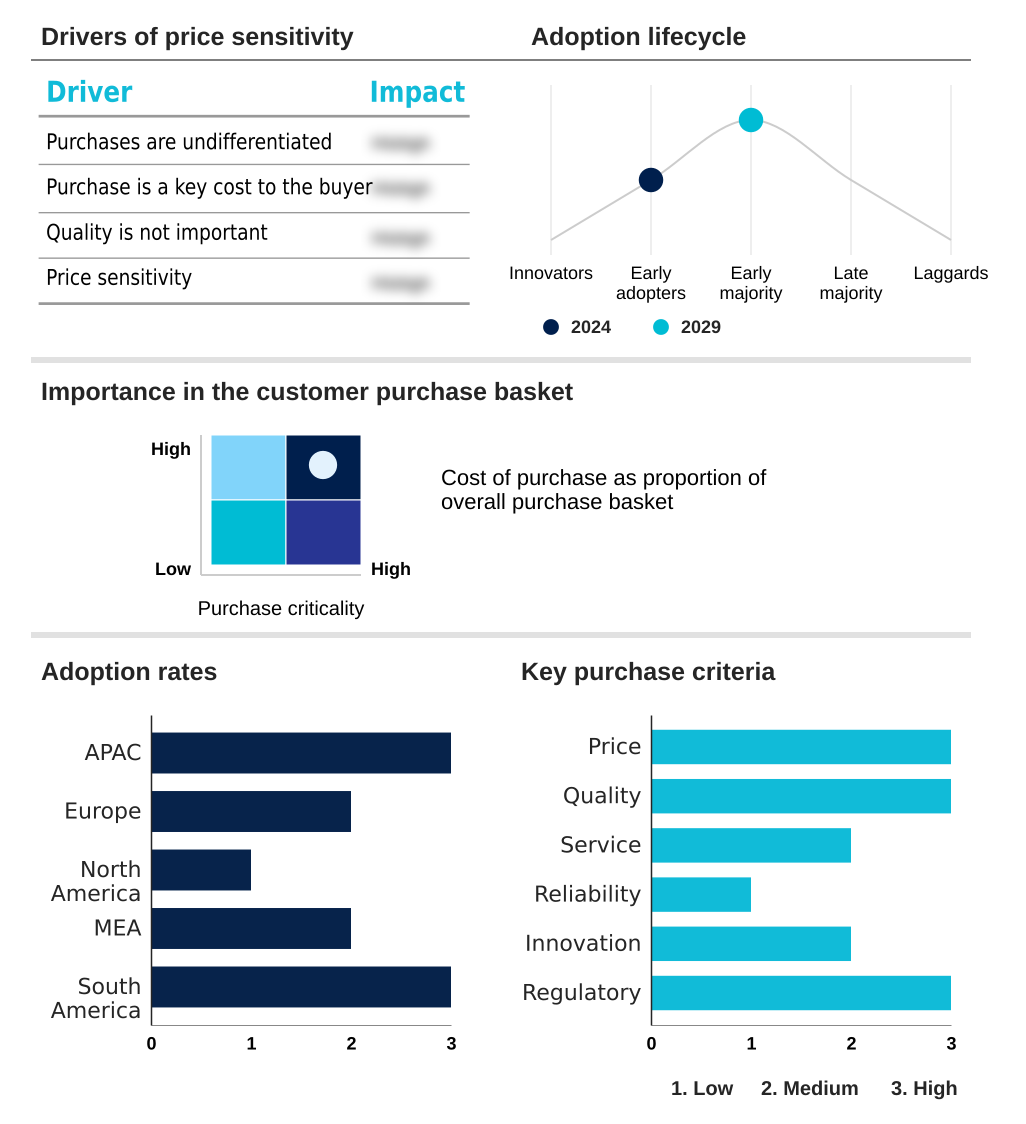
Exclusive Technavio Analysis on Customer Landscape

The white spirits market forecasting report includes the adoption lifecycle of the market, covering from the innovator’s stage to the laggard’s stage. It focuses on adoption rates in different regions based on penetration. Furthermore, the white spirits market report also includes key purchase criteria and drivers of price sensitivity to help companies evaluate and develop their market growth analysis strategies.

Customer Landscape of White Spirits Industry

Competitive Landscape

Companies are implementing various strategies, such as strategic alliances, white spirits market forecast, partnerships, mergers and acquisitions, geographical expansion, and product/service launches, to enhance their presence in the industry.

2M Holdings Ltd. - Vendors focus on providing high-purity hydrocarbon solvents, including refined white spirits, engineered for diverse industrial processes demanding specific performance characteristics.

The industry research and growth report includes detailed analyses of the competitive landscape of the market and information about key companies, including:

  • 2M Holdings Ltd.
  • Al Oga Factory
  • Al Sanea Chemical Products
  • Bharat Petroleum Corp. Ltd.
  • Compania Espanola de Petroleos SA
  • DHC Solvent Chemie GmbH
  • Exxon Mobil Corp.
  • G.S.B Chemical Co. Pty. Ltd.
  • Haltermann Carless
  • HCS Group GmbH
  • Indian Oil Corp. Ltd.
  • KH Chemicals BV
  • Neste Corp.
  • Pure Chemicals Co. Ltd
  • Rebain International
  • Sel Chemie BV
  • Shanghai Chemex Group Ltd.
  • Shell plc
  • TotalEnergies SE
  • Vizag Chemical International

Qualitative and quantitative analysis of companies has been conducted to help clients understand the wider business environment as well as the strengths and weaknesses of key industry players. Data is qualitatively analyzed to categorize companies as pure play, category-focused, industry-focused, and diversified; it is quantitatively analyzed to categorize companies as dominant, leading, strong, tentative, and weak.

Recent Development and News in White spirits market

  • In August 2024, HCS Group GmbH announced its proactive compliance plan in anticipation of new proposed regulations for stricter VOC content limits in industrial maintenance coatings.
  • In January 2025, TotalEnergies SE launched a pilot program with industrial partners to test advanced solvent recovery and recycling techniques, aiming to create a circular economy model for hydrocarbon-based solvents.
  • In March 2025, Shell plc announced a significant expansion of its eco-friendly solvent portfolio, introducing a new line of biodegradable, low-aromatic white spirits to meet stringent regulatory frameworks.
  • In April 2025, in response to China's newly unveiled draft environmental code, Shanghai Chemex Group Ltd. announced a strategic shift to prioritize green and low-carbon production technologies for its solvent offerings.

Dive into Technavio’s robust research methodology, blending expert interviews, extensive data synthesis, and validated models for unparalleled White Spirits Market insights. See full methodology.

Market Scope
Page number 299
Base year 2024
Historic period 2019-2023
Forecast period 2025-2029
Growth momentum & CAGR Accelerate at a CAGR of 5.7%
Market growth 2025-2029 USD 2291.0 million
Market structure Fragmented
YoY growth 2024-2025(%) 5.4%
Key countries China, Japan, India, South Korea, Australia, Indonesia, Germany, UK, France, Italy, The Netherlands, Spain, US, Canada, Mexico, Saudi Arabia, UAE, South Africa, Israel, Turkey, Brazil, Argentina and Colombia
Competitive landscape Leading Companies, Market Positioning of Companies, Competitive Strategies, and Industry Risks

Request Free Sample

Research Analyst Overview

  • The white spirits market is evolving beyond its identity as a simple petroleum distillate. Boardroom decisions now center on a strategic pivot toward sustainable chemistry, driven by the need to manage volatile organic compounds and aromatic hydrocarbon content.
  • This has intensified focus on refining processes like hydrodesulfurization and solvent extraction, creating a clear distinction between a basic type 0 straight-run product and a highly refined type 3 hydrogenated or dearomatized solvent. Formulations featuring aliphatic hydrocarbons now achieve up to a 40% VOC reduction while matching the solvency power of traditional stoddard solvent.
  • Product specification is critical, defined by characteristics like evaporation rate and whether a regular flash point, low flash point, or high flash point is required.
  • This impacts its use across a vast range of applications: from a paint thinner formulation and industrial degreasing agent to more specialized roles as a printing ink solvent, aerosol propellant, wood preservative, dry cleaning fluid, metalworking fluid, rubber industry solvent, pesticide formulation, chemical synthesis intermediate, and in adhesive formulation.
  • The nuances between type 1 hydrodesulfurized and type 2 solvent-extracted grades, as well as products like mineral turpentine and naphtha solvent, are crucial for applications ranging from bitumen extraction to household cleaning product lines.

What are the Key Data Covered in this White Spirits Market Research and Growth Report?

  • What is the expected growth of the White Spirits Market between 2025 and 2029?

    • USD 2.29 billion, at a CAGR of 5.7%

  • What segmentation does the market report cover?

    • The report is segmented by Application (Thinner and solvent, Fuels, Cleaning agent, Degreasing agent, Others), Grade Type (Regular flash, Low flash, High flash), Product Type (Type 1, Type 2, Type 3, Type 0) and Geography (APAC, Europe, North America, Middle East and Africa, South America)

  • Which regions are analyzed in the report?

    • APAC, Europe, North America, Middle East and Africa and South America

  • What are the key growth drivers and market challenges?

    • Growing usage of white spirits as cleaning and degreasing agent, Health hazards associated with long-term exposure to white spirits

  • Who are the major players in the White Spirits Market?

    • 2M Holdings Ltd., Al Oga Factory, Al Sanea Chemical Products, Bharat Petroleum Corp. Ltd., Compania Espanola de Petroleos SA, DHC Solvent Chemie GmbH, Exxon Mobil Corp., G.S.B Chemical Co. Pty. Ltd., Haltermann Carless, HCS Group GmbH, Indian Oil Corp. Ltd., KH Chemicals BV, Neste Corp., Pure Chemicals Co. Ltd, Rebain International, Sel Chemie BV, Shanghai Chemex Group Ltd., Shell plc, TotalEnergies SE and Vizag Chemical International

Market Research Insights

  • The market is shaped by the dual pressures of industrial performance and environmental sustainability. While demand for effective resin and polymer solvent solutions remains strong, there is a notable shift toward a circular economy for solvents, with adoption of recycling technologies increasing by over 15% in regulated markets.
  • The development of products that serve as both a drilling fluid component and a cleaner solvent represents a key innovation area. Compared to five years ago, formulations with lower VOC content now account for a 30% greater share of the specialty chemicals market, reflecting successful alignment with compliance goals without compromising performance.

We can help! Our analysts can customize this white spirits market research report to meet your requirements.

Get in touch

1. Executive Summary

1.1 Market overview

Executive Summary - Chart on Market Overview
Executive Summary - Data Table on Market Overview
Executive Summary - Chart on Global Market Characteristics
Executive Summary - Chart on Market by Geography
Executive Summary - Chart on Market Segmentation by Application
Executive Summary - Chart on Market Segmentation by Grade Type
Executive Summary - Chart on Market Segmentation by Product Type
Executive Summary - Chart on Incremental Growth
Executive Summary - Data Table on Incremental Growth
Executive Summary - Chart on Company Market Positioning

2. Technavio Analysis

2.1 Analysis of price sensitivity, lifecycle, customer purchase basket, adoption rates, and purchase criteria

2.2 Criticality of inputs and Factors of differentiation

Chart on Overview on criticality of inputs and factors of differentiation

2.3 Factors of disruption

Chart on Overview on factors of disruption

2.4 Impact of drivers and challenges

Chart on Impact of drivers and challenges in 2024 and 2029

3. Market Landscape

3.1 Market ecosystem

Chart on Parent Market
Data Table on - Parent Market

3.2 Market characteristics

Chart on Market characteristics analysis

3.3 Value chain analysis

Chart on Value chain analysis

4. Market Sizing

4.1 Market definition

Data Table on Offerings of companies included in the market definition

4.2 Market segment analysis

Market segments

4.3 Market size 2024

4.4 Market outlook: Forecast for 2024-2029

Chart on Global - Market size and forecast 2024-2029 ($ million)
Data Table on Global - Market size and forecast 2024-2029 ($ million)
Chart on Global Market: Year-over-year growth 2024-2029 (%)
Data Table on Global Market: Year-over-year growth 2024-2029 (%)

5. Historic Market Size

5.1 Global White Spirits Market 2019 - 2023

Historic Market Size - Data Table on Global White Spirits Market 2019 - 2023 ($ million)

5.2 Application segment analysis 2019 - 2023

Historic Market Size - Application Segment 2019 - 2023 ($ million)

5.3 Grade Type segment analysis 2019 - 2023

Historic Market Size - Grade Type Segment 2019 - 2023 ($ million)

5.4 Product Type segment analysis 2019 - 2023

Historic Market Size - Product Type Segment 2019 - 2023 ($ million)

5.5 Geography segment analysis 2019 - 2023

Historic Market Size - Geography Segment 2019 - 2023 ($ million)

5.6 Country segment analysis 2019 - 2023

Historic Market Size - Country Segment 2019 - 2023 ($ million)

6. Qualitative Analysis

6.1 The AI impact on Global White Spirits Market

7. Five Forces Analysis

7.1 Five forces summary

Five forces analysis - Comparison between 2024 and 2029

7.2 Bargaining power of buyers

Bargaining power of buyers - Impact of key factors 2024 and 2029

7.3 Bargaining power of suppliers

Bargaining power of suppliers - Impact of key factors in 2024 and 2029

7.4 Threat of new entrants

Threat of new entrants - Impact of key factors in 2024 and 2029

7.5 Threat of substitutes

Threat of substitutes - Impact of key factors in 2024 and 2029

7.6 Threat of rivalry

Threat of rivalry - Impact of key factors in 2024 and 2029

7.7 Market condition

Chart on Market condition - Five forces 2024 and 2029

8. Market Segmentation by Application

8.1 Market segments

Chart on Application - Market share 2024-2029 (%)
Data Table on Application - Market share 2024-2029 (%)

8.2 Comparison by Application

Chart on Comparison by Application
Data Table on Comparison by Application

8.3 Thinner and solvent - Market size and forecast 2024-2029

Chart on Thinner and solvent - Market size and forecast 2024-2029 ($ million)
Data Table on Thinner and solvent - Market size and forecast 2024-2029 ($ million)
Chart on Thinner and solvent - Year-over-year growth 2024-2029 (%)
Data Table on Thinner and solvent - Year-over-year growth 2024-2029 (%)

8.4 Fuels - Market size and forecast 2024-2029

Chart on Fuels - Market size and forecast 2024-2029 ($ million)
Data Table on Fuels - Market size and forecast 2024-2029 ($ million)
Chart on Fuels - Year-over-year growth 2024-2029 (%)
Data Table on Fuels - Year-over-year growth 2024-2029 (%)

8.5 Cleaning agent - Market size and forecast 2024-2029

Chart on Cleaning agent - Market size and forecast 2024-2029 ($ million)
Data Table on Cleaning agent - Market size and forecast 2024-2029 ($ million)
Chart on Cleaning agent - Year-over-year growth 2024-2029 (%)
Data Table on Cleaning agent - Year-over-year growth 2024-2029 (%)

8.6 Degreasing agent - Market size and forecast 2024-2029

Chart on Degreasing agent - Market size and forecast 2024-2029 ($ million)
Data Table on Degreasing agent - Market size and forecast 2024-2029 ($ million)
Chart on Degreasing agent - Year-over-year growth 2024-2029 (%)
Data Table on Degreasing agent - Year-over-year growth 2024-2029 (%)

8.7 Others - Market size and forecast 2024-2029

Chart on Others - Market size and forecast 2024-2029 ($ million)
Data Table on Others - Market size and forecast 2024-2029 ($ million)
Chart on Others - Year-over-year growth 2024-2029 (%)
Data Table on Others - Year-over-year growth 2024-2029 (%)

8.8 Market opportunity by Application

Market opportunity by Application ($ million)
Data Table on Market opportunity by Application ($ million)

9. Market Segmentation by Grade Type

9.1 Market segments

Chart on Grade Type - Market share 2024-2029 (%)
Data Table on Grade Type - Market share 2024-2029 (%)

9.2 Comparison by Grade Type

Chart on Comparison by Grade Type
Data Table on Comparison by Grade Type

9.3 Regular flash - Market size and forecast 2024-2029

Chart on Regular flash - Market size and forecast 2024-2029 ($ million)
Data Table on Regular flash - Market size and forecast 2024-2029 ($ million)
Chart on Regular flash - Year-over-year growth 2024-2029 (%)
Data Table on Regular flash - Year-over-year growth 2024-2029 (%)

9.4 Low flash - Market size and forecast 2024-2029

Chart on Low flash - Market size and forecast 2024-2029 ($ million)
Data Table on Low flash - Market size and forecast 2024-2029 ($ million)
Chart on Low flash - Year-over-year growth 2024-2029 (%)
Data Table on Low flash - Year-over-year growth 2024-2029 (%)

9.5 High flash - Market size and forecast 2024-2029

Chart on High flash - Market size and forecast 2024-2029 ($ million)
Data Table on High flash - Market size and forecast 2024-2029 ($ million)
Chart on High flash - Year-over-year growth 2024-2029 (%)
Data Table on High flash - Year-over-year growth 2024-2029 (%)

9.6 Market opportunity by Grade Type

Market opportunity by Grade Type ($ million)
Data Table on Market opportunity by Grade Type ($ million)

10. Market Segmentation by Product Type

10.1 Market segments

Chart on Product Type - Market share 2024-2029 (%)
Data Table on Product Type - Market share 2024-2029 (%)

10.2 Comparison by Product Type

Chart on Comparison by Product Type
Data Table on Comparison by Product Type

10.3 Type 1 - Market size and forecast 2024-2029

Chart on Type 1 - Market size and forecast 2024-2029 ($ million)
Data Table on Type 1 - Market size and forecast 2024-2029 ($ million)
Chart on Type 1 - Year-over-year growth 2024-2029 (%)
Data Table on Type 1 - Year-over-year growth 2024-2029 (%)

10.4 Type 2 - Market size and forecast 2024-2029

Chart on Type 2 - Market size and forecast 2024-2029 ($ million)
Data Table on Type 2 - Market size and forecast 2024-2029 ($ million)
Chart on Type 2 - Year-over-year growth 2024-2029 (%)
Data Table on Type 2 - Year-over-year growth 2024-2029 (%)

10.5 Type 3 - Market size and forecast 2024-2029

Chart on Type 3 - Market size and forecast 2024-2029 ($ million)
Data Table on Type 3 - Market size and forecast 2024-2029 ($ million)
Chart on Type 3 - Year-over-year growth 2024-2029 (%)
Data Table on Type 3 - Year-over-year growth 2024-2029 (%)

10.6 Type 0 - Market size and forecast 2024-2029

Chart on Type 0 - Market size and forecast 2024-2029 ($ million)
Data Table on Type 0 - Market size and forecast 2024-2029 ($ million)
Chart on Type 0 - Year-over-year growth 2024-2029 (%)
Data Table on Type 0 - Year-over-year growth 2024-2029 (%)

10.7 Market opportunity by Product Type

Market opportunity by Product Type ($ million)
Data Table on Market opportunity by Product Type ($ million)

11. Customer Landscape

11.1 Customer landscape overview

Analysis of price sensitivity, lifecycle, customer purchase basket, adoption rates, and purchase criteria

12. Geographic Landscape

12.1 Geographic segmentation

Chart on Market share by geography 2024-2029 (%)
Data Table on Market share by geography 2024-2029 (%)

12.2 Geographic comparison

Chart on Geographic comparison
Data Table on Geographic comparison

12.3 APAC - Market size and forecast 2024-2029

Chart on APAC - Market size and forecast 2024-2029 ($ million)
Data Table on APAC - Market size and forecast 2024-2029 ($ million)
Chart on APAC - Year-over-year growth 2024-2029 (%)
Data Table on APAC - Year-over-year growth 2024-2029 (%)
Chart on Regional Comparison - APAC
Data Table on Regional Comparison - APAC

12.3.1 China - Market size and forecast 2024-2029

Chart on China - Market size and forecast 2024-2029 ($ million)
Data Table on China - Market size and forecast 2024-2029 ($ million)
Chart on China - Year-over-year growth 2024-2029 (%)
Data Table on China - Year-over-year growth 2024-2029 (%)

12.3.2 Japan - Market size and forecast 2024-2029

Chart on Japan - Market size and forecast 2024-2029 ($ million)
Data Table on Japan - Market size and forecast 2024-2029 ($ million)
Chart on Japan - Year-over-year growth 2024-2029 (%)
Data Table on Japan - Year-over-year growth 2024-2029 (%)

12.3.3 India - Market size and forecast 2024-2029

Chart on India - Market size and forecast 2024-2029 ($ million)
Data Table on India - Market size and forecast 2024-2029 ($ million)
Chart on India - Year-over-year growth 2024-2029 (%)
Data Table on India - Year-over-year growth 2024-2029 (%)

12.3.4 South Korea - Market size and forecast 2024-2029

Chart on South Korea - Market size and forecast 2024-2029 ($ million)
Data Table on South Korea - Market size and forecast 2024-2029 ($ million)
Chart on South Korea - Year-over-year growth 2024-2029 (%)
Data Table on South Korea - Year-over-year growth 2024-2029 (%)

12.3.5 Australia - Market size and forecast 2024-2029

Chart on Australia - Market size and forecast 2024-2029 ($ million)
Data Table on Australia - Market size and forecast 2024-2029 ($ million)
Chart on Australia - Year-over-year growth 2024-2029 (%)
Data Table on Australia - Year-over-year growth 2024-2029 (%)

12.3.6 Indonesia - Market size and forecast 2024-2029

Chart on Indonesia - Market size and forecast 2024-2029 ($ million)
Data Table on Indonesia - Market size and forecast 2024-2029 ($ million)
Chart on Indonesia - Year-over-year growth 2024-2029 (%)
Data Table on Indonesia - Year-over-year growth 2024-2029 (%)

12.4 Europe - Market size and forecast 2024-2029

Chart on Europe - Market size and forecast 2024-2029 ($ million)
Data Table on Europe - Market size and forecast 2024-2029 ($ million)
Chart on Europe - Year-over-year growth 2024-2029 (%)
Data Table on Europe - Year-over-year growth 2024-2029 (%)
Chart on Regional Comparison - Europe
Data Table on Regional Comparison - Europe

12.4.1 Germany - Market size and forecast 2024-2029

Chart on Germany - Market size and forecast 2024-2029 ($ million)
Data Table on Germany - Market size and forecast 2024-2029 ($ million)
Chart on Germany - Year-over-year growth 2024-2029 (%)
Data Table on Germany - Year-over-year growth 2024-2029 (%)

12.4.2 UK - Market size and forecast 2024-2029

Chart on UK - Market size and forecast 2024-2029 ($ million)
Data Table on UK - Market size and forecast 2024-2029 ($ million)
Chart on UK - Year-over-year growth 2024-2029 (%)
Data Table on UK - Year-over-year growth 2024-2029 (%)

12.4.3 France - Market size and forecast 2024-2029

Chart on France - Market size and forecast 2024-2029 ($ million)
Data Table on France - Market size and forecast 2024-2029 ($ million)
Chart on France - Year-over-year growth 2024-2029 (%)
Data Table on France - Year-over-year growth 2024-2029 (%)

12.4.4 Italy - Market size and forecast 2024-2029

Chart on Italy - Market size and forecast 2024-2029 ($ million)
Data Table on Italy - Market size and forecast 2024-2029 ($ million)
Chart on Italy - Year-over-year growth 2024-2029 (%)
Data Table on Italy - Year-over-year growth 2024-2029 (%)

12.4.5 The Netherlands - Market size and forecast 2024-2029

Chart on The Netherlands - Market size and forecast 2024-2029 ($ million)
Data Table on The Netherlands - Market size and forecast 2024-2029 ($ million)
Chart on The Netherlands - Year-over-year growth 2024-2029 (%)
Data Table on The Netherlands - Year-over-year growth 2024-2029 (%)

12.4.6 Spain - Market size and forecast 2024-2029

Chart on Spain - Market size and forecast 2024-2029 ($ million)
Data Table on Spain - Market size and forecast 2024-2029 ($ million)
Chart on Spain - Year-over-year growth 2024-2029 (%)
Data Table on Spain - Year-over-year growth 2024-2029 (%)

12.5 North America - Market size and forecast 2024-2029

Chart on North America - Market size and forecast 2024-2029 ($ million)
Data Table on North America - Market size and forecast 2024-2029 ($ million)
Chart on North America - Year-over-year growth 2024-2029 (%)
Data Table on North America - Year-over-year growth 2024-2029 (%)
Chart on Regional Comparison - North America
Data Table on Regional Comparison - North America

12.5.1 US - Market size and forecast 2024-2029

Chart on US - Market size and forecast 2024-2029 ($ million)
Data Table on US - Market size and forecast 2024-2029 ($ million)
Chart on US - Year-over-year growth 2024-2029 (%)
Data Table on US - Year-over-year growth 2024-2029 (%)

12.5.2 Canada - Market size and forecast 2024-2029

Chart on Canada - Market size and forecast 2024-2029 ($ million)
Data Table on Canada - Market size and forecast 2024-2029 ($ million)
Chart on Canada - Year-over-year growth 2024-2029 (%)
Data Table on Canada - Year-over-year growth 2024-2029 (%)

12.5.3 Mexico - Market size and forecast 2024-2029

Chart on Mexico - Market size and forecast 2024-2029 ($ million)
Data Table on Mexico - Market size and forecast 2024-2029 ($ million)
Chart on Mexico - Year-over-year growth 2024-2029 (%)
Data Table on Mexico - Year-over-year growth 2024-2029 (%)

12.6 Middle East and Africa - Market size and forecast 2024-2029

Chart on Middle East and Africa - Market size and forecast 2024-2029 ($ million)
Data Table on Middle East and Africa - Market size and forecast 2024-2029 ($ million)
Chart on Middle East and Africa - Year-over-year growth 2024-2029 (%)
Data Table on Middle East and Africa - Year-over-year growth 2024-2029 (%)
Chart on Regional Comparison - Middle East and Africa
Data Table on Regional Comparison - Middle East and Africa

12.6.1 Saudi Arabia - Market size and forecast 2024-2029

Chart on Saudi Arabia - Market size and forecast 2024-2029 ($ million)
Data Table on Saudi Arabia - Market size and forecast 2024-2029 ($ million)
Chart on Saudi Arabia - Year-over-year growth 2024-2029 (%)
Data Table on Saudi Arabia - Year-over-year growth 2024-2029 (%)

12.6.2 UAE - Market size and forecast 2024-2029

Chart on UAE - Market size and forecast 2024-2029 ($ million)
Data Table on UAE - Market size and forecast 2024-2029 ($ million)
Chart on UAE - Year-over-year growth 2024-2029 (%)
Data Table on UAE - Year-over-year growth 2024-2029 (%)

12.6.3 South Africa - Market size and forecast 2024-2029

Chart on South Africa - Market size and forecast 2024-2029 ($ million)
Data Table on South Africa - Market size and forecast 2024-2029 ($ million)
Chart on South Africa - Year-over-year growth 2024-2029 (%)
Data Table on South Africa - Year-over-year growth 2024-2029 (%)

12.6.4 Israel - Market size and forecast 2024-2029

Chart on Israel - Market size and forecast 2024-2029 ($ million)
Data Table on Israel - Market size and forecast 2024-2029 ($ million)
Chart on Israel - Year-over-year growth 2024-2029 (%)
Data Table on Israel - Year-over-year growth 2024-2029 (%)

12.6.5 Turkey - Market size and forecast 2024-2029

Chart on Turkey - Market size and forecast 2024-2029 ($ million)
Data Table on Turkey - Market size and forecast 2024-2029 ($ million)
Chart on Turkey - Year-over-year growth 2024-2029 (%)
Data Table on Turkey - Year-over-year growth 2024-2029 (%)

12.7 South America - Market size and forecast 2024-2029

Chart on South America - Market size and forecast 2024-2029 ($ million)
Data Table on South America - Market size and forecast 2024-2029 ($ million)
Chart on South America - Year-over-year growth 2024-2029 (%)
Data Table on South America - Year-over-year growth 2024-2029 (%)
Chart on Regional Comparison - South America
Data Table on Regional Comparison - South America

12.7.1 Brazil - Market size and forecast 2024-2029

Chart on Brazil - Market size and forecast 2024-2029 ($ million)
Data Table on Brazil - Market size and forecast 2024-2029 ($ million)
Chart on Brazil - Year-over-year growth 2024-2029 (%)
Data Table on Brazil - Year-over-year growth 2024-2029 (%)

12.7.2 Argentina - Market size and forecast 2024-2029

Chart on Argentina - Market size and forecast 2024-2029 ($ million)
Data Table on Argentina - Market size and forecast 2024-2029 ($ million)
Chart on Argentina - Year-over-year growth 2024-2029 (%)
Data Table on Argentina - Year-over-year growth 2024-2029 (%)

12.7.3 Colombia - Market size and forecast 2024-2029

Chart on Colombia - Market size and forecast 2024-2029 ($ million)
Data Table on Colombia - Market size and forecast 2024-2029 ($ million)
Chart on Colombia - Year-over-year growth 2024-2029 (%)
Data Table on Colombia - Year-over-year growth 2024-2029 (%)

12.8 Market opportunity by geography

Market opportunity by geography ($ million)
Data Tables on Market opportunity by geography ($ million)

13. Drivers, Challenges, and Opportunity

13.1 Market drivers

Growing usage of white spirits as cleaning and degreasing agent
Increasing demand from automotive industry
Rising demand for white spirits from artists

13.2 Market challenges

Health hazards associated with long-term exposure to white spirits
High cost of white spirits
Availability of substitutes for white spirits

13.3 Impact of drivers and challenges

Impact of drivers and challenges in 2024 and 2029

13.4 Market opportunities

Increasing demand from construction industry
Rise in demand for oil exploration
Rise in demand for cleaning and degreasing solvents

14. Competitive Landscape

14.1 Overview

14.2

Overview on criticality of inputs and factors of differentiation

14.3 Landscape disruption

Overview on factors of disruption

14.4 Industry risks

Impact of key risks on business

15. Competitive Analysis

15.1 Companies profiled

Companies covered

15.2 Company ranking index

15.3 Market positioning of companies

Matrix on companies position and classification

15.4 2M Holdings Ltd.

2M Holdings Ltd. - Overview
2M Holdings Ltd. - Product / Service
2M Holdings Ltd. - Key offerings
SWOT

15.5 Al Oga Factory

Al Oga Factory - Overview
Al Oga Factory - Product / Service
Al Oga Factory - Key offerings
SWOT

15.6 Al Sanea Chemical Products

Al Sanea Chemical Products - Overview
Al Sanea Chemical Products - Product / Service
Al Sanea Chemical Products - Key offerings
SWOT

15.7 Bharat Petroleum Corp. Ltd.

Bharat Petroleum Corp. Ltd. - Overview
Bharat Petroleum Corp. Ltd. - Product / Service
Bharat Petroleum Corp. Ltd. - Key offerings
SWOT

15.8 Compania Espanola de Petroleos SA

Compania Espanola de Petroleos SA - Overview
Compania Espanola de Petroleos SA - Business segments
Compania Espanola de Petroleos SA - Key offerings
Compania Espanola de Petroleos SA - Segment focus
SWOT

15.9 DHC Solvent Chemie GmbH

DHC Solvent Chemie GmbH - Overview
DHC Solvent Chemie GmbH - Product / Service
DHC Solvent Chemie GmbH - Key offerings
SWOT

15.10 Exxon Mobil Corp.

Exxon Mobil Corp. - Overview
Exxon Mobil Corp. - Business segments
Exxon Mobil Corp. - Key news
Exxon Mobil Corp. - Key offerings
Exxon Mobil Corp. - Segment focus
SWOT

15.11 G.S.B Chemical Co. Pty. Ltd.

G.S.B Chemical Co. Pty. Ltd. - Overview
G.S.B Chemical Co. Pty. Ltd. - Product / Service
G.S.B Chemical Co. Pty. Ltd. - Key offerings
SWOT

15.12 Haltermann Carless

Haltermann Carless - Overview
Haltermann Carless - Product / Service
Haltermann Carless - Key offerings
SWOT

15.13 HCS Group GmbH

HCS Group GmbH - Overview
HCS Group GmbH - Product / Service
HCS Group GmbH - Key offerings
SWOT

15.14 Indian Oil Corp. Ltd.

Indian Oil Corp. Ltd. - Overview
Indian Oil Corp. Ltd. - Business segments
Indian Oil Corp. Ltd. - Key news
Indian Oil Corp. Ltd. - Key offerings
Indian Oil Corp. Ltd. - Segment focus
SWOT

15.15 KH Chemicals BV

KH Chemicals BV - Overview
KH Chemicals BV - Product / Service
KH Chemicals BV - Key offerings
SWOT

15.16 Shanghai Chemex Group Ltd.

Shanghai Chemex Group Ltd. - Overview
Shanghai Chemex Group Ltd. - Product / Service
Shanghai Chemex Group Ltd. - Key offerings
SWOT

15.17 Shell plc

Shell plc - Overview
Shell plc - Business segments
Shell plc - Key news
Shell plc - Key offerings
Shell plc - Segment focus
SWOT

15.18 TotalEnergies SE

TotalEnergies SE - Overview
TotalEnergies SE - Business segments
TotalEnergies SE - Key news
TotalEnergies SE - Key offerings
TotalEnergies SE - Segment focus
SWOT

16. Appendix

16.1 Scope of the report

Market definition
Objectives
Notes and caveats

16.2 Inclusions and exclusions checklist

Inclusions checklist
Exclusions checklist

16.3 Currency conversion rates for US$

16.4 Research methodology

16.5 Data procurement

Information sources

16.6 Data validation

16.7 Validation techniques employed for market sizing

16.8 Data synthesis

16.9 360 degree market analysis

16.10 List of abbreviations

Research Methodology

Technavio presents a detailed picture of the market by way of study, synthesis, and summation of data from multiple sources. The analysts have presented the various facets of the market with a particular focus on identifying the key industry influencers. The data thus presented is comprehensive, reliable, and the result of extensive research, both primary and secondary.

INFORMATION SOURCES

Primary sources

  • Manufacturers and suppliers
  • Channel partners
  • Industry experts
  • Strategic decision makers

Secondary sources

  • Industry journals and periodicals
  • Government data
  • Financial reports of key industry players
  • Historical data
  • Press releases

DATA ANALYSIS

Data Synthesis

  • Collation of data
  • Estimation of key figures
  • Analysis of derived insights

Data Validation

  • Triangulation with data models
  • Reference against proprietary databases
  • Corroboration with industry experts

REPORT WRITING

Qualitative

  • Market drivers
  • Market challenges
  • Market trends
  • Five forces analysis

Quantitative

  • Market size and forecast
  • Market segmentation
  • Geographical insights
  • Competitive landscape

Interested in this report?

Get your sample now to see our research methodology and insights!

Download Now

Frequently Asked Questions

White Spirits market growth will increase by USD 2291.0 million during 2025-2029.

The White Spirits market is expected to grow at a CAGR of 5.7% during 2025-2029.

White Spirits market is segmented by Application (Thinner and solvent, Fuels, Cleaning agent, Degreasing agent, Others) Grade type (Regular flash, Low flash, High flash) Product type (Type 1, Type 2, Type 3, Type 0)

2M Holdings Ltd., Al Oga Factory, Al Sanea Chemical Products, Bharat Petroleum Corp. Ltd., Compania Espanola de Petroleos SA, DHC Solvent Chemie GmbH, Exxon Mobil Corp., G.S.B Chemical Co. Pty. Ltd., Haltermann Carless, HCS Group GmbH, Indian Oil Corp. Ltd., KH Chemicals BV, Neste Corp., Pure Chemicals Co. Ltd, Rebain International, Sel Chemie BV, Shanghai Chemex Group Ltd., Shell plc, TotalEnergies SE, Vizag Chemical International are a few of the key vendors in the White Spirits market.

APAC will register the highest growth rate of 35.2% among the other regions. Therefore, the White Spirits market in APAC is expected to garner significant business opportunities for the vendors during the forecast period.

China, Japan, India, South Korea, Australia, Indonesia, Germany, UK, France, Italy, The Netherlands, Spain, US, Canada, Mexico, Saudi Arabia, UAE, South Africa, Israel, Turkey, Brazil, Argentina, Colombia

  • Growing usage of white spirits as cleaning and degreasing agent is the driving factor this market.

The White Spirits market vendors should focus on grabbing business opportunities from the Application segment as it accounted for the largest market share in the base year.