Wind Turbine Inspection Drones Market Analysis, Size, and Forecast 2026-2030: APAC (China, Japan, and India), North America (US, Canada, and Mexico), Europe (Germany, UK, and France), Middle East and Africa (Saudi Arabia, UAE, and South Africa), South America (Brazil and Argentina), and Rest of World (ROW)

Wind Turbine Inspection Drones Market Analysis, Size, and Forecast 2026-2030:
APAC (China, Japan, and India), North America (US, Canada, and Mexico), Europe (Germany, UK, and France), Middle East and Africa (Saudi Arabia, UAE, and South Africa), South America (Brazil and Argentina), and Rest of World (ROW)

Published: Dec 2025 289 Pages SKU: IRTNTR76539

Market Overview at a Glance

$250.5 Mn
Market Opportunity
8.7%
CAGR 2025 - 2030
40.2%
North America Growth
$264.7 Mn
Onshore wind energy segment 2024

Wind Turbine Inspection Drones Market Size 2026-2030

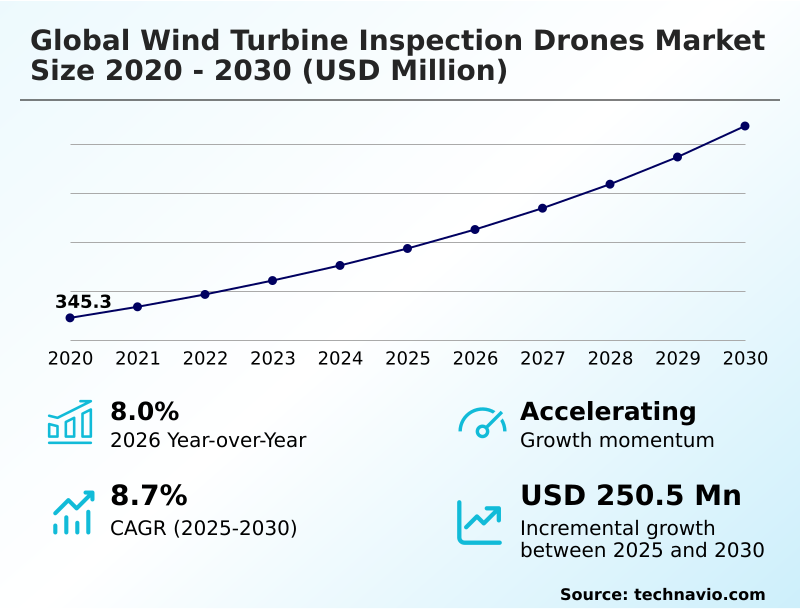
The wind turbine inspection drones market size is valued to increase by USD 250.5 million, at a CAGR of 8.7% from 2025 to 2030. Integration of advanced sensors and imaging technologies in inspection drones will drive the wind turbine inspection drones market.

Major Market Trends & Insights

  • North America dominated the market and accounted for a 40.2% growth during the forecast period.
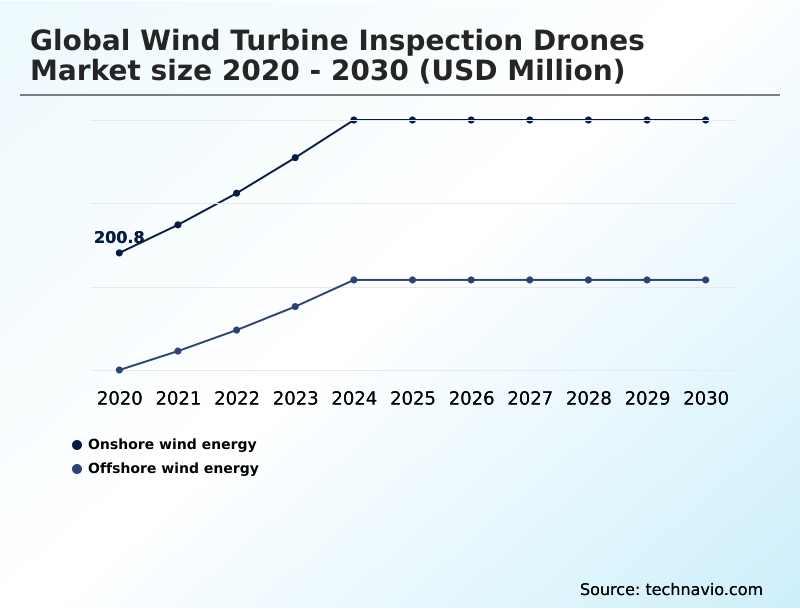
  • By Application - Onshore wind energy segment was valued at USD 264.7 million in 2024
  • By Type - Remotely piloted segment accounted for the largest market revenue share in 2024

Market Size & Forecast

  • Market Opportunities: USD 392.4 million
  • Market Future Opportunities: USD 250.5 million
  • CAGR from 2025 to 2030 : 8.7%

Market Summary

  • The Wind Turbine Inspection Drones Market is fundamentally transforming renewable energy asset management by addressing the high costs and safety risks of traditional maintenance methods. A primary market driver is the integration of advanced sensor payloads, including high-resolution RGB cameras and thermal imaging sensors, which enable precise subsurface delamination detection and structural health monitoring.
  • This shift is essential as wind farms expand into remote and harsh environments. A key trend is the adoption of predictive maintenance strategies, where data analytics integration and digital twin technology are used to forecast component failures and optimize operations.
  • For instance, an operator can use autonomous data acquisition from a fleet of multi-rotor drones to model blade condition analysis across hundreds of turbines, reducing inspection time by over 70% compared to manual methods. However, the industry faces challenges related to data security and privacy and the need for stringent regulatory compliance for beyond visual line of sight (BVLOS) operations.
  • The evolution toward drone-in-a-box solutions and automated defect recognition (ADR) further highlights the market’s move toward fully autonomous O&M workflows, which are critical for improving efficiency and reducing the levelized cost of energy (LCOE).

What will be the Size of the Wind Turbine Inspection Drones Market during the forecast period?

Get Key Insights on Market Forecast (PDF) Request Free Sample

How is the Wind Turbine Inspection Drones Market Segmented?

The wind turbine inspection drones industry research report provides comprehensive data (region-wise segment analysis), with forecasts and estimates in "USD million" for the period 2026-2030, as well as historical data from 2020-2024 for the following segments.

  • Application
    • Onshore wind energy
    • Offshore wind energy
  • Type
    • Remotely piloted
    • Fully autonomous
    • Optionally piloted
  • Component
    • Hardware
    • Software
    • Services
  • Geography
    • APAC
      • China
      • Japan
      • India
    • North America
      • US
      • Canada
      • Mexico
    • Europe
      • Germany
      • UK
      • France
    • Middle East and Africa
      • Saudi Arabia
      • UAE
      • South Africa
    • South America
      • Brazil
      • Argentina
    • Rest of World (ROW)

By Application Insights

The onshore wind energy segment is estimated to witness significant growth during the forecast period.

The onshore wind energy segment is driven by the need to optimize operations and maintenance (O&M) workflows and lower the levelized cost of energy (LCOE).

Operators are leveraging advanced flight planning software for autonomous data acquisition to conduct comprehensive blade condition analysis and composite blade inspection. These non-intrusive inspection methods improve asset integrity management by detecting issues like leading edge erosion early.

The integration of automated defect recognition (ADR) into data analysis is a key factor, with some platforms achieving 95% accuracy in automatically categorizing blade defects from drone-captured imagery.

This high precision significantly reduces the time required for manual data review, allowing for quicker and more informed maintenance decisions that enhance overall turbine performance and longevity.

Request Free Sample

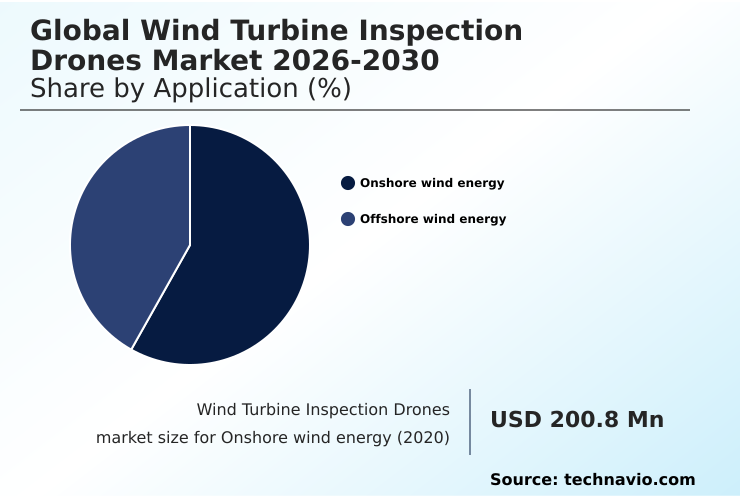
The Onshore wind energy segment was valued at USD 264.7 million in 2024 and showed a gradual increase during the forecast period.

Request Free Sample

Regional Analysis

North America is estimated to contribute 40.2% to the growth of the global market during the forecast period.Technavio’s analysts have elaborately explained the regional trends and drivers that shape the market during the forecast period.

See How Wind Turbine Inspection Drones Market Demand is Rising in North America Request Free Sample

The geographic landscape is diverse, with regional dynamics shaping technology adoption. In North America, which represents over 40% of the market opportunity, the focus is on integrating aerial data collection into enterprise asset management systems.

In contrast, colder climates like Canada and parts of Europe drive demand for specialized fixed-wing drones capable of ice accumulation detection.

The expansion of offshore wind in the North Sea has popularized the inspection-as-a-service (IaaS) model for complex nacelle and tower inspection tasks. Across all regions, operators are utilizing digital twin technology for precise structural integrity monitoring.

This technology allows asset managers to track degradation from afar, with data processing platforms enabling a shift toward proactive maintenance strategies. This approach is critical for managing assets in remote locations, where physical access is costly and logistically complex.

Market Dynamics

Our researchers analyzed the data with 2025 as the base year, along with the key drivers, trends, and challenges. A holistic analysis of drivers will help companies refine their marketing strategies to gain a competitive advantage.

  • Strategic adoption of advanced aerial inspection technologies is becoming a competitive differentiator in the global wind turbine inspection drones market 2026-2030. A detailed drone inspection cost-benefit analysis consistently demonstrates superior returns compared to traditional methods, particularly for offshore turbine drone inspection, where safety and accessibility are primary concerns.
  • The use of high-resolution imagery for cracks and specialized sensors for drone inspection for blade erosion allows operators to transition from reactive repairs to data-driven predictive maintenance. AI in turbine blade inspection and sophisticated software for defect classification are automating analysis, significantly reducing the time between data capture and actionable insights.
  • The regulatory framework for drone inspections is evolving to support complex bvlos operations for wind farms, which is crucial for monitoring large-scale installations. As the industry matures, the comparison of drone vs rope access technicians shows a clear advantage for unmanned systems in both safety and efficiency, often completing inspections more than twice as fast.
  • Key applications include drone quality control services during manufacturing and installation, as well as using lidar for structural analysis and thermal imaging for electrical faults. The ability to perform autonomous turbine drone inspection and integrate drone data with digital twins is setting new standards for asset management.
  • This extends to emerging areas like using drones for floating wind turbines and deploying swarm robotics for wind farms, which further optimize data management for drone inspection and overall operational oversight.

What are the key market drivers leading to the rise in the adoption of Wind Turbine Inspection Drones Industry?

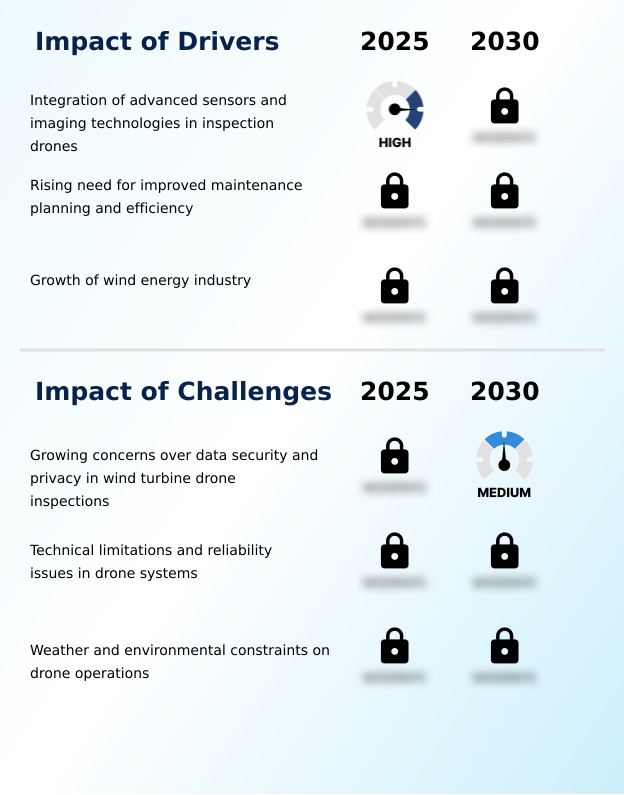
  • The integration of advanced sensors and imaging technologies in inspection drones serves as a key market driver, enabling more accurate data collection and efficient maintenance planning.

  • Key drivers are centered on technological advancements in data capture and the growing need for efficient wind asset management.
  • The deployment of unmanned aerial vehicles (UAVs) equipped with high-resolution RGB cameras, thermal imaging sensors, and LiDAR modules provides unprecedented detail for structural health monitoring.
  • These tools are critical for early subsurface delamination detection and assessing other forms of degradation, facilitating timely equipment maintenance and repair. This detailed data is integrated into enterprise asset management systems, creating a holistic view of infrastructure lifecycle management.
  • With global wind power capacity additions projected to exceed 150 GW, the demand for scalable and accurate inspection methods is intensifying.
  • The ability of these technologies to provide comprehensive data supports a proactive approach to maintenance, directly contributing to improved turbine availability and performance.

What are the market trends shaping the Wind Turbine Inspection Drones Industry?

  • The increasing integration of artificial intelligence and machine learning in drone technology is an emerging trend. This advancement is enhancing the analytical capabilities and operational autonomy of inspection systems.

  • The market is increasingly influenced by the convergence of automation and artificial intelligence, which is reshaping maintenance workflows. The adoption of drone-in-a-box solutions enables fully autonomous missions, including remote deployment and autonomous recharging, which drastically reduces manual intervention.
  • This trend is complemented by advancements in beyond visual line of sight (BVLOS) operations, allowing for the inspection of large-scale wind farms more efficiently. The development of swarm drone solutions, where multiple drones operate in a coordinated manner, further enhances data collection capabilities. These technologies feed into advanced predictive maintenance strategies, supported by robust data analytics integration.
  • As a result, operators are able to move from scheduled maintenance to a condition-based approach, leveraging data from condition monitoring systems to anticipate failures and optimize repair schedules, reducing downtime by up to 30%.

What challenges does the Wind Turbine Inspection Drones Industry face during its growth?

  • Growing concerns over data security and privacy associated with wind turbine drone inspections present a significant challenge, potentially affecting the industry's growth trajectory.

  • The market faces significant challenges related to technical limitations and regulatory hurdles. Concerns around data security and privacy are paramount, as the transmission and storage of sensitive asset data require robust protection against unauthorized access. From a technical standpoint, the operational endurance of multi-rotor drones is a constraint, with battery life and the need for autonomous recharging impacting mission duration.
  • The effectiveness of sensor payloads is also subject to environmental resilience, as adverse weather can limit operational windows. Furthermore, achieving regulatory compliance for advanced operations necessitates comprehensive pilot training and certification, adding to operational overhead.
  • These factors complicate wind farm logistics, especially for remote deployment, and require precise real-time kinematic (RTK) positioning to ensure safety and data accuracy, with operations often limited to wind speeds below 15 meters per second.

Exclusive Technavio Analysis on Customer Landscape

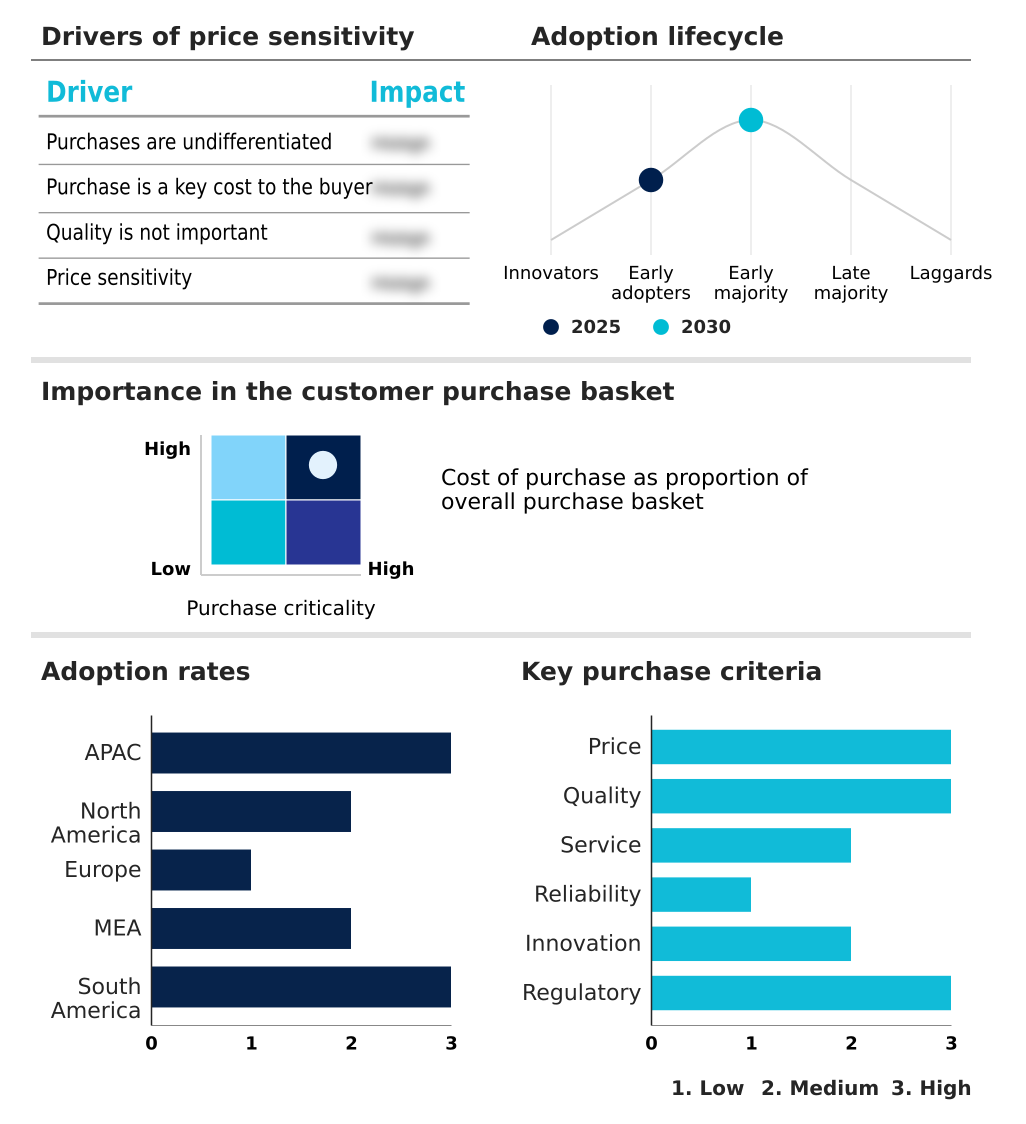
The wind turbine inspection drones market forecasting report includes the adoption lifecycle of the market, covering from the innovator’s stage to the laggard’s stage. It focuses on adoption rates in different regions based on penetration. Furthermore, the wind turbine inspection drones market report also includes key purchase criteria and drivers of price sensitivity to help companies evaluate and develop their market growth analysis strategies.

Customer Landscape of Wind Turbine Inspection Drones Industry

Competitive Landscape

Companies are implementing various strategies, such as strategic alliances, wind turbine inspection drones market forecast, partnerships, mergers and acquisitions, geographical expansion, and product/service launches, to enhance their presence in the industry.

Aerones Engineering - Providers offer robotic technology solutions for wind turbine blade maintenance, repair, and inspection, delivering comprehensive services to enhance asset performance and lifespan.

The industry research and growth report includes detailed analyses of the competitive landscape of the market and information about key companies, including:

  • Aerones Engineering
  • Airpix
  • Cyberhawk Innovations
  • DELAIR SAS
  • Drone Volt SA
  • Eagle Eye Innovations Ltd.
  • Eagletronics Aviation Pvt. Ltd.
  • Equinoxs Drones Pvt. Ltd.
  • FORCE Technology
  • Helvetis
  • HighEye
  • Iberdrola SA
  • NEARTHLAB
  • Perceptual Robotics Ltd.
  • Skyfish Corp
  • SkySpecs Inc.
  • Sulzer and Schmid Laboratories
  • SZ DJI Technology Co. Ltd.
  • Terra Drone Corp.
  • Voliro AG

Qualitative and quantitative analysis of companies has been conducted to help clients understand the wider business environment as well as the strengths and weaknesses of key industry players. Data is qualitatively analyzed to categorize companies as pure play, category-focused, industry-focused, and diversified; it is quantitatively analyzed to categorize companies as dominant, leading, strong, tentative, and weak.

Recent Development and News in Wind turbine inspection drones market

  • In March, 2025, Goldwind, a major wind turbine manufacturer, launched a proprietary digital twin platform that ingests real-time data from inspection drones to model turbine performance and simulate weather impacts.
  • In March, 2025, DJI Enterprise released the Matrice 400 RTK Wind Edition, a specialized multi-rotor drone platform designed to operate in high-wind environments up to 15 meters per second.
  • In March, 2025, Egypt signed an agreement for a 500-megawatt wind power project in the Gulf of Suez, signaling a significant expansion of renewable energy capacity that will drive demand for inspection services.
  • In April, 2025, Vestas Wind Systems announced a collaboration with an aerial artificial intelligence firm to deploy a standardized fleet of automated inspection drones across its North Sea operational sites.

Dive into Technavio’s robust research methodology, blending expert interviews, extensive data synthesis, and validated models for unparalleled Wind Turbine Inspection Drones Market insights. See full methodology.

Market Scope
Page number 289
Base year 2025
Historic period 2020-2024
Forecast period 2026-2030
Growth momentum & CAGR Accelerate at a CAGR of 8.7%
Market growth 2026-2030 USD 250.5 million
Market structure Fragmented
YoY growth 2025-2026(%) 8.0%
Key countries China, Japan, India, South Korea, Australia, Indonesia, US, Canada, Mexico, Germany, UK, France, Italy, Spain, The Netherlands, Saudi Arabia, UAE, South Africa, Israel, Turkey, Brazil, Argentina and Chile
Competitive landscape Leading Companies, Market Positioning of Companies, Competitive Strategies, and Industry Risks

Request Free Sample

Research Analyst Overview

  • The market is defined by a rapid technological evolution centered on automation and data intelligence. The deployment of unmanned aerial vehicles (UAVs) is no longer a niche capability but a core component of predictive maintenance strategies.
  • Key technologies such as high-resolution RGB cameras, thermal imaging sensors, and LiDAR modules are becoming standard for comprehensive aerial data collection and blade condition analysis. The industry is advancing beyond simple data gathering with innovations like automated defect recognition (ADR) and advanced flight planning software, which enable precise autonomous data acquisition.
  • A critical boardroom-level consideration is the integration of digital twin technology, which provides a virtual replica of assets for lifecycle monitoring. This allows for precise subsurface delamination detection and tracking of leading edge erosion. The adoption of such systems has led to tangible efficiency gains, with some operators reporting up to a 95% accuracy rate in automated fault identification.
  • This shift from manual to automated workflows, including the use of drone-in-a-box solutions and BVLOS operations, is reshaping asset management and driving down operational costs.

What are the Key Data Covered in this Wind Turbine Inspection Drones Market Research and Growth Report?

  • What is the expected growth of the Wind Turbine Inspection Drones Market between 2026 and 2030?

    • USD 250.5 million, at a CAGR of 8.7%

  • What segmentation does the market report cover?

    • The report is segmented by Application (Onshore wind energy, and Offshore wind energy), Type (Remotely piloted, Fully autonomous, and Optionally piloted), Component (Hardware, Software, and Services) and Geography (APAC, North America, Europe, Middle East and Africa, South America)

  • Which regions are analyzed in the report?

    • APAC, North America, Europe, Middle East and Africa and South America

  • What are the key growth drivers and market challenges?

    • Integration of advanced sensors and imaging technologies in inspection drones, Growing concerns over data security and privacy in wind turbine drone inspections

  • Who are the major players in the Wind Turbine Inspection Drones Market?

    • Aerones Engineering, Airpix, Cyberhawk Innovations, DELAIR SAS, Drone Volt SA, Eagle Eye Innovations Ltd., Eagletronics Aviation Pvt. Ltd., Equinoxs Drones Pvt. Ltd., FORCE Technology, Helvetis, HighEye, Iberdrola SA, NEARTHLAB, Perceptual Robotics Ltd., Skyfish Corp, SkySpecs Inc., Sulzer and Schmid Laboratories, SZ DJI Technology Co. Ltd., Terra Drone Corp. and Voliro AG

Market Research Insights

  • Market dynamics are increasingly shaped by the push for operational efficiency and data-driven decision-making. The adoption of autonomous flight paths and remote inspection services is streamlining wind farm logistics, with some providers inspecting up to 20 turbines per day, a significant increase over manual methods.
  • This efficiency is amplified by robotic inspection technology, which delivers consistent data quality for better condition monitoring systems. A critical factor is data security and privacy, as operators must balance the benefits of remote deployment with the need for robust data protection. Furthermore, the complexities of environmental resilience and regulatory compliance require extensive pilot training and certification, impacting operational costs.
  • The technical capabilities of multi-rotor drones are also a focal point, as their sensor payloads and capacity for autonomous recharging directly influence mission effectiveness and scalability, especially in challenging offshore environments.

We can help! Our analysts can customize this wind turbine inspection drones market research report to meet your requirements.

Get in touch

1. Executive Summary

1.1 Market overview

Executive Summary - Chart on Market Overview
Executive Summary - Data Table on Market Overview
Executive Summary - Chart on Global Market Characteristics
Executive Summary - Chart on Market by Geography
Executive Summary - Chart on Market Segmentation by Application
Executive Summary - Chart on Market Segmentation by Type
Executive Summary - Chart on Market Segmentation by Component
Executive Summary - Chart on Incremental Growth
Executive Summary - Data Table on Incremental Growth
Executive Summary - Chart on Company Market Positioning

2. Technavio Analysis

2.1 Analysis of price sensitivity, lifecycle, customer purchase basket, adoption rates, and purchase criteria

2.2 Criticality of inputs and Factors of differentiation

Chart on Overview on criticality of inputs and factors of differentiation

2.3 Factors of disruption

Chart on Overview on factors of disruption

2.4 Impact of drivers and challenges

Chart on Impact of drivers and challenges in 2025 and 2030

3. Market Landscape

3.1 Market ecosystem

Chart on Parent Market
Data Table on - Parent Market

3.2 Market characteristics

Chart on Market characteristics analysis

3.3 Value chain analysis

Chart on Value chain analysis

4. Market Sizing

4.1 Market definition

Data Table on Offerings of companies included in the market definition

4.2 Market segment analysis

Market segments

4.3 Market size 2025

4.4 Market outlook: Forecast for 2025-2030

Chart on Global - Market size and forecast 2025-2030 ($ million)
Data Table on Global - Market size and forecast 2025-2030 ($ million)
Chart on Global Market: Year-over-year growth 2025-2030 (%)
Data Table on Global Market: Year-over-year growth 2025-2030 (%)

5. Historic Market Size

5.1 Global Wind Turbine Inspection Drones Market 2020 - 2024

Historic Market Size - Data Table on Global Wind Turbine Inspection Drones Market 2020 - 2024 ($ million)

5.2 Application segment analysis 2020 - 2024

Historic Market Size - Application Segment 2020 - 2024 ($ million)

5.3 Type segment analysis 2020 - 2024

Historic Market Size - Type Segment 2020 - 2024 ($ million)

5.4 Component segment analysis 2020 - 2024

Historic Market Size - Component Segment 2020 - 2024 ($ million)

5.5 Geography segment analysis 2020 - 2024

Historic Market Size - Geography Segment 2020 - 2024 ($ million)

5.6 Country segment analysis 2020 - 2024

Historic Market Size - Country Segment 2020 - 2024 ($ million)

6. Qualitative Analysis

6.1 The AI impact on Global Wind Turbine Inspection Drones Market

7. Five Forces Analysis

7.1 Five forces summary

Five forces analysis - Comparison between 2025 and 2030

7.2 Bargaining power of buyers

Bargaining power of buyers - Impact of key factors 2025 and 2030

7.3 Bargaining power of suppliers

Bargaining power of suppliers - Impact of key factors in 2025 and 2030

7.4 Threat of new entrants

Threat of new entrants - Impact of key factors in 2025 and 2030

7.5 Threat of substitutes

Threat of substitutes - Impact of key factors in 2025 and 2030

7.6 Threat of rivalry

Threat of rivalry - Impact of key factors in 2025 and 2030

7.7 Market condition

Chart on Market condition - Five forces 2025 and 2030

8. Market Segmentation by Application

8.1 Market segments

Chart on Application - Market share 2025-2030 (%)
Data Table on Application - Market share 2025-2030 (%)

8.2 Comparison by Application

Chart on Comparison by Application
Data Table on Comparison by Application

8.3 Onshore wind energy - Market size and forecast 2025-2030

Chart on Onshore wind energy - Market size and forecast 2025-2030 ($ million)
Data Table on Onshore wind energy - Market size and forecast 2025-2030 ($ million)
Chart on Onshore wind energy - Year-over-year growth 2025-2030 (%)
Data Table on Onshore wind energy - Year-over-year growth 2025-2030 (%)

8.4 Offshore wind energy - Market size and forecast 2025-2030

Chart on Offshore wind energy - Market size and forecast 2025-2030 ($ million)
Data Table on Offshore wind energy - Market size and forecast 2025-2030 ($ million)
Chart on Offshore wind energy - Year-over-year growth 2025-2030 (%)
Data Table on Offshore wind energy - Year-over-year growth 2025-2030 (%)

8.5 Market opportunity by Application

Market opportunity by Application ($ million)
Data Table on Market opportunity by Application ($ million)

9. Market Segmentation by Type

9.1 Market segments

Chart on Type - Market share 2025-2030 (%)
Data Table on Type - Market share 2025-2030 (%)

9.2 Comparison by Type

Chart on Comparison by Type
Data Table on Comparison by Type

9.3 Remotely piloted - Market size and forecast 2025-2030

Chart on Remotely piloted - Market size and forecast 2025-2030 ($ million)
Data Table on Remotely piloted - Market size and forecast 2025-2030 ($ million)
Chart on Remotely piloted - Year-over-year growth 2025-2030 (%)
Data Table on Remotely piloted - Year-over-year growth 2025-2030 (%)

9.4 Fully autonomous - Market size and forecast 2025-2030

Chart on Fully autonomous - Market size and forecast 2025-2030 ($ million)
Data Table on Fully autonomous - Market size and forecast 2025-2030 ($ million)
Chart on Fully autonomous - Year-over-year growth 2025-2030 (%)
Data Table on Fully autonomous - Year-over-year growth 2025-2030 (%)

9.5 Optionally piloted - Market size and forecast 2025-2030

Chart on Optionally piloted - Market size and forecast 2025-2030 ($ million)
Data Table on Optionally piloted - Market size and forecast 2025-2030 ($ million)
Chart on Optionally piloted - Year-over-year growth 2025-2030 (%)
Data Table on Optionally piloted - Year-over-year growth 2025-2030 (%)

9.6 Market opportunity by Type

Market opportunity by Type ($ million)
Data Table on Market opportunity by Type ($ million)

10. Market Segmentation by Component

10.1 Market segments

Chart on Component - Market share 2025-2030 (%)
Data Table on Component - Market share 2025-2030 (%)

10.2 Comparison by Component

Chart on Comparison by Component
Data Table on Comparison by Component

10.3 Hardware - Market size and forecast 2025-2030

Chart on Hardware - Market size and forecast 2025-2030 ($ million)
Data Table on Hardware - Market size and forecast 2025-2030 ($ million)
Chart on Hardware - Year-over-year growth 2025-2030 (%)
Data Table on Hardware - Year-over-year growth 2025-2030 (%)

10.4 Software - Market size and forecast 2025-2030

Chart on Software - Market size and forecast 2025-2030 ($ million)
Data Table on Software - Market size and forecast 2025-2030 ($ million)
Chart on Software - Year-over-year growth 2025-2030 (%)
Data Table on Software - Year-over-year growth 2025-2030 (%)

10.5 Services - Market size and forecast 2025-2030

Chart on Services - Market size and forecast 2025-2030 ($ million)
Data Table on Services - Market size and forecast 2025-2030 ($ million)
Chart on Services - Year-over-year growth 2025-2030 (%)
Data Table on Services - Year-over-year growth 2025-2030 (%)

10.6 Market opportunity by Component

Market opportunity by Component ($ million)
Data Table on Market opportunity by Component ($ million)

11. Customer Landscape

11.1 Customer landscape overview

Analysis of price sensitivity, lifecycle, customer purchase basket, adoption rates, and purchase criteria

12. Geographic Landscape

12.1 Geographic segmentation

Chart on Market share by geography 2025-2030 (%)
Data Table on Market share by geography 2025-2030 (%)

12.2 Geographic comparison

Chart on Geographic comparison
Data Table on Geographic comparison

12.3 APAC - Market size and forecast 2025-2030

Chart on APAC - Market size and forecast 2025-2030 ($ million)
Data Table on APAC - Market size and forecast 2025-2030 ($ million)
Chart on APAC - Year-over-year growth 2025-2030 (%)
Data Table on APAC - Year-over-year growth 2025-2030 (%)
Chart on Regional Comparison - APAC
Data Table on Regional Comparison - APAC

12.3.1 China - Market size and forecast 2025-2030

Chart on China - Market size and forecast 2025-2030 ($ million)
Data Table on China - Market size and forecast 2025-2030 ($ million)
Chart on China - Year-over-year growth 2025-2030 (%)
Data Table on China - Year-over-year growth 2025-2030 (%)

12.3.2 Japan - Market size and forecast 2025-2030

Chart on Japan - Market size and forecast 2025-2030 ($ million)
Data Table on Japan - Market size and forecast 2025-2030 ($ million)
Chart on Japan - Year-over-year growth 2025-2030 (%)
Data Table on Japan - Year-over-year growth 2025-2030 (%)

12.3.3 India - Market size and forecast 2025-2030

Chart on India - Market size and forecast 2025-2030 ($ million)
Data Table on India - Market size and forecast 2025-2030 ($ million)
Chart on India - Year-over-year growth 2025-2030 (%)
Data Table on India - Year-over-year growth 2025-2030 (%)

12.3.4 South Korea - Market size and forecast 2025-2030

Chart on South Korea - Market size and forecast 2025-2030 ($ million)
Data Table on South Korea - Market size and forecast 2025-2030 ($ million)
Chart on South Korea - Year-over-year growth 2025-2030 (%)
Data Table on South Korea - Year-over-year growth 2025-2030 (%)

12.3.5 Australia - Market size and forecast 2025-2030

Chart on Australia - Market size and forecast 2025-2030 ($ million)
Data Table on Australia - Market size and forecast 2025-2030 ($ million)
Chart on Australia - Year-over-year growth 2025-2030 (%)
Data Table on Australia - Year-over-year growth 2025-2030 (%)

12.3.6 Indonesia - Market size and forecast 2025-2030

Chart on Indonesia - Market size and forecast 2025-2030 ($ million)
Data Table on Indonesia - Market size and forecast 2025-2030 ($ million)
Chart on Indonesia - Year-over-year growth 2025-2030 (%)
Data Table on Indonesia - Year-over-year growth 2025-2030 (%)

12.4 North America - Market size and forecast 2025-2030

Chart on North America - Market size and forecast 2025-2030 ($ million)
Data Table on North America - Market size and forecast 2025-2030 ($ million)
Chart on North America - Year-over-year growth 2025-2030 (%)
Data Table on North America - Year-over-year growth 2025-2030 (%)
Chart on Regional Comparison - North America
Data Table on Regional Comparison - North America

12.4.1 US - Market size and forecast 2025-2030

Chart on US - Market size and forecast 2025-2030 ($ million)
Data Table on US - Market size and forecast 2025-2030 ($ million)
Chart on US - Year-over-year growth 2025-2030 (%)
Data Table on US - Year-over-year growth 2025-2030 (%)

12.4.2 Canada - Market size and forecast 2025-2030

Chart on Canada - Market size and forecast 2025-2030 ($ million)
Data Table on Canada - Market size and forecast 2025-2030 ($ million)
Chart on Canada - Year-over-year growth 2025-2030 (%)
Data Table on Canada - Year-over-year growth 2025-2030 (%)

12.4.3 Mexico - Market size and forecast 2025-2030

Chart on Mexico - Market size and forecast 2025-2030 ($ million)
Data Table on Mexico - Market size and forecast 2025-2030 ($ million)
Chart on Mexico - Year-over-year growth 2025-2030 (%)
Data Table on Mexico - Year-over-year growth 2025-2030 (%)

12.5 Europe - Market size and forecast 2025-2030

Chart on Europe - Market size and forecast 2025-2030 ($ million)
Data Table on Europe - Market size and forecast 2025-2030 ($ million)
Chart on Europe - Year-over-year growth 2025-2030 (%)
Data Table on Europe - Year-over-year growth 2025-2030 (%)
Chart on Regional Comparison - Europe
Data Table on Regional Comparison - Europe

12.5.1 Germany - Market size and forecast 2025-2030

Chart on Germany - Market size and forecast 2025-2030 ($ million)
Data Table on Germany - Market size and forecast 2025-2030 ($ million)
Chart on Germany - Year-over-year growth 2025-2030 (%)
Data Table on Germany - Year-over-year growth 2025-2030 (%)

12.5.2 UK - Market size and forecast 2025-2030

Chart on UK - Market size and forecast 2025-2030 ($ million)
Data Table on UK - Market size and forecast 2025-2030 ($ million)
Chart on UK - Year-over-year growth 2025-2030 (%)
Data Table on UK - Year-over-year growth 2025-2030 (%)

12.5.3 France - Market size and forecast 2025-2030

Chart on France - Market size and forecast 2025-2030 ($ million)
Data Table on France - Market size and forecast 2025-2030 ($ million)
Chart on France - Year-over-year growth 2025-2030 (%)
Data Table on France - Year-over-year growth 2025-2030 (%)

12.5.4 Italy - Market size and forecast 2025-2030

Chart on Italy - Market size and forecast 2025-2030 ($ million)
Data Table on Italy - Market size and forecast 2025-2030 ($ million)
Chart on Italy - Year-over-year growth 2025-2030 (%)
Data Table on Italy - Year-over-year growth 2025-2030 (%)

12.5.5 Spain - Market size and forecast 2025-2030

Chart on Spain - Market size and forecast 2025-2030 ($ million)
Data Table on Spain - Market size and forecast 2025-2030 ($ million)
Chart on Spain - Year-over-year growth 2025-2030 (%)
Data Table on Spain - Year-over-year growth 2025-2030 (%)

12.5.6 The Netherlands - Market size and forecast 2025-2030

Chart on The Netherlands - Market size and forecast 2025-2030 ($ million)
Data Table on The Netherlands - Market size and forecast 2025-2030 ($ million)
Chart on The Netherlands - Year-over-year growth 2025-2030 (%)
Data Table on The Netherlands - Year-over-year growth 2025-2030 (%)

12.6 Middle East and Africa - Market size and forecast 2025-2030

Chart on Middle East and Africa - Market size and forecast 2025-2030 ($ million)
Data Table on Middle East and Africa - Market size and forecast 2025-2030 ($ million)
Chart on Middle East and Africa - Year-over-year growth 2025-2030 (%)
Data Table on Middle East and Africa - Year-over-year growth 2025-2030 (%)
Chart on Regional Comparison - Middle East and Africa
Data Table on Regional Comparison - Middle East and Africa

12.6.1 Saudi Arabia - Market size and forecast 2025-2030

Chart on Saudi Arabia - Market size and forecast 2025-2030 ($ million)
Data Table on Saudi Arabia - Market size and forecast 2025-2030 ($ million)
Chart on Saudi Arabia - Year-over-year growth 2025-2030 (%)
Data Table on Saudi Arabia - Year-over-year growth 2025-2030 (%)

12.6.2 UAE - Market size and forecast 2025-2030

Chart on UAE - Market size and forecast 2025-2030 ($ million)
Data Table on UAE - Market size and forecast 2025-2030 ($ million)
Chart on UAE - Year-over-year growth 2025-2030 (%)
Data Table on UAE - Year-over-year growth 2025-2030 (%)

12.6.3 South Africa - Market size and forecast 2025-2030

Chart on South Africa - Market size and forecast 2025-2030 ($ million)
Data Table on South Africa - Market size and forecast 2025-2030 ($ million)
Chart on South Africa - Year-over-year growth 2025-2030 (%)
Data Table on South Africa - Year-over-year growth 2025-2030 (%)

12.6.4 Israel - Market size and forecast 2025-2030

Chart on Israel - Market size and forecast 2025-2030 ($ million)
Data Table on Israel - Market size and forecast 2025-2030 ($ million)
Chart on Israel - Year-over-year growth 2025-2030 (%)
Data Table on Israel - Year-over-year growth 2025-2030 (%)

12.6.5 Turkey - Market size and forecast 2025-2030

Chart on Turkey - Market size and forecast 2025-2030 ($ million)
Data Table on Turkey - Market size and forecast 2025-2030 ($ million)
Chart on Turkey - Year-over-year growth 2025-2030 (%)
Data Table on Turkey - Year-over-year growth 2025-2030 (%)

12.7 South America - Market size and forecast 2025-2030

Chart on South America - Market size and forecast 2025-2030 ($ million)
Data Table on South America - Market size and forecast 2025-2030 ($ million)
Chart on South America - Year-over-year growth 2025-2030 (%)
Data Table on South America - Year-over-year growth 2025-2030 (%)
Chart on Regional Comparison - South America
Data Table on Regional Comparison - South America

12.7.1 Brazil - Market size and forecast 2025-2030

Chart on Brazil - Market size and forecast 2025-2030 ($ million)
Data Table on Brazil - Market size and forecast 2025-2030 ($ million)
Chart on Brazil - Year-over-year growth 2025-2030 (%)
Data Table on Brazil - Year-over-year growth 2025-2030 (%)

12.7.2 Argentina - Market size and forecast 2025-2030

Chart on Argentina - Market size and forecast 2025-2030 ($ million)
Data Table on Argentina - Market size and forecast 2025-2030 ($ million)
Chart on Argentina - Year-over-year growth 2025-2030 (%)
Data Table on Argentina - Year-over-year growth 2025-2030 (%)

12.7.3 Chile - Market size and forecast 2025-2030

Chart on Chile - Market size and forecast 2025-2030 ($ million)
Data Table on Chile - Market size and forecast 2025-2030 ($ million)
Chart on Chile - Year-over-year growth 2025-2030 (%)
Data Table on Chile - Year-over-year growth 2025-2030 (%)

12.8 Market opportunity by geography

Market opportunity by geography ($ million)
Data Tables on Market opportunity by geography ($ million)

13. Drivers, Challenges, and Opportunity

13.1 Market drivers

Integration of advanced sensors and imaging technologies in inspection drones
Rising need for improved maintenance planning and efficiency
Growth of wind energy industry

13.2 Market challenges

Growing concerns over data security and privacy in wind turbine drone inspections
Technical limitations and reliability issues in drone systems
Weather and environmental constraints on drone operations

13.3 Impact of drivers and challenges

Impact of drivers and challenges in 2025 and 2030

13.4 Market opportunities

Rising adoption of artificial intelligence and machine learning in drone technology
Development of autonomous and swarm drone solutions
Rising demand for innovative inspection software and data management solutions

14. Competitive Landscape

14.1 Overview

14.2

Overview on criticality of inputs and factors of differentiation

14.3 Landscape disruption

Overview on factors of disruption

14.4 Industry risks

Impact of key risks on business

15. Competitive Analysis

15.1 Companies profiled

Companies covered

15.2 Company ranking index

15.3 Market positioning of companies

Matrix on companies position and classification

15.4 Aerones Engineering

Aerones Engineering - Overview
Aerones Engineering - Product / Service
Aerones Engineering - Key offerings
SWOT

15.5 Cyberhawk Innovations

Cyberhawk Innovations - Overview
Cyberhawk Innovations - Product / Service
Cyberhawk Innovations - Key offerings
SWOT

15.6 DELAIR SAS

DELAIR SAS - Overview
DELAIR SAS - Product / Service
DELAIR SAS - Key offerings
SWOT

15.7 Drone Volt SA

Drone Volt SA - Overview
Drone Volt SA - Product / Service
Drone Volt SA - Key offerings
SWOT

15.8 Eagle Eye Innovations Ltd.

Eagle Eye Innovations Ltd. - Overview
Eagle Eye Innovations Ltd. - Product / Service
Eagle Eye Innovations Ltd. - Key offerings
SWOT

15.9 Eagletronics Aviation Pvt. Ltd.

Eagletronics Aviation Pvt. Ltd. - Overview
Eagletronics Aviation Pvt. Ltd. - Product / Service
Eagletronics Aviation Pvt. Ltd. - Key offerings
SWOT

15.10 Helvetis

Helvetis - Overview
Helvetis - Product / Service
Helvetis - Key offerings
SWOT

15.11 Iberdrola SA

Iberdrola SA - Overview
Iberdrola SA - Business segments
Iberdrola SA - Key offerings
Iberdrola SA - Segment focus
SWOT

15.12 Perceptual Robotics Ltd.

Perceptual Robotics Ltd. - Overview
Perceptual Robotics Ltd. - Product / Service
Perceptual Robotics Ltd. - Key offerings
SWOT

15.13 Skyfish Corp

Skyfish Corp - Overview
Skyfish Corp - Product / Service
Skyfish Corp - Key offerings
SWOT

15.14 SkySpecs Inc.

SkySpecs Inc. - Overview
SkySpecs Inc. - Product / Service
SkySpecs Inc. - Key offerings
SWOT

15.15 Sulzer and Schmid Laboratories

Sulzer and Schmid Laboratories - Overview
Sulzer and Schmid Laboratories - Product / Service
Sulzer and Schmid Laboratories - Key offerings
SWOT

15.16 SZ DJI Technology Co. Ltd.

SZ DJI Technology Co. Ltd. - Overview
SZ DJI Technology Co. Ltd. - Product / Service
SZ DJI Technology Co. Ltd. - Key news
SZ DJI Technology Co. Ltd. - Key offerings
SWOT

15.17 Terra Drone Corp.

Terra Drone Corp. - Overview
Terra Drone Corp. - Product / Service
Terra Drone Corp. - Key offerings
SWOT

15.18 Voliro AG

Voliro AG - Overview
Voliro AG - Product / Service
Voliro AG - Key offerings
SWOT

16. Appendix

16.1 Scope of the report

Market definition
Objectives
Notes and caveats

16.2 Inclusions and exclusions checklist

Inclusions checklist
Exclusions checklist

16.3 Currency conversion rates for US$

16.4 Research methodology

16.5 Data procurement

Information sources

16.6 Data validation

16.7 Validation techniques employed for market sizing

16.8 Data synthesis

16.9 360 degree market analysis

16.10 List of abbreviations

Research Methodology

Technavio presents a detailed picture of the market by way of study, synthesis, and summation of data from multiple sources. The analysts have presented the various facets of the market with a particular focus on identifying the key industry influencers. The data thus presented is comprehensive, reliable, and the result of extensive research, both primary and secondary.

INFORMATION SOURCES

Primary sources

  • Manufacturers and suppliers
  • Channel partners
  • Industry experts
  • Strategic decision makers

Secondary sources

  • Industry journals and periodicals
  • Government data
  • Financial reports of key industry players
  • Historical data
  • Press releases

DATA ANALYSIS

Data Synthesis

  • Collation of data
  • Estimation of key figures
  • Analysis of derived insights

Data Validation

  • Triangulation with data models
  • Reference against proprietary databases
  • Corroboration with industry experts

REPORT WRITING

Qualitative

  • Market drivers
  • Market challenges
  • Market trends
  • Five forces analysis

Quantitative

  • Market size and forecast
  • Market segmentation
  • Geographical insights
  • Competitive landscape

Interested in this report?

Get your sample now to see our research methodology and insights!

Download Now

Frequently Asked Questions

Wind Turbine Inspection Drones market growth will increase by USD 250.5 million during 2026-2030 .

The Wind Turbine Inspection Drones market is expected to grow at a CAGR of 8.7% during 2026-2030 .

Wind Turbine Inspection Drones market is segmented by Application (Onshore wind energy, Offshore wind energy) Type (Remotely piloted, Fully autonomous, Optionally piloted) Component (Hardware, Software, Services)

Aerones Engineering, Airpix, Cyberhawk Innovations, DELAIR SAS, Drone Volt SA, Eagle Eye Innovations Ltd., Eagletronics Aviation Pvt. Ltd., Equinoxs Drones Pvt. Ltd., FORCE Technology, Helvetis, HighEye, Iberdrola SA, NEARTHLAB, Perceptual Robotics Ltd., Skyfish Corp, SkySpecs Inc., Sulzer and Schmid Laboratories, SZ DJI Technology Co. Ltd., Terra Drone Corp., Voliro AG are a few of the key vendors in the Wind Turbine Inspection Drones market.

North America will register the highest growth rate of 40.2% among the other regions. Therefore, the Wind Turbine Inspection Drones market in North America is expected to garner significant business opportunities for the vendors during the forecast period.

China, Japan, India, South Korea, Australia, Indonesia, US, Canada, Mexico, Germany, UK, France, Italy, Spain, The Netherlands, Saudi Arabia, UAE, South Africa, Israel, Turkey, Brazil, Argentina, Chile

  • Integration of advanced sensors and imaging technologies in inspection drones is the driving factor this market.

The Wind Turbine Inspection Drones market vendors should focus on grabbing business opportunities from the Application segment as it accounted for the largest market share in the base year.