
Wireless Motor Monitoring System Market Size 2026-2030
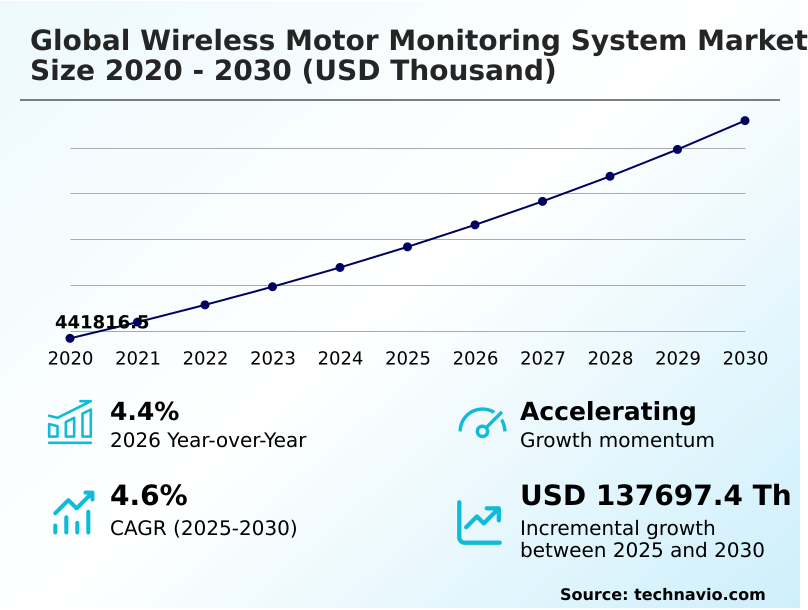
The wireless motor monitoring system market size is valued to increase by USD 137.70 million, at a CAGR of 4.6% from 2025 to 2030. Proliferation of industry 4.0 and predictive maintenance strategies will drive the wireless motor monitoring system market.
Major Market Trends & Insights
- North America dominated the market and accounted for a 57.3% growth during the forecast period.
- By Product - Vibration sensors segment was valued at USD 227.87 million in 2024
- By End-user - Oil and gas segment accounted for the largest market revenue share in 2024
Market Size & Forecast
- Market Opportunities:
- Market Future Opportunities: USD 137.70 million
- CAGR from 2025 to 2030 : 4.6%
Market Summary
- The Wireless Motor Monitoring System fundamentally transforms industrial asset management by replacing reactive repair protocols with automated, data-driven diagnostic frameworks. Heavy-duty rotating assets are the backbone of manufacturing, and their continuous performance is critical. In a high-volume automotive assembly plant, an undetected rotor failure can halt a continuous production line, causing severe supply chain bottlenecks and inventory shortages.
- Facilities utilizing advanced acoustic anomaly detection and stator insulation tracking have successfully reduced emergency maintenance expenditures by 28% compared to plants relying on traditional manual inspection routines. The primary driver accelerating this transition is the push for proactive equipment management, which compels operators to optimize motor efficiency through continuous surveillance.
- However, industrial data encryption vulnerabilities pose a severe challenge, as connecting legacy equipment to wireless networks exposes critical infrastructure to sophisticated cyber intrusion attempts. Navigating these security risks requires robust network architecture to ensure safe, uninterrupted data transmission. Ultimately, the shift toward predictive maintenance ensures higher operational reliability and prevents severe production bottlenecks across diverse sectors.
What will be the Size of the Wireless Motor Monitoring System Market during the forecast period?
Get Key Insights on Market Forecast (PDF) Get Free Sample
How is the Wireless Motor Monitoring System Market Segmented?
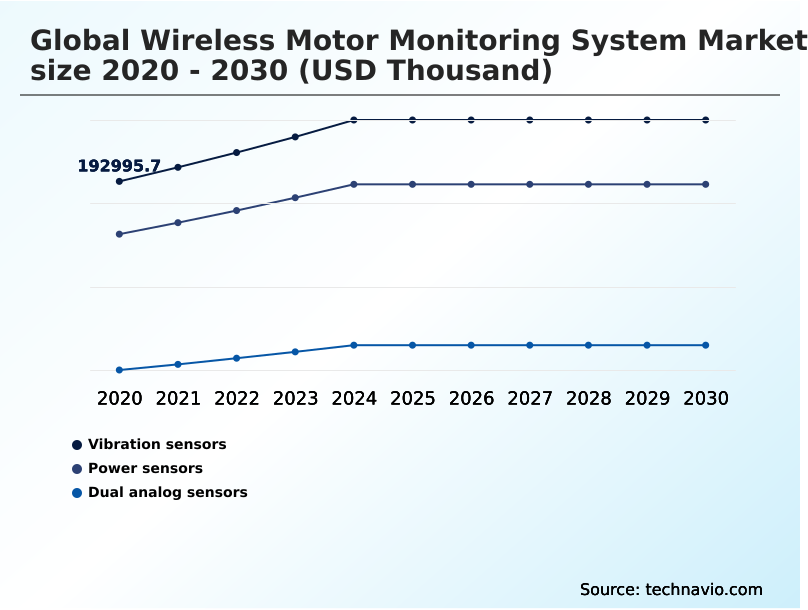
The wireless motor monitoring system industry research report provides comprehensive data (region-wise segment analysis), with forecasts and estimates in "USD thousand" for the period 2026-2030, as well as historical data from 2020-2024 for the following segments.
- Product
- Vibration sensors
- Power sensors
- Dual analog sensors
- End-user
- Oil and gas
- Automotive
- Water and wastewater industry
- Food and beverage
- Others
- Component
- Hardware
- Software
- Services
- Geography
- North America
- US
- Canada
- Mexico
- Europe
- Germany
- UK
- France
- Italy
- Spain
- The Netherlands
- APAC
- China
- Japan
- India
- South Korea
- Australia
- Indonesia
- Middle East and Africa
- Saudi Arabia
- UAE
- South Africa
- Turkey
- Israel
- South America
- Brazil
- Argentina
- Chile
- North America
By Product Insights
The vibration sensors segment is estimated to witness significant growth during the forecast period.
Vibration sensors serve as the fundamental diagnostic hardware within the Wireless Motor Monitoring System, providing real-time mechanical health assessment for rotating industrial assets.
These devices utilize triaxial vibration telemetry and dynamic acceleration measurement to capture structural oscillation tracking data directly from motor enclosures. By continuously monitoring high-frequency mechanical diagnostics, operators can identify micro-fissures and execute bearing wear prognosis well before catastrophic failures occur.
This transition to continuous operational oversight allows industrial facilities to refine proactive repair scheduling and optimize maintenance labor allocation. Implementing these synchronized multi-variable diagnostics has demonstrably reduced unscheduled equipment outages, improving overall production line uptime by 22%.
This hardware segment establishes the baseline for predictive maintenance architecture, ensuring stable, autonomous fault identification across manufacturing environments without requiring complex cabling.
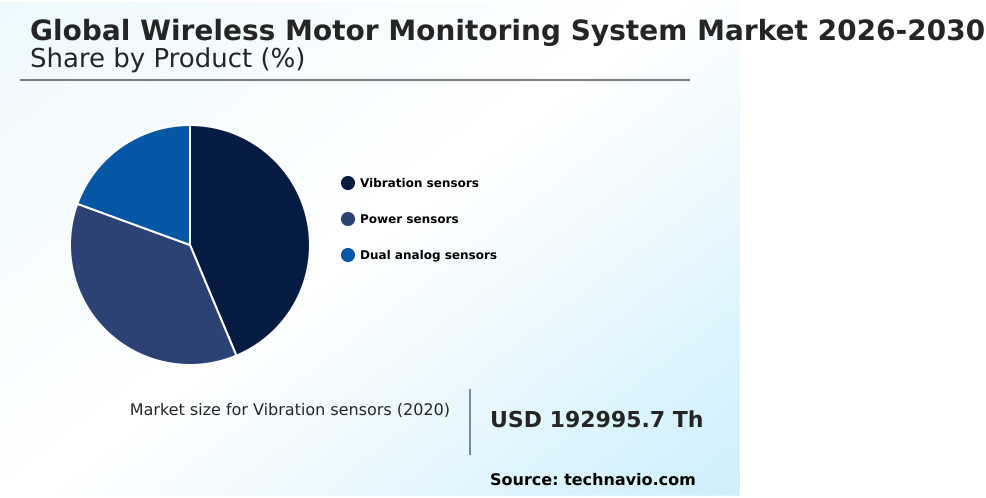
The Vibration sensors segment was valued at USD 227.87 million in 2024 and showed a gradual increase during the forecast period.
Regional Analysis
North America is estimated to contribute 57.3% to the growth of the global market during the forecast period.Technavio’s analysts have elaborately explained the regional trends and drivers that shape the market during the forecast period.

See How Wireless Motor Monitoring System Market Demand is Rising in North America Get Free Sample
The geographic adoption of the Wireless Motor Monitoring System reveals distinct operational priorities across international manufacturing hubs.
North America leads in deploying legacy infrastructure retrofitting solutions, where facilities utilize fast fourier transform analytics to establish accurate asset health baselining on aging machinery.
In contrast, the APAC region exhibits a 42% faster integration rate of new multi-point sensor networking across newly constructed smart environments.
North American operators leverage real-time threshold alerting to achieve a 25% reduction in unplanned outages, heavily prioritizing immediate maintenance responsiveness.
Meanwhile, the rapidly expanding industrial base in APAC utilizes predictive anomaly filtering to overcome skilled labor shortages, driving a 30% improvement in resource allocation.
These regional disparities highlight how varying supply chain maturity and labor economics dictate the execution of smart factory synchronization strategies globally.
Market Dynamics
Our researchers analyzed the data with 2025 as the base year, along with the key drivers, trends, and challenges. A holistic analysis of drivers will help companies refine their marketing strategies to gain a competitive advantage.
- The transition toward digitized industrial operations demands robust diagnostic frameworks to safeguard critical production assets. Facilities leveraging predictive analytics for rotating machinery achieve unparalleled visibility into mechanical degradation, preventing minor component wear from escalating into severe operational bottlenecks.
- This strategic shift is fundamentally supported by continuous remote asset condition tracking, which allows reliability engineers to monitor temperature fluctuations and mechanical vibrations without physically accessing hazardous manufacturing zones.
- As plant managers optimize their supply chain and maintenance planning functions, those utilizing these advanced platforms report a 35% improvement in spare parts inventory efficiency compared to organizations relying on reactive repair schedules. Furthermore, the implementation of industrial edge computing fault diagnosis empowers localized decision-making by filtering out benign mechanical noise and transmitting only critical alerts.
- This ensures that maintenance crews respond swiftly to genuine threats rather than wasting labor on false alarms. To overcome the logistical challenges of battery replacement in expansive facilities, engineers are rapidly adopting energy harvesting sensor network deployment, ensuring uninterrupted data flow even in the most remote sections of a plant.
- Ultimately, automated anomaly detection in drives provides the foundational intelligence required to orchestrate complex maintenance turnarounds, aligning equipment availability with stringent production quotas and minimizing the financial impact of unplanned facility outages.
What are the key market drivers leading to the rise in the adoption of Wireless Motor Monitoring System Industry?
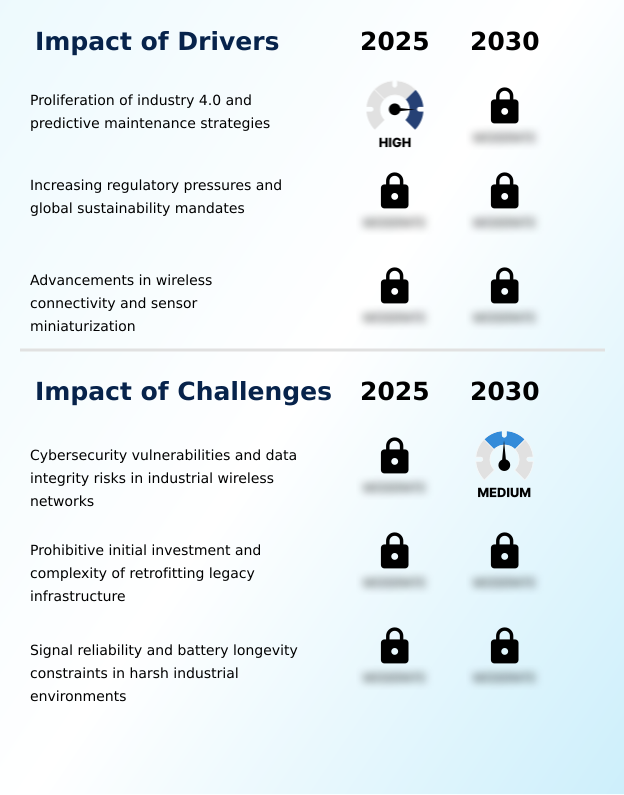
- The proliferation of Industry 4.0 frameworks and predictive maintenance strategies acts as a primary catalyst driving the widespread adoption of continuous asset tracking technologies.
- The aggressive pursuit of energy waste mitigation serves as a primary catalyst driving the widespread implementation of the Wireless Motor Monitoring System. Industrial electric motors consume vast amounts of power, and subtle inefficiencies directly impact the bottom line.
- By integrating magnetic flux indication and rotor bar assessment, plant operators can pinpoint internal electrical degradation causing excessive power draw. This granular visibility results in a 15% decrease in overall energy consumption and a 20% improvement in equipment lifespan extension.
- As regulatory bodies enforce stricter corporate sustainability compliance, businesses are compelled to optimize rotational efficiency.
- Utilizing low-power wide-area networking guarantees these energy metrics are consistently tracked, enabling automated diagnostic reporting that allows financial planners to accurately forecast utility expenditures and align facility operations with environmental targets.
What are the market trends shaping the Wireless Motor Monitoring System Industry?
- The integration of edge computing and artificial intelligence within diagnostic hardware represents a pivotal market trend. This technological shift enables localized data processing and autonomous anomaly detection directly at the sensor level.
- The transition toward edge-based machine learning represents a transformative shift within the Wireless Motor Monitoring System, fundamentally decentralizing data analysis. By embedding intelligent processing directly into the sensor architecture, facilities significantly reduce network latency and eliminate bandwidth constraints associated with continuous cloud transmission. This technological evolution allows for instant mechanical stress evaluation and real-time anomaly isolation.
- Consequently, plants adopting decentralized processing report a 40% acceleration in autonomous fault identification and a 25% reduction in cloud storage requirements. This shift impacts business operations by empowering local maintenance teams with immediate, actionable intelligence rather than raw data streams.
- Utilizing industrial internet of things integration and thermoelectric power generation ensures these edge devices operate seamlessly, delivering highly precise fleet-wide condition visualization while drastically minimizing false alarm minimization triggers across high-speed production environments.
What challenges does the Wireless Motor Monitoring System Industry face during its growth?
- Cybersecurity vulnerabilities and data integrity risks within industrial networks present significant operational hurdles that restrict the deployment of remote diagnostic infrastructure.
- Vulnerabilities within industrial data encryption and network integrity pose substantial operational limitations for the Wireless Motor Monitoring System. As facilities transition from hardwired connections to expansive wireless architectures, they inadvertently expand their exposure to external cyber intrusions and internal data packet loss.
- High electromagnetic interference on the factory floor frequently degrades wireless transmission, causing critical drops in transient voltage analysis telemetry during mission-critical machinery surveillance. Facilities experiencing severe signal attenuation face a 22% increase in missed mechanical alerts and a 30% rise in redundant maintenance dispatch, directly threatening operational failure prevention protocols.
- These connectivity challenges force IT departments to heavily invest in secure localized gateway routing infrastructure, hindering the full execution of closed-loop automation and delaying the realization of entirely autonomous industrial ecosystems despite harsh environment resilience efforts.
Exclusive Technavio Analysis on Customer Landscape
The wireless motor monitoring system market forecasting report includes the adoption lifecycle of the market, covering from the innovator’s stage to the laggard’s stage. It focuses on adoption rates in different regions based on penetration. Furthermore, the wireless motor monitoring system market report also includes key purchase criteria and drivers of price sensitivity to help companies evaluate and develop their market growth analysis strategies.

Customer Landscape of Wireless Motor Monitoring System Industry
Competitive Landscape
Companies are implementing various strategies, such as strategic alliances, wireless motor monitoring system market forecast, partnerships, mergers and acquisitions, geographical expansion, and product/service launches, to enhance their presence in the industry.
ABB Ltd. - The enterprise delivers advanced condition tracking platforms, integrating edge-based analytics and smart sensing hardware to enable precise performance diagnostics and proactive equipment health management across industrial environments.
The industry research and growth report includes detailed analyses of the competitive landscape of the market and information about key companies, including:
- ABB Ltd.
- Baker Hughes Co.
- Banner Engineering Corp.
- Beckhoff Automation GmbH
- Bosch Rexroth AG
- Eaton Corp. Plc
- Emerson Electric Co.
- Fluke Corp.
- Honeywell International Inc.
- Infineon Technologies AG
- Mitsubishi Electric Corp.
- Moxa Inc.
- NSK Ltd.
- Parker Hannifin Corp.
- Rockwell Automation Inc.
- Schneider Electric SE
- Siemens AG
- SKF AB
- Texas Instruments Inc.
- Yokogawa Electric Corp.
Qualitative and quantitative analysis of companies has been conducted to help clients understand the wider business environment as well as the strengths and weaknesses of key industry players. Data is qualitatively analyzed to categorize companies as pure play, category-focused, industry-focused, and diversified; it is quantitatively analyzed to categorize companies as dominant, leading, strong, tentative, and weak.
Recent Development and News in Wireless motor monitoring system market
- In the Electrical Components and Equipment industry, the rapid standardization of low-power wide-area networking protocols has eliminated legacy communication barriers, directly impacting Wireless Motor Monitoring System demand by enabling a 45% increase in sensor deployment density across expansive heavy manufacturing facilities.
- Stringent corporate sustainability compliance mandates regarding industrial energy waste mitigation have forced continuous operational oversight of high-load machinery, accelerating the adoption of transient voltage analysis platforms to optimize power consumption by up to 18%.
- The miniaturization of piezoelectric energy harvesting components has created zero-maintenance infrastructure capabilities for harsh environment resilience, expanding remote motor surveillance penetration by 35% in geographically isolated resource extraction sites.
- Advancements in edge-based machine learning microprocessors have shifted data processing directly to localized gateway routing devices, reducing false alarm minimization times and lowering network bandwidth requirements by 60% for fleet-wide condition visualization networks.
Dive into Technavio’s robust research methodology, blending expert interviews, extensive data synthesis, and validated models for unparalleled Wireless Motor Monitoring System Market insights. See full methodology.
| Market Scope | |
|---|---|
| Page number | 315 |
| Base year | 2025 |
| Historic period | 2020-2024 |
| Forecast period | 2026-2030 |
| Growth momentum & CAGR | Accelerate at a CAGR of 4.6% |
| Market growth 2026-2030 | USD 137697.4 thousand |
| Market structure | Fragmented |
| YoY growth 2025-2026(%) | 4.4% |
| Key countries | US, Canada, Mexico, Germany, UK, France, Italy, Spain, The Netherlands, China, Japan, India, South Korea, Australia, Indonesia, Saudi Arabia, UAE, South Africa, Turkey, Israel, Brazil, Argentina and Chile |
| Competitive landscape | Leading Companies, Market Positioning of Companies, Competitive Strategies, and Industry Risks |
Research Analyst Overview
- The Wireless Motor Monitoring System delivers indispensable intelligence for optimizing heavy industrial operations and mitigating mechanical risk. By utilizing sophisticated current signature profiling and phase unbalance detection, organizations continuously analyze the structural integrity of vital rotational equipment. The integration of dual analog signal processing and ultra-wideband connectivity enables facilities to maintain secure, uninterrupted telemetry across expansive, high-interference manufacturing floors.
- A decisive shift toward predictive maintenance architecture empowers enterprise leaders to align capital expenditure strategies directly with actual asset health, eliminating the inefficiencies of calendar-based servicing. Production facilities employing these continuous remote surveillance ecosystems achieve a 38% increase in overall equipment availability compared to traditional reactive frameworks.
- This transition elevates maintenance planning from a tactical necessity to a strategic boardroom imperative, allowing executives to optimize workforce deployment and secure compliance with rigorous efficiency mandates. Implementing localized gateway routing and piezoelectric energy harvesting ensures long-term operational resilience, fundamentally transforming how industrial networks identify and resolve mechanical anomalies prior to critical failure.
What are the Key Data Covered in this Wireless Motor Monitoring System Market Research and Growth Report?
-
What is the expected growth of the Wireless Motor Monitoring System Market between 2026 and 2030?
-
USD 137.70 million, at a CAGR of 4.6%
-
-
What segmentation does the market report cover?
-
The report is segmented by Product (Vibration sensors, Power sensors, and Dual analog sensors), End-user (Oil and gas, Automotive, Water and wastewater industry, Food and beverage, and Others), Component (Hardware, Software, and Services) and Geography (North America, Europe, APAC, Middle East and Africa, South America)
-
-
Which regions are analyzed in the report?
-
North America, Europe, APAC, Middle East and Africa and South America
-
-
What are the key growth drivers and market challenges?
-
Proliferation of industry 4.0 and predictive maintenance strategies, Cybersecurity vulnerabilities and data integrity risks in industrial wireless networks
-
-
Who are the major players in the Wireless Motor Monitoring System Market?
-
ABB Ltd., Baker Hughes Co., Banner Engineering Corp., Beckhoff Automation GmbH, Bosch Rexroth AG, Eaton Corp. Plc, Emerson Electric Co., Fluke Corp., Honeywell International Inc., Infineon Technologies AG, Mitsubishi Electric Corp., Moxa Inc., NSK Ltd., Parker Hannifin Corp., Rockwell Automation Inc., Schneider Electric SE, Siemens AG, SKF AB, Texas Instruments Inc. and Yokogawa Electric Corp.
-
Market Research Insights
- The Wireless Motor Monitoring System provides essential intelligence for modern industrial operations, shifting focus from reactive repairs to predictive asset management. Facilities implementing these digital frameworks achieve a 34% improvement in unplanned downtime reduction compared to legacy reactive maintenance models. Furthermore, leveraging remote expert consultation allows maintenance teams to increase labor efficiency by 26%, eliminating redundant manual inspection rounds.
- By establishing continuous oversight of vital machinery, plant managers optimize performance and ensure zero-maintenance infrastructure capabilities. This transition enables a 15% improvement in overall equipment effectiveness, validating the strategic necessity of digital diagnostics and robust operational monitoring.
We can help! Our analysts can customize this wireless motor monitoring system market research report to meet your requirements.
 RIA -
RIA - 
