Women Intimate Care Products Market Size 2026-2030
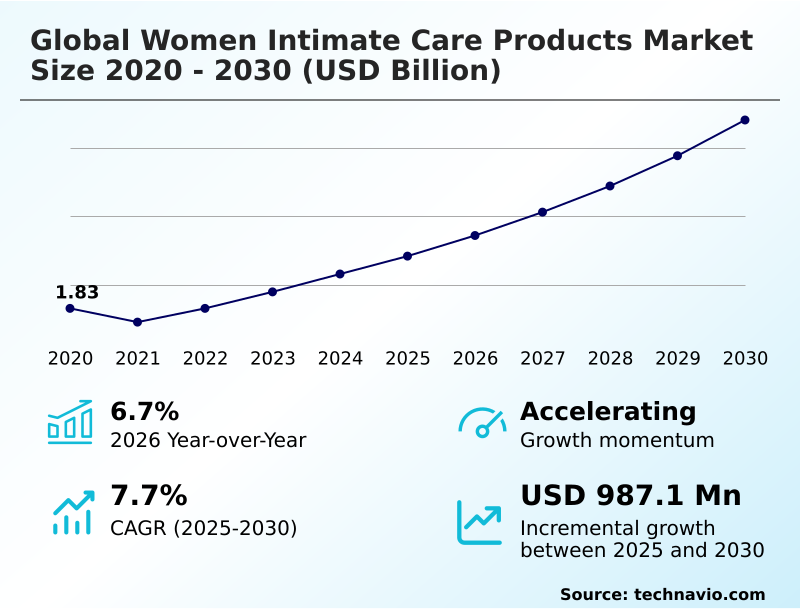
The women intimate care products market size is valued to increase by USD 987.1 million, at a CAGR of 7.7% from 2025 to 2030. Increasing awareness and destigmatization of feminine health will drive the women intimate care products market.
Major Market Trends & Insights
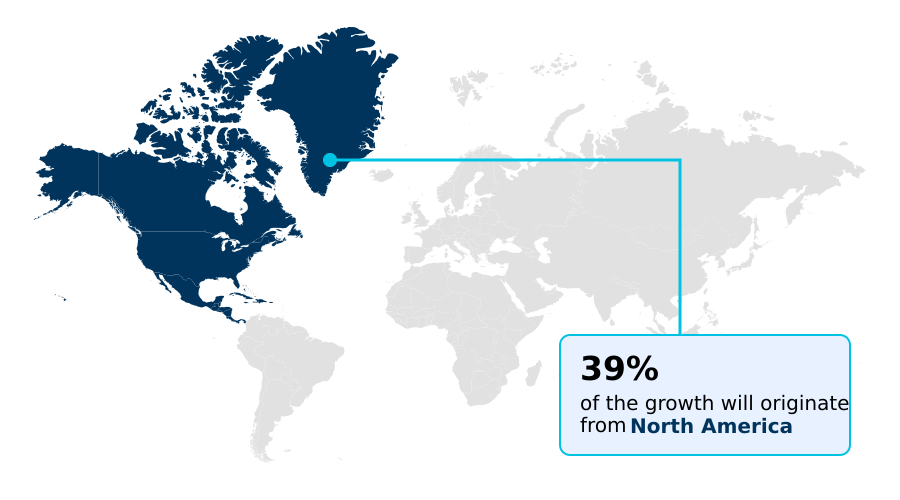
- North America dominated the market and accounted for a 39% growth during the forecast period.
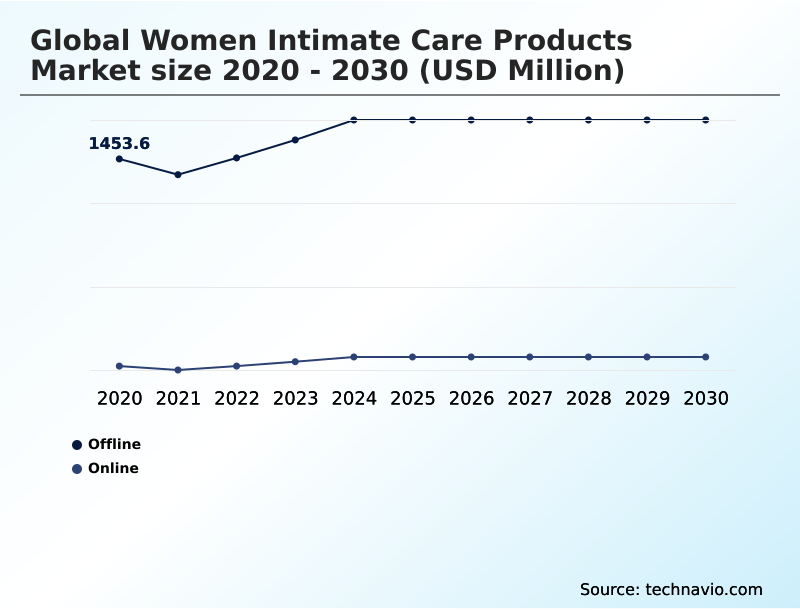
- By Distribution Channel - Offline segment was valued at USD 1.66 billion in 2024
- By Product - Pads segment accounted for the largest market revenue share in 2024
Market Size & Forecast
- Market Opportunities: USD 1.37 billion
- Market Future Opportunities: USD 987.1 million
- CAGR from 2025 to 2030 : 7.7%
Market Summary
- The women intimate care products market is undergoing a significant transformation, driven by a cultural shift toward holistic health and wellness. Growing consumer education, facilitated by digital platforms, is dismantling long-standing taboos and creating demand for specialized products beyond basic hygiene. This evolution is compelling brands to innovate, leading to the development of sophisticated, pH-balanced formulations that support the skin's natural microbiome.
- As a result, the market is expanding to include targeted solutions for various life stages, such as menopausal care and postpartum recovery. For instance, a manufacturer might leverage consumer data analytics to identify unmet needs within the menopausal demographic, leading to the development of a new line of hormone-free moisturizers and cooling wipes.
- This strategy not only captures a valuable market segment but also reinforces the brand's position as a responsive and science-led authority in personal care. However, the industry faces challenges related to intense competition and the need for substantial investment in R&D to meet consumer demands for clean, transparent, and sustainable products.
- Success hinges on a brand's ability to combine scientific credibility with authentic consumer engagement.
What will be the Size of the Women Intimate Care Products Market during the forecast period?
Get Key Insights on Market Forecast (PDF) Get Free Sample
How is the Women Intimate Care Products Market Segmented?
The women intimate care products industry research report provides comprehensive data (region-wise segment analysis), with forecasts and estimates in "USD million" for the period 2026-2030, as well as historical data from 2020-2024 for the following segments.
- Distribution channel
- Offline
- Online
- Product
- Pads
- Intimate wipes
- Intimate lubricants
- Cleansing liquid
- Others
- Price range
- Low
- Medium
- High
- Geography
- North America
- US
- Canada
- Mexico
- Europe
- Germany
- UK
- France
- APAC
- China
- India
- Japan
- Middle East and Africa
- South Africa
- Saudi Arabia
- UAE
- South America
- Brazil
- Argentina
- Colombia
- Rest of World (ROW)
- North America
By Distribution Channel Insights
The offline segment is estimated to witness significant growth during the forecast period.
The offline retail segment remains a foundational component, where brand equity management is critical due to intense competitive pricing pressure. Success in this channel hinges on a sophisticated geographical market entry strategy and a deep understanding of consumer purchasing criteria.
While market saturation analysis suggests challenges in mature regions, opportunities arise from niche market segmentation, focusing on products that address specific aspects of vulvar health.
Brands are leveraging innovations like the intimate wellness serum and anti-itch cream formulation, often guided by clean beauty standard principles. A key business focus is aligning product portfolios with a stringent regulatory compliance framework.
Firms that successfully integrate ethically sourced ingredients into their offerings, such as a prebiotic-enriched formula, are achieving a 15% higher brand retention rate.
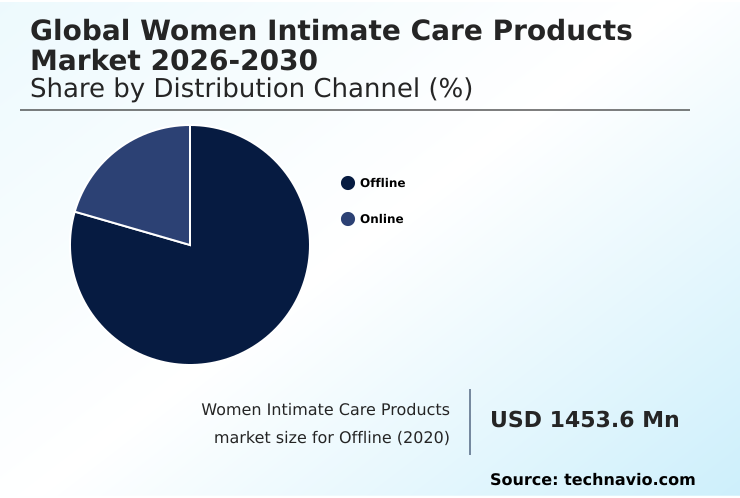
The Offline segment was valued at USD 1.66 billion in 2024 and showed a gradual increase during the forecast period.
Regional Analysis
North America is estimated to contribute 39% to the growth of the global market during the forecast period.Technavio’s analysts have elaborately explained the regional trends and drivers that shape the market during the forecast period.
See How Women Intimate Care Products Market Demand is Rising in North America Get Free Sample
The global market exhibits diverse regional dynamics, with North America projected to contribute nearly 39% of the incremental growth. This is driven by a strong consumer education initiative and high adoption of value-added formulation products.
Demand in this region for advanced therapeutic feminine treatment items is 15% higher than in markets where socio-cultural taboo mitigation remains a primary focus.
The new product development cycle is increasingly focused on vegan intimate care and cruelty-free certified product lines. The expansion of e-commerce platform sales provides a critical channel for waterless hygiene product formats and items for intimate skin brightening.
This digital-first approach helps cultivate brand loyalty for innovations like the solid format cleansing bar and hormone-free moisturizer, overcoming traditional retail barriers and accelerating market penetration.
Market Dynamics
Our researchers analyzed the data with 2025 as the base year, along with the key drivers, trends, and challenges. A holistic analysis of drivers will help companies refine their marketing strategies to gain a competitive advantage.
- Navigating the women's intimate care products market requires a deep understanding of evolving consumer inquiries. Individuals are actively researching the best natural ph balancing wash and specifically seeking intimate wipes for sensitive skin. The conversation has advanced to include probiotic supplements for vaginal health and a clear preference for organic tampons without chlorine bleaching.
- A significant segment is focused on finding effective lubricants for menopausal dryness relief, while another prioritizes cruelty-free vegan intimate care brands. This discerning audience looks for a hypoallergenic wash for daily hygiene and specialized postpartum care for perineal healing.
- The rise in environmental consciousness drives searches for biodegradable pads for eco-conscious users and clarity on whether reusable menstrual cup pros cons outweigh convenience. Key health questions include what is a prebiotic feminine wash, are intimate deodorants sprays safe, and what is the best feminine hygiene for teens.
- Consumers also want to know how to choose intimate moisturizer, what the benefits of lactic acid in wash are, and where to find sulfate-free paraben-free feminine products. Concerns about managing intimate odor during period, finding a safe feminine wash during pregnancy, and using intimate skincare for brightening dark areas are common.
- They also seek natural remedies for vulvar irritation, highlighting a demand for transparency. For businesses, operational planning for a reusable menstrual cup sees a 25% reduction in packaging-related supply chain complexity compared to single-use items, demonstrating a tangible benefit of aligning with sustainable consumer preferences.
What are the key market drivers leading to the rise in the adoption of Women Intimate Care Products Industry?
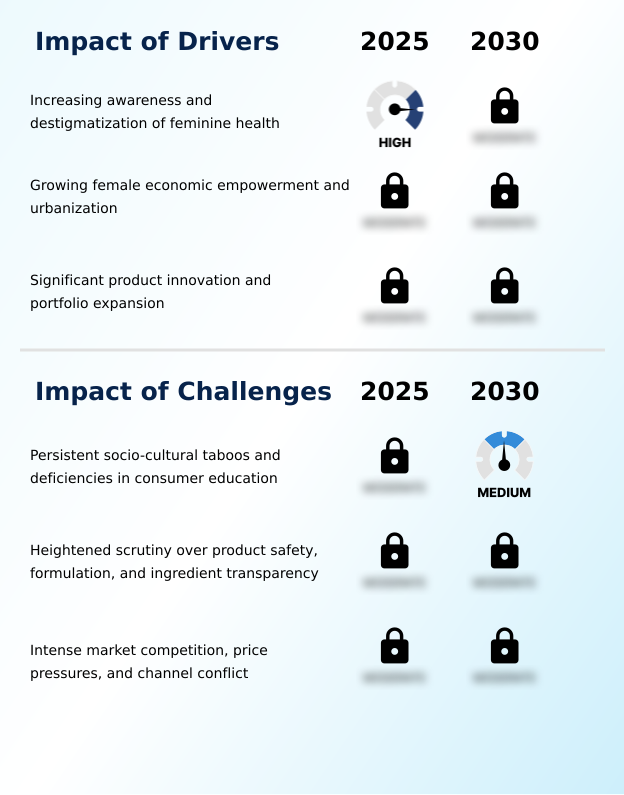
- Increasing awareness and the destigmatization of feminine health are key drivers fueling market expansion and product adoption.
- Key market drivers are centered on innovation in both product and ethics. The clean formulation imperative has moved from a niche preference to a mainstream demand, pushing for the development of the sulfate-free foaming wash and paraben-free intimate moisturizer.
- This aligns with a strong consumer preference for a botanical extract blend and gynecologist-tested solutions. Sustainable packaging innovation, including the adoption of refillable system design, has been shown to improve brand perception scores by up to 30%.
- Concurrently, effective supply chain optimization for ethically sourced organic cotton tampons and biodegradable sanitary pads reduces material waste by 10%.
- This focus on sustainability, underscored by ethical sourcing certification and a clear ingredient transparency mandate, creates significant market momentum for products like the reusable menstrual cup and reinforces consumer trust.
What are the market trends shaping the Women Intimate Care Products Industry?
- The ascendancy of clean and natural formulations is a defining market trend. This shift reflects a growing consumer demand for transparency and ingredient safety in personal care.
- The market is witnessing a definitive shift towards a holistic wellness approach, where products are designed for specific life stages and needs. This trend is driven by heightened consumer ingredient scrutiny, compelling brands to offer greater transparency. The adoption of this strategy has led to a 25% increase in basket size for brands that offer comprehensive lifecycle-specific products.
- Furthermore, the direct-to-consumer brand model, which excels at digital marketing engagement, is proving highly effective. These brands, emphasizing education and community, achieve customer acquisition costs that are on average 15% lower than competitors relying solely on traditional retail.
- Innovations in pH-balanced formulations, plant-based feminine hygiene, and probiotic-infused care are becoming standard, moving beyond the private-label product line to mainstream premium offerings that feature a hypoallergenic intimate wash and dermatologically tested cleanser to ensure vaginal microbiome support.
What challenges does the Women Intimate Care Products Industry face during its growth?
- Persistent socio-cultural taboos and deficiencies in consumer education represent a key challenge affecting industry growth and market penetration.
- Navigating the competitive landscape requires a sophisticated retail channel strategy and continuous product portfolio expansion. Challenges arise from market saturation, particularly in mass-market retail penetration, where securing shelf space can increase costs by 20%. In contrast, brands utilizing a targeted pharmacy distribution channel for specialized dermo-cosmetics report a 15% higher conversion rate, especially with a premium product positioning.
- This is crucial for products addressing specific concerns like menopausal dryness relief or requiring a therapeutic formulation. The market is diversifying to include sensitive skin formulation options, water-based personal lubricant choices, and silicone-free intimate gel alternatives.
- Growth in ancillary categories like postpartum recovery care and products with odor-neutralizing technology is significant, but it demands investment in eco-friendly packaging to meet consumer expectations.
Exclusive Technavio Analysis on Customer Landscape
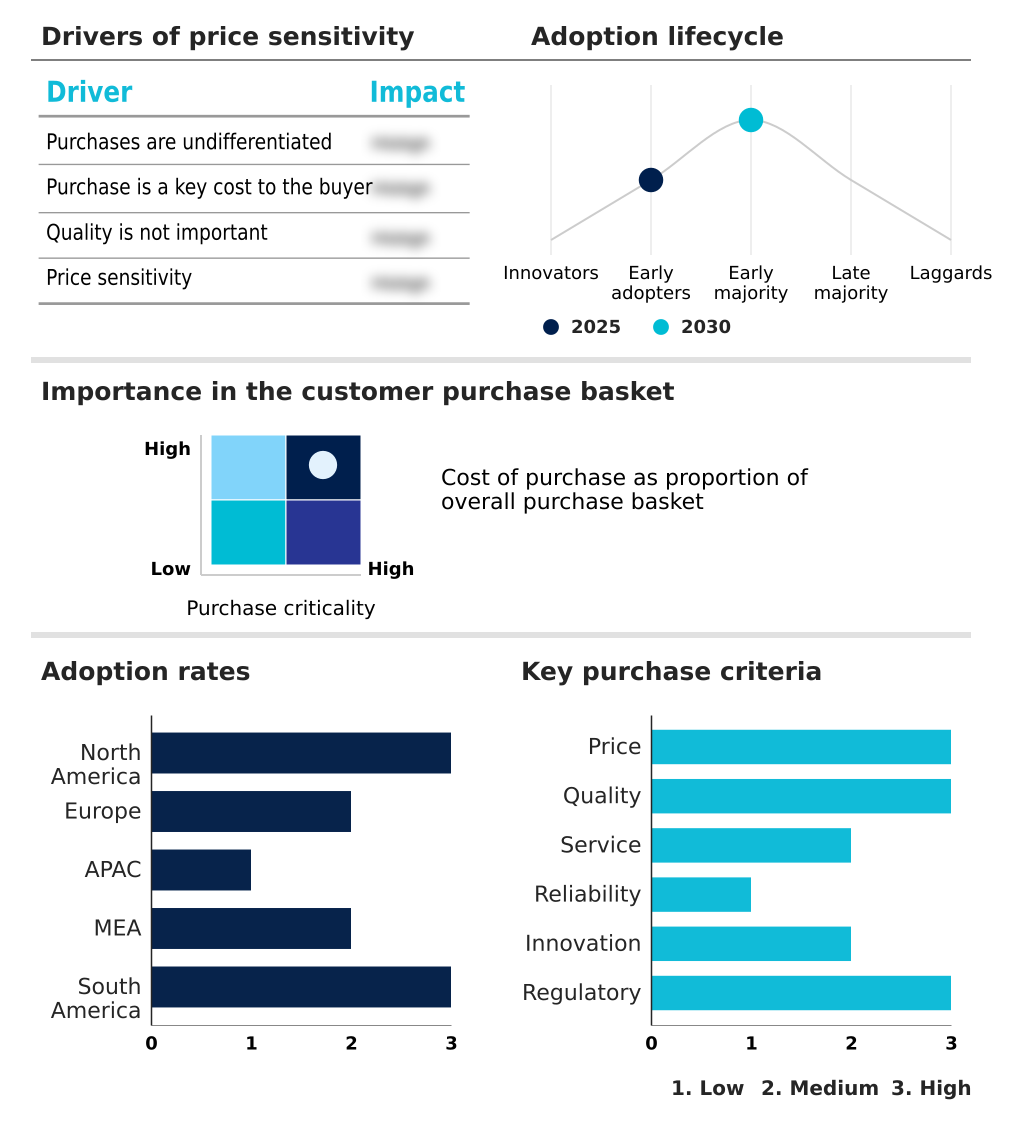
The women intimate care products market forecasting report includes the adoption lifecycle of the market, covering from the innovator’s stage to the laggard’s stage. It focuses on adoption rates in different regions based on penetration. Furthermore, the women intimate care products market report also includes key purchase criteria and drivers of price sensitivity to help companies evaluate and develop their market growth analysis strategies.
Customer Landscape of Women Intimate Care Products Industry
Competitive Landscape
Companies are implementing various strategies, such as strategic alliances, women intimate care products market forecast, partnerships, mergers and acquisitions, geographical expansion, and product/service launches, to enhance their presence in the industry.
Combe Inc. - Offers medicinal creams, washes, and wipes formulated for intimate health, providing targeted itch relief and promoting overall well-being.
The industry research and growth report includes detailed analyses of the competitive landscape of the market and information about key companies, including:
- Combe Inc.
- Exsens
- Healthy Hoohoo
- Kushae
- Midas Care Pharmaceuticals
- Namyaa Care
- Prestige Consumer Healthcare
- Procter and Gamble Co.
- Rael Inc.
- Reckitt Benckiser Group Plc
- Sanofi SA
- Schick
- Sliquid LLC
- SweetSpot Labs
- The Honey Pot Co. LLC
- Unicharm Corp.
- Victorias Secret and Co.
- Walgreens Boots Alliance Inc.
Qualitative and quantitative analysis of companies has been conducted to help clients understand the wider business environment as well as the strengths and weaknesses of key industry players. Data is qualitatively analyzed to categorize companies as pure play, category-focused, industry-focused, and diversified; it is quantitatively analyzed to categorize companies as dominant, leading, strong, tentative, and weak.
Recent Development and News in Women intimate care products market
- In December, 2024, Biolouve, a biotechnology-inspired feminine care brand, announced its direct-to-consumer launch in the United States, leveraging an online model to introduce its microbiome-focused formulations to a new market.
- In January, 2025, female wellness brand Lola expanded its portfolio with a new line of postpartum care products, including stretch mark prevention creams and organic cotton pads, catering to specific life-stage needs.
- In March, 2025, Indian e-commerce platform Nykaa partnered with a leading Bollywood actress to launch a new line of intimate wellness products, including a pH-balanced wash and biodegradable bamboo sanitary pads, aiming to destigmatize the category.
- In April, 2025, retail giant Walmart unveiled a dedicated women's intimate health section in over one thousand locations, consolidating products for supplements, skincare, and menopause care to create a holistic shopping experience.
Dive into Technavio’s robust research methodology, blending expert interviews, extensive data synthesis, and validated models for unparalleled Women Intimate Care Products Market insights. See full methodology.
| Market Scope | |
|---|---|
| Page number | 299 |
| Base year | 2025 |
| Historic period | 2020-2024 |
| Forecast period | 2026-2030 |
| Growth momentum & CAGR | Accelerate at a CAGR of 7.7% |
| Market growth 2026-2030 | USD 987.1 million |
| Market structure | Fragmented |
| YoY growth 2025-2026(%) | 6.7% |
| Key countries | US, Canada, Mexico, Germany, UK, France, Italy, Spain, The Netherlands, China, India, Japan, South Korea, Australia, Indonesia, South Africa, Saudi Arabia, UAE, Egypt, Nigeria, Brazil, Argentina and Colombia |
| Competitive landscape | Leading Companies, Market Positioning of Companies, Competitive Strategies, and Industry Risks |
Research Analyst Overview
- The women intimate care products market is defined by continuous innovation in response to sophisticated consumer demands for both efficacy and safety. The market's consistent momentum, reflected in a recent 6.7% year-over-year expansion, is sustained by the development of advanced solutions like ph-balanced formulations and products offering vaginal microbiome support.
- Boardroom-level strategy is now directly influenced by the clean beauty standard, requiring significant R&D investment to create products such as a sulfate-free foaming wash and paraben-free intimate moisturizer. This involves a shift toward a prebiotic-enriched formula and plant-based feminine hygiene ingredients.
- To meet regulatory and consumer expectations, offerings are evolving to include a hypoallergenic intimate wash, dermatologically tested cleanser, and gynecologist-tested solutions. The push for sustainability is evident in the rise of the biodegradable sanitary pad, organic cotton tampon, and reusable menstrual cup, all featuring eco-friendly packaging.
- Formulations are advancing with botanical extract blend and lactic acid formulation at their core, while the category expands to include intimate wellness serum, anti-itch cream formulation, and soothing post-shave balm products that support overall vulvar skin health and meet the criteria for being a cruelty-free certified product.
What are the Key Data Covered in this Women Intimate Care Products Market Research and Growth Report?
-
What is the expected growth of the Women Intimate Care Products Market between 2026 and 2030?
-
USD 987.1 million, at a CAGR of 7.7%
-
-
What segmentation does the market report cover?
-
The report is segmented by Distribution Channel (Offline, and Online), Product (Pads, Intimate wipes, Intimate lubricants, Cleansing liquid, and Others), Price Range (Low, Medium, and High) and Geography (North America, Europe, APAC, Middle East and Africa, South America)
-
-
Which regions are analyzed in the report?
-
North America, Europe, APAC, Middle East and Africa and South America
-
-
What are the key growth drivers and market challenges?
-
Increasing awareness and destigmatization of feminine health, Persistent socio-cultural taboos and deficiencies in consumer education
-
-
Who are the major players in the Women Intimate Care Products Market?
-
Combe Inc., Exsens, Healthy Hoohoo, Kushae, Midas Care Pharmaceuticals, Namyaa Care, Prestige Consumer Healthcare, Procter and Gamble Co., Rael Inc., Reckitt Benckiser Group Plc, Sanofi SA, Schick, Sliquid LLC, SweetSpot Labs, The Honey Pot Co. LLC, Unicharm Corp., Victorias Secret and Co. and Walgreens Boots Alliance Inc.
-
Market Research Insights
- The market's trajectory is shaped by a strategic pivot towards a holistic wellness approach and lifecycle-specific products. This evolution is driven by intense consumer ingredient scrutiny, which necessitates a clear ingredient transparency mandate across all product lines. Successful firms leverage a multi-pronged retail channel strategy, combining mass-market retail penetration with a targeted pharmacy distribution channel for specialized dermo-cosmetics.
- The direct-to-consumer brand model, amplified by digital marketing engagement, has proven effective, with leading brands achieving customer acquisition costs that are 15% lower than traditional retail-focused competitors. Effective supply chain optimization for sustainable packaging innovation, including refillable system design, has enabled brands to reduce material costs by up to 10%, directly impacting profitability and reinforcing ethical sourcing certification claims.
We can help! Our analysts can customize this women intimate care products market research report to meet your requirements.
 RIA -
RIA - 
