Wood Packaging Market Analysis APAC, Middle East and Africa, South America, North America, Europe - India, China, Japan, Iran, Brazil - Size and Forecast 2024-2028

Wood Packaging Market Analysis APAC, Middle East and Africa, South America, North America, Europe - India, China, Japan, Iran, Brazil - Size and Forecast 2024-2028

Published: Aug 2024 172 Pages SKU: IRTNTR45616

Market Overview at a Glance

$18.8 B
Market Opportunity
4.6%
CAGR
4.16
YoY growth 2023-2024(%)

Wood Packaging Market Size 2024-2028

The wood packaging market size is forecast to increase by USD 18.8 billion at a CAGR of 4.6% between 2023 and 2028.

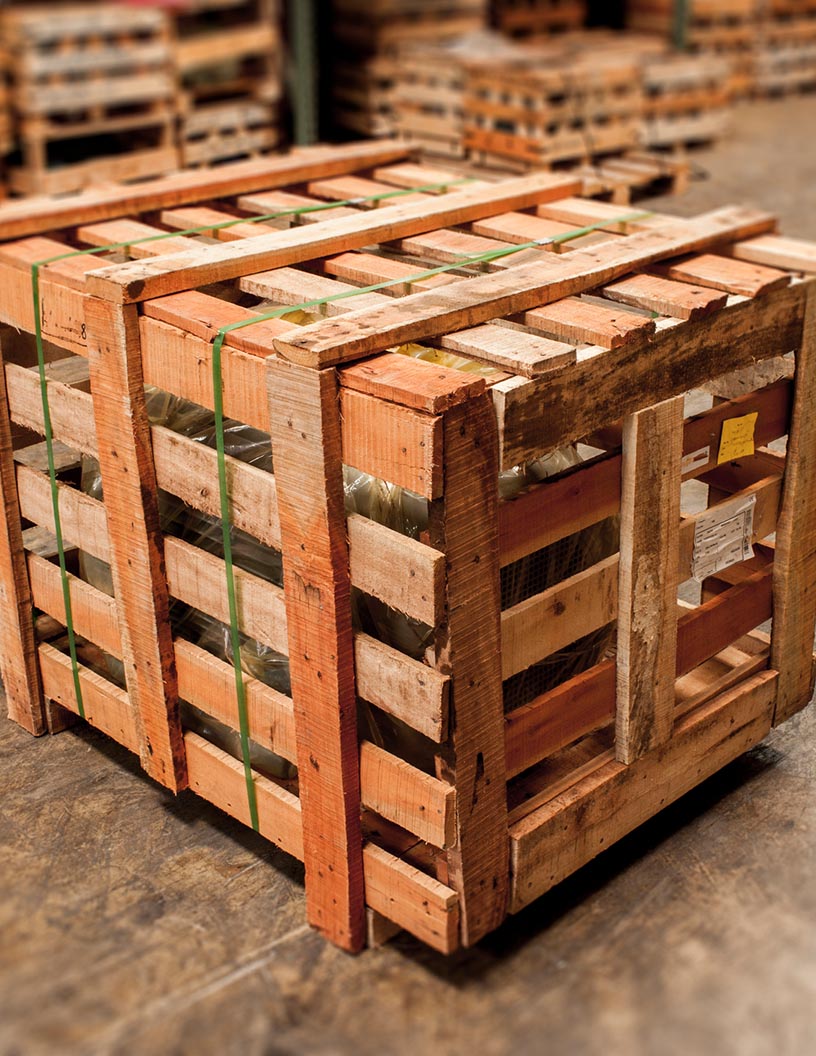
  • The market is experiencing significant growth due to the cost benefits it offers over alternative materials. This sector is witnessing innovation In the design and production of wooden pallets, which is driving market expansion. However, fluctuating raw material prices pose a challenge to market growth. The use of wood packaging is increasingly popular due to its sustainability and versatility, making it a preferred choice for various industries. This market caters to various industries, with a significant focus on export-oriented packaging for e-commerce and food & beverages storage. The cost-effectiveness of wood packaging, particularly for bulk and heavy products, is a major factor contributing to its market growth. Furthermore, the continuous innovation in the design and engineering of wooden pallets is expanding their applications and enhancing their value proposition. Hardwood and softwood, as well as plywood, are popular choices for wood packaging, with their durability and strength making them suitable for transportation applications. Despite these growth factors, the market faces challenges from the volatility of raw material prices, which can impact the profitability of manufacturers. Overall, the market is expected to continue its growth trajectory, driven by its cost benefits and the ongoing innovation in wooden pallet design.

What will be the Size of the Wood Packaging Market During the Forecast Period?

Wood Packaging Market Size

 Request Free Sample

  • The market encompasses a diverse range of products, including wooden crates, pallets, boxes, bins, cases, spools, dunnage, and various types of wooden drums. The use of eco-friendly packaging materials and sustainable alternatives has gained considerable traction due to growing environmental concerns. However, concerns about deforestation and the ecological impact of wood packaging production and transportation have led to increased scrutiny.
  • Efforts to reduce carbon emissions and transportation costs are driving innovation In the market, with research and development focused on improving the sustainability and efficiency of wood packaging solutions.

How is the Wood Packaging Industry segmented and which is the largest segment?

The wood packaging industry research report provides comprehensive data (region-wise segment analysis), with forecasts and estimates in "USD billion" for the period 2024-2028, as well as historical data from 2018-2022 for the following segments.

  • Product
    • Pallets
    • Cases and boxes
  • Application
    • Food and beverages storage
    • Transportation
    • Industrial
    • Shipping
    • Others
  • Geography
    • APAC
      • China
      • India
      • Japan
    • Middle East and Africa
    • South America
      • Brazil
    • North America
    • Europe

By Product Insights

  • The pallets segment is estimated to witness significant growth during the forecast period.

The market encompasses various product categories, including wooden crates, pallets, boxes, bins, cases, spools, and dunnage. Among these, pallets held the largest market share in 2023. This growth can be attributed to the construction industry's expansion, particularly in Asia Pacific, where urbanization and increasing disposable income are driving residential building construction. Wooden pallets offer higher load capacity compared to alternatives like plastic pallets, making them a preferred choice for transporting heavy construction materials. Ecofriendly packaging materials and sustainable practices are gaining traction In the market due to environmental concerns. Wooden packaging alternatives, such as hardwood and softwood pallets, crates, cases, boxes, and bins, are being adopted for their sustainability and circular economy initiatives.

Despite these benefits, concerns regarding deforestation and the ecological impact of transportation costs and carbon emissions persist. Sustainable sourcing and eco-friendly practices are essential to mitigate these concerns and ensure the market's long-term growth.

Wood Packaging Market Size

Get a glance at the market report of share of various segments Request Free Sample

The Pallets segment was valued at USD 55.80 billion in 2018 and showed a gradual increase during the forecast period.

Regional Analysis

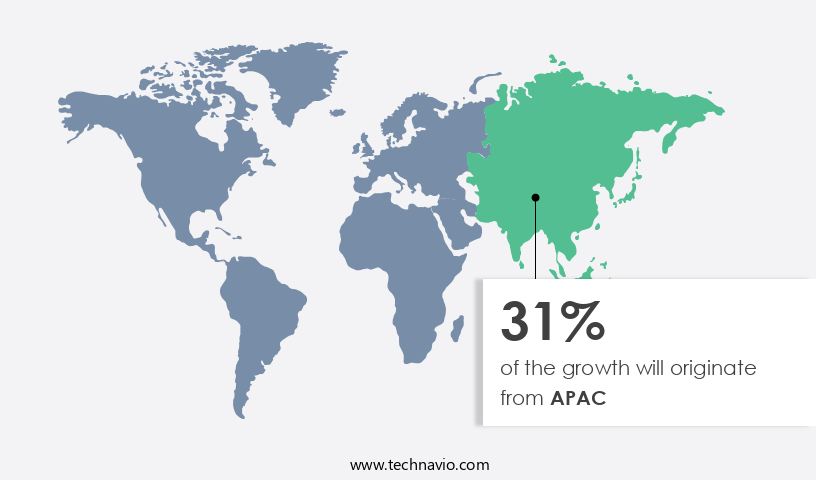
  • APAC is estimated to contribute 31% to the growth of the global market during the forecast period.

Technavio's analysts have elaborately explained the regional trends and drivers that shape the market during the forecast period.

Wood Packaging Market Share by Geography

For more insights on the market size of various regions, Request Free Sample

The market in APAC is experiencing significant growth, driven primarily by the e-commerce and retail industries. China and India are leading markets in this region, with the food and beverage sector being a major consumer of wooden crates, cases, boxes, and drums. The region's high GDP growth rate is a significant macroeconomic factor fueling the market's expansion. Countries such as Vietnam, Singapore, South Korea, Australia, and Malaysia are contributing to the growth of the packaging market, thereby boosting the demand for wood packaging. Sustainable sourcing, ecofriendly practices, and circular economy initiatives are increasingly influencing the market, with a focus on using sustainable alternatives such as hardwood, softwood, plywood, and other eco-friendly packaging materials.

Environmental concerns, including deforestation and ecological impact, are also being addressed through the use of sustainable practices and transportation cost reduction measures, such as optimizing pallet and crate designs to minimize carbon emissions.

Market Dynamics

Our researchers analyzed the data with 2023 as the base year, along with the key drivers, trends, and challenges. A holistic analysis of drivers will help companies refine their marketing strategies to gain a competitive advantage.

What are the key market drivers leading to the rise In the adoption of Wood Packaging Industry?

Cost benefits associated with wood packaging is the key driver of the market.

  • Export-oriented businesses are seeking cost-effective and sustainable packaging solutions for shipping goods internationally. Wood packaging, including wooden crates, pallets, boxes, bins, spools, and dunnage, is a popular choice due to its affordability and ecofriendly attributes. Compared to plastic alternatives, wooden packaging solutions offer lower costs, with the average price of wooden pallets being half that of plastic pallets. Moreover, wooden packaging is 100% recyclable, reducing environmental concerns related to deforestation and ecological impact. As businesses prioritize sustainable sourcing and ecofriendly practices, circular economy initiatives In the manufacturing, construction, consumer goods, industrial, and logistics sectors are increasingly adopting wooden packaging. Transportation costs and carbon emissions are significant concerns, making the use of lightweight and stackable wooden pallets and boxes more efficient for shipping and storage.
  • Wooden packaging materials, such as hardwood, softwood, and plywood, are renewable and biodegradable, making them a preferred choice for ecommerce and food & beverage storage applications.

What are the market trends shaping the Wood Packaging Industry?

Growing innovation in wooden pallets is the upcoming market trend.

  • The market is characterized by a high degree of fragmentation, with companies continually introducing innovative products to maintain their competitive edge. One trend In the market is the production of smaller pallets for display-ready packaging in retail settings. These pallets, available in sizes such as half pallets (24 x 40 inches) and quarter pallets (24 x 20 inches), facilitate the safe transportation of goods from manufacturing units to retail stores. In addition, smarter pallets are being developed for use in automated supply chains, featuring uniform geometry and dimensions for easy handling by automated material handling equipment. As concerns about environmental impact grow, the use of ecofriendly packaging materials, including sustainably sourced hardwood and softwood, plywood, and other sustainable sourcing practices, is becoming increasingly important.
  • Wooden packaging solutions, such as crates, cases, boxes, drums, pallets, bins, spools, and dunnage, offer advantages in terms of durability, cost-effectiveness, and sustainability for various industries, including food and beverages, construction, consumer goods, industrial manufacturing, and logistics. However, environmental concerns, including deforestation and carbon emissions, remain significant challenges for the market. Circular economy initiatives, such as the reuse and recycling of wooden packaging, are being explored to mitigate these concerns and promote a more sustainable future for the industry.

What challenges does the Wood Packaging Industry face during its growth?

Fluctuating raw material prices is a key challenge affecting the industry growth.

  • Wood packaging, including pallets, crates, cases, drums, spools, and bins, is a significant market driven by various industries such as Food & Beverages Storage, Construction, Consumer Goods, Industrial, and Manufacturing. The primary materials used for manufacturing wood packaging products are softwood, hardwood, and plywood. Softwood, derived from gymnosperm trees like pines, accounts for approximately 84% of the market share. The price volatility of pine lumber, a major softwood component, can significantly impact the operating expenses of manufacturers. Consequently, fluctuations in raw material prices can affect profit margins. Low raw material prices may increase purchases for companies, but they can also lower the prices of final products (wooden pallets and boxes), potentially impacting profitability.
  • Additionally, environmental concerns, including deforestation and ecological impact, are driving the demand for sustainable packaging alternatives and ecofriendly practices. Circular economy initiatives, such as sustainable sourcing and reusing or recycling wood packaging, are also gaining traction. Transportation costs and carbon emissions are other factors influencing the market dynamics.

Exclusive Customer Landscape

The wood packaging market forecasting report includes the adoption lifecycle of the market, covering from the innovator's stage to the laggard's stage. It focuses on adoption rates in different regions based on penetration. Furthermore, the wood packaging market report also includes key purchase criteria and drivers of price sensitivity to help companies evaluate and develop their market growth analysis strategies.
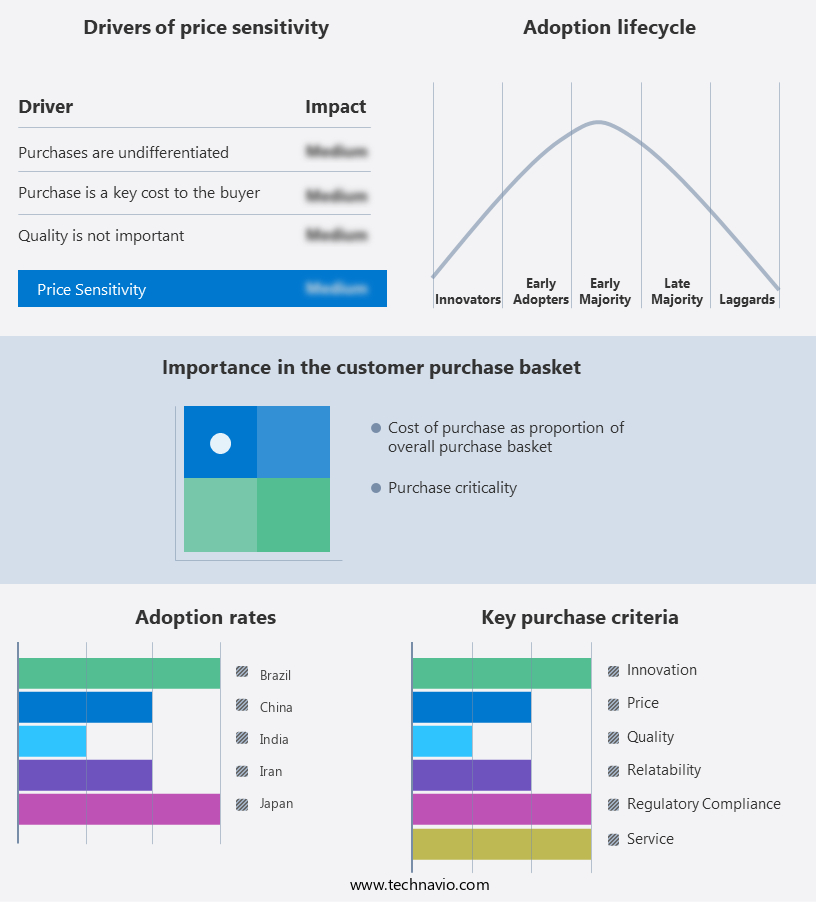
Wood Packaging Market Share by Geography

 Customer Landscape

Key Companies & Market Insights

Companies are implementing various strategies, such as strategic alliances, wood packaging market forecast, partnerships, mergers and acquisitions, geographical expansion, and product/service launches, to enhance their presence In the industry.

The industry research and growth report includes detailed analyses of the competitive landscape of the market and information about key companies, including:

  • Arrington Lumber and Pallet Co.
  • Brambles Ltd.
  • C and K Box Co. Inc.
  • Coxco Inc.
  • Falkenhahn AG
  • Greif Inc.
  • InterAgra SC
  • Kamps Inc.
  • Millwood Inc.
  • Mondi Plc
  • NEFAB GROUP
  • Ongna Wood Products
  • Pacific Pallet Ltd.
  • Palcon LLC
  • Rowlinson Group Ltd.
  • Shur-way Group Inc.
  • Stora Enso Oyj
  • Totre Industries
  • UFP Industries Inc.
  • United Pallet Services Inc.

Qualitative and quantitative analysis of companies has been conducted to help clients understand the wider business environment as well as the strengths and weaknesses of key industry players. Data is qualitatively analyzed to categorize companies as pure play, category-focused, industry-focused, and diversified; it is quantitatively analyzed to categorize companies as dominant, leading, strong, tentative, and weak.

Research Analyst Overview

The market encompasses a wide range of products, including wooden crates, pallets, boxes, bins, cases, spools, dunnage, and various types of drums. These packaging solutions cater to diverse industries such as ecommerce, export-oriented businesses, food and beverages storage, transportation, construction, consumer goods, industrial manufacturing, and logistics. Eco-friendliness and sustainability have emerged as significant trends In the packaging industry, with wooden packaging materials gaining popularity due to their natural origin and biodegradable nature. However, the ecological impact of wood packaging production and transportation is a growing concern. Deforestation, carbon emissions, and transportation costs are key issues that need to be addressed to ensure the sustainability of this market.

Sustainable sourcing and eco-friendly practices are essential for mitigating the environmental concerns associated with wooden packaging production. The use of certified wood and responsible forest management practices can help reduce the impact on forests and promote the circular economy. The transportation of wooden packaging contributes to significant carbon emissions, making it essential to explore alternative transportation methods and optimize logistics to minimize the carbon footprint. The adoption of electric or hybrid vehicles, rail transport, and intermodal transportation can help reduce the carbon emissions associated with wooden packaging transportation. The market comprises various types of woods, including hardwood and softwood, as well as plywood.

Hardwood is often preferred for its durability and strength, while softwood is known for its lightweight and cost-effective properties. The choice of wood type depends on the specific application and industry requirements. The demand for wooden packaging is driven by the need for protective packaging solutions for various industries. The food and beverage industry, for instance, relies heavily on wooden packaging for the transportation and storage of perishable goods. The construction industry also utilizes wooden packaging for the transportation and handling of building materials.

The growing focus on eco-friendliness and sustainability is driving the demand for sustainable sourcing, responsible forest management practices, and optimized logistics to minimize the environmental impact of wooden packaging production and transportation. The adoption of alternative transportation methods and the use of various types of woods, including hardwood and softwood, are key trends shaping the future of the market.

Market Scope

Report Coverage

Details

Page number

172

Base year

2023

Historic period

2018-2022

Forecast period

2024-2028

Growth momentum & CAGR

Accelerate at a CAGR of 4.6%

Market growth 2024-2028

USD 18.8 billion

Market structure

Fragmented

YoY growth 2023-2024(%)

4.16

Key countries

India, China, Japan, Iran, and Brazil

Competitive landscape

Leading Companies, Market Positioning of Companies, Competitive Strategies, and Industry Risks

Request Free Sample

What are the Key Data Covered in this Wood Packaging Market Research and Growth Report?

  • CAGR of the Wood Packaging industry during the forecast period
  • Detailed information on factors that will drive the growth and forecasting between 2024 and 2028
  • Precise estimation of the size of the market and its contribution of the industry in focus to the parent market
  • Accurate predictions about upcoming growth and trends and changes in consumer behaviour
  • Growth of the market across APAC, Middle East and Africa, South America, North America, and Europe
  • Thorough analysis of the market's competitive landscape and detailed information about companies
  • Comprehensive analysis of factors that will challenge the wood packaging market growth of industry companies

We can help! Our analysts can customize this wood packaging market research report to meet your requirements.

Get in touch

1 Executive Summary

  • 1.1 Market overview
    • Executive Summary - Chart on Market Overview
    • Executive Summary - Data Table on Market Overview
    • Executive Summary - Chart on Global Market Characteristics
    • Executive Summary - Chart on Market by Geography
    • Executive Summary - Chart on Market Segmentation by Product
    • Executive Summary - Chart on Market Segmentation by Application
    • Executive Summary - Chart on Incremental Growth
    • Executive Summary - Data Table on Incremental Growth
    • Executive Summary - Chart on Company Market Positioning

2 Market Landscape

  • 2.1 Market ecosystem
    • Parent Market
    • Data Table on - Parent Market
  • 2.2 Market characteristics
    • Market characteristics analysis
  • 2.3 Value chain analysis
    • Value Chain Analysis

3 Market Sizing

  • 3.1 Market definition
    • Offerings of companies included in the market definition
  • 3.2 Market segment analysis
    • Market segments
  • 3.3 Market size 2023
    • 3.4 Market outlook: Forecast for 2023-2028
      • Chart on Global - Market size and forecast 2023-2028 ($ billion)
      • Data Table on Global - Market size and forecast 2023-2028 ($ billion)
      • Chart on Global Market: Year-over-year growth 2023-2028 (%)
      • Data Table on Global Market: Year-over-year growth 2023-2028 (%)

    4 Historic Market Size

    • 4.1 Global Wood Packaging Market 2018 - 2022
      • Historic Market Size - Data Table on Global Wood Packaging Market 2018 - 2022 ($ billion)
    • 4.2 Product segment analysis 2018 - 2022
      • Historic Market Size - Product Segment 2018 - 2022 ($ billion)
    • 4.3 Application segment analysis 2018 - 2022
      • Historic Market Size - Application Segment 2018 - 2022 ($ billion)
    • 4.4 Geography segment analysis 2018 - 2022
      • Historic Market Size - Geography Segment 2018 - 2022 ($ billion)
    • 4.5 Country segment analysis 2018 - 2022
      • Historic Market Size - Country Segment 2018 - 2022 ($ billion)

    5 Five Forces Analysis

    • 5.1 Five forces summary
      • Five forces analysis - Comparison between 2023 and 2028
    • 5.2 Bargaining power of buyers
      • Bargaining power of buyers - Impact of key factors 2023 and 2028
    • 5.3 Bargaining power of suppliers
      • Bargaining power of suppliers - Impact of key factors in 2023 and 2028
    • 5.4 Threat of new entrants
      • Threat of new entrants - Impact of key factors in 2023 and 2028
    • 5.5 Threat of substitutes
      • Threat of substitutes - Impact of key factors in 2023 and 2028
    • 5.6 Threat of rivalry
      • Threat of rivalry - Impact of key factors in 2023 and 2028
    • 5.7 Market condition
      • Chart on Market condition - Five forces 2023 and 2028

    6 Market Segmentation by Product

    • 6.1 Market segments
      • Chart on Product - Market share 2023-2028 (%)
      • Data Table on Product - Market share 2023-2028 (%)
    • 6.2 Comparison by Product
      • Chart on Comparison by Product
      • Data Table on Comparison by Product
    • 6.3 Pallets - Market size and forecast 2023-2028
      • Chart on Pallets - Market size and forecast 2023-2028 ($ billion)
      • Data Table on Pallets - Market size and forecast 2023-2028 ($ billion)
      • Chart on Pallets - Year-over-year growth 2023-2028 (%)
      • Data Table on Pallets - Year-over-year growth 2023-2028 (%)
    • 6.4 Cases and boxes - Market size and forecast 2023-2028
      • Chart on Cases and boxes - Market size and forecast 2023-2028 ($ billion)
      • Data Table on Cases and boxes - Market size and forecast 2023-2028 ($ billion)
      • Chart on Cases and boxes - Year-over-year growth 2023-2028 (%)
      • Data Table on Cases and boxes - Year-over-year growth 2023-2028 (%)
    • 6.5 Market opportunity by Product
      • Market opportunity by Product ($ billion)
      • Data Table on Market opportunity by Product ($ billion)

    7 Market Segmentation by Application

    • 7.1 Market segments
      • Chart on Application - Market share 2023-2028 (%)
      • Data Table on Application - Market share 2023-2028 (%)
    • 7.2 Comparison by Application
      • Chart on Comparison by Application
      • Data Table on Comparison by Application
    • 7.3 Food and beverages storage - Market size and forecast 2023-2028
      • Chart on Food and beverages storage - Market size and forecast 2023-2028 ($ billion)
      • Data Table on Food and beverages storage - Market size and forecast 2023-2028 ($ billion)
      • Chart on Food and beverages storage - Year-over-year growth 2023-2028 (%)
      • Data Table on Food and beverages storage - Year-over-year growth 2023-2028 (%)
    • 7.4 Transportation - Market size and forecast 2023-2028
      • Chart on Transportation - Market size and forecast 2023-2028 ($ billion)
      • Data Table on Transportation - Market size and forecast 2023-2028 ($ billion)
      • Chart on Transportation - Year-over-year growth 2023-2028 (%)
      • Data Table on Transportation - Year-over-year growth 2023-2028 (%)
    • 7.5 Industrial - Market size and forecast 2023-2028
      • Chart on Industrial - Market size and forecast 2023-2028 ($ billion)
      • Data Table on Industrial - Market size and forecast 2023-2028 ($ billion)
      • Chart on Industrial - Year-over-year growth 2023-2028 (%)
      • Data Table on Industrial - Year-over-year growth 2023-2028 (%)
    • 7.6 Shipping - Market size and forecast 2023-2028
      • Chart on Shipping - Market size and forecast 2023-2028 ($ billion)
      • Data Table on Shipping - Market size and forecast 2023-2028 ($ billion)
      • Chart on Shipping - Year-over-year growth 2023-2028 (%)
      • Data Table on Shipping - Year-over-year growth 2023-2028 (%)
    • 7.7 Others - Market size and forecast 2023-2028
      • Chart on Others - Market size and forecast 2023-2028 ($ billion)
      • Data Table on Others - Market size and forecast 2023-2028 ($ billion)
      • Chart on Others - Year-over-year growth 2023-2028 (%)
      • Data Table on Others - Year-over-year growth 2023-2028 (%)
    • 7.8 Market opportunity by Application
      • Market opportunity by Application ($ billion)
      • Data Table on Market opportunity by Application ($ billion)

    8 Customer Landscape

    • 8.1 Customer landscape overview
      • Analysis of price sensitivity, lifecycle, customer purchase basket, adoption rates, and purchase criteria

    9 Geographic Landscape

    • 9.1 Geographic segmentation
      • Chart on Market share by geography 2023-2028 (%)
      • Data Table on Market share by geography 2023-2028 (%)
    • 9.2 Geographic comparison
      • Chart on Geographic comparison
      • Data Table on Geographic comparison
    • 9.3 APAC - Market size and forecast 2023-2028
      • Chart on APAC - Market size and forecast 2023-2028 ($ billion)
      • Data Table on APAC - Market size and forecast 2023-2028 ($ billion)
      • Chart on APAC - Year-over-year growth 2023-2028 (%)
      • Data Table on APAC - Year-over-year growth 2023-2028 (%)
    • 9.4 Middle East and Africa - Market size and forecast 2023-2028
      • Chart on Middle East and Africa - Market size and forecast 2023-2028 ($ billion)
      • Data Table on Middle East and Africa - Market size and forecast 2023-2028 ($ billion)
      • Chart on Middle East and Africa - Year-over-year growth 2023-2028 (%)
      • Data Table on Middle East and Africa - Year-over-year growth 2023-2028 (%)
    • 9.5 South America - Market size and forecast 2023-2028
      • Chart on South America - Market size and forecast 2023-2028 ($ billion)
      • Data Table on South America - Market size and forecast 2023-2028 ($ billion)
      • Chart on South America - Year-over-year growth 2023-2028 (%)
      • Data Table on South America - Year-over-year growth 2023-2028 (%)
    • 9.6 North America - Market size and forecast 2023-2028
      • Chart on North America - Market size and forecast 2023-2028 ($ billion)
      • Data Table on North America - Market size and forecast 2023-2028 ($ billion)
      • Chart on North America - Year-over-year growth 2023-2028 (%)
      • Data Table on North America - Year-over-year growth 2023-2028 (%)
    • 9.7 Europe - Market size and forecast 2023-2028
      • Chart on Europe - Market size and forecast 2023-2028 ($ billion)
      • Data Table on Europe - Market size and forecast 2023-2028 ($ billion)
      • Chart on Europe - Year-over-year growth 2023-2028 (%)
      • Data Table on Europe - Year-over-year growth 2023-2028 (%)
    • 9.8 India - Market size and forecast 2023-2028
      • Chart on India - Market size and forecast 2023-2028 ($ billion)
      • Data Table on India - Market size and forecast 2023-2028 ($ billion)
      • Chart on India - Year-over-year growth 2023-2028 (%)
      • Data Table on India - Year-over-year growth 2023-2028 (%)
    • 9.9 China - Market size and forecast 2023-2028
      • Chart on China - Market size and forecast 2023-2028 ($ billion)
      • Data Table on China - Market size and forecast 2023-2028 ($ billion)
      • Chart on China - Year-over-year growth 2023-2028 (%)
      • Data Table on China - Year-over-year growth 2023-2028 (%)
    • 9.10 Japan - Market size and forecast 2023-2028
      • Chart on Japan - Market size and forecast 2023-2028 ($ billion)
      • Data Table on Japan - Market size and forecast 2023-2028 ($ billion)
      • Chart on Japan - Year-over-year growth 2023-2028 (%)
      • Data Table on Japan - Year-over-year growth 2023-2028 (%)
    • 9.11 Iran - Market size and forecast 2023-2028
      • Chart on Iran - Market size and forecast 2023-2028 ($ billion)
      • Data Table on Iran - Market size and forecast 2023-2028 ($ billion)
      • Chart on Iran - Year-over-year growth 2023-2028 (%)
      • Data Table on Iran - Year-over-year growth 2023-2028 (%)
    • 9.12 Brazil - Market size and forecast 2023-2028
      • Chart on Brazil - Market size and forecast 2023-2028 ($ billion)
      • Data Table on Brazil - Market size and forecast 2023-2028 ($ billion)
      • Chart on Brazil - Year-over-year growth 2023-2028 (%)
      • Data Table on Brazil - Year-over-year growth 2023-2028 (%)
    • 9.13 Market opportunity by geography
      • Market opportunity by geography ($ billion)
      • Data Tables on Market opportunity by geography ($ billion)

    10 Drivers, Challenges, and Opportunity/Restraints

    • 10.1 Market drivers
      • 10.2 Market challenges
        • 10.3 Impact of drivers and challenges
          • Impact of drivers and challenges in 2023 and 2028
        • 10.4 Market opportunities/restraints

          11 Competitive Landscape

          • 11.1 Overview
            • 11.2 Competitive Landscape
              • Overview on criticality of inputs and factors of differentiation
            • 11.3 Landscape disruption
              • Overview on factors of disruption
            • 11.4 Industry risks
              • Impact of key risks on business

            12 Competitive Analysis

            • 12.1 Companies profiled
              • Companies covered
            • 12.2 Market positioning of companies
              • Matrix on companies position and classification
            • 12.3 Brambles Ltd.
              • Brambles Ltd. - Overview
              • Brambles Ltd. - Business segments
              • Brambles Ltd. - Key news
              • Brambles Ltd. - Key offerings
              • Brambles Ltd. - Segment focus
            • 12.4 C and K Box Co. Inc.
              • C and K Box Co. Inc. - Overview
              • C and K Box Co. Inc. - Product / Service
              • C and K Box Co. Inc. - Key offerings
            • 12.5 Coxco Inc.
              • Coxco Inc. - Overview
              • Coxco Inc. - Product / Service
              • Coxco Inc. - Key offerings
            • 12.6 Falkenhahn AG
              • Falkenhahn AG - Overview
              • Falkenhahn AG - Product / Service
              • Falkenhahn AG - Key offerings
            • 12.7 Greif Inc.
              • Greif Inc. - Overview
              • Greif Inc. - Business segments
              • Greif Inc. - Key news
              • Greif Inc. - Key offerings
              • Greif Inc. - Segment focus
            • 12.8 InterAgra SC
              • InterAgra SC - Overview
              • InterAgra SC - Product / Service
              • InterAgra SC - Key offerings
            • 12.9 Kamps Inc.
              • Kamps Inc. - Overview
              • Kamps Inc. - Product / Service
              • Kamps Inc. - Key offerings
            • 12.10 Millwood Inc.
              • Millwood Inc. - Overview
              • Millwood Inc. - Product / Service
              • Millwood Inc. - Key offerings
            • 12.11 Mondi Plc
              • Mondi Plc - Overview
              • Mondi Plc - Business segments
              • Mondi Plc - Key news
              • Mondi Plc - Key offerings
              • Mondi Plc - Segment focus
            • 12.12 NEFAB GROUP
              • NEFAB GROUP - Overview
              • NEFAB GROUP - Product / Service
              • NEFAB GROUP - Key offerings
            • 12.13 Pacific Pallet Ltd.
              • Pacific Pallet Ltd. - Overview
              • Pacific Pallet Ltd. - Product / Service
              • Pacific Pallet Ltd. - Key offerings
            • 12.14 Palcon LLC
              • Palcon LLC - Overview
              • Palcon LLC - Product / Service
              • Palcon LLC - Key offerings
            • 12.15 Rowlinson Group Ltd.
              • Rowlinson Group Ltd. - Overview
              • Rowlinson Group Ltd. - Product / Service
              • Rowlinson Group Ltd. - Key offerings
            • 12.16 Shur-way Group Inc.
              • Shur-way Group Inc. - Overview
              • Shur-way Group Inc. - Product / Service
              • Shur-way Group Inc. - Key offerings
            • 12.17 UFP Industries Inc.
              • UFP Industries Inc. - Overview
              • UFP Industries Inc. - Business segments
              • UFP Industries Inc. - Key offerings
              • UFP Industries Inc. - Segment focus

            13 Appendix

            • 13.1 Scope of the report
              • 13.2 Inclusions and exclusions checklist
                • Inclusions checklist
                • Exclusions checklist
              • 13.3 Currency conversion rates for US$
                • Currency conversion rates for US$
              • 13.4 Research methodology
                • Research methodology
              • 13.5 Data procurement
                • Information sources
              • 13.6 Data validation
                • Data validation
              • 13.7 Validation techniques employed for market sizing
                • Validation techniques employed for market sizing
              • 13.8 Data synthesis
                • Data synthesis
              • 13.9 360 degree market analysis
                • 360 degree market analysis
              • 13.10 List of abbreviations
                • List of abbreviations

              Research Methodology

              Technavio presents a detailed picture of the market by way of study, synthesis, and summation of data from multiple sources. The analysts have presented the various facets of the market with a particular focus on identifying the key industry influencers. The data thus presented is comprehensive, reliable, and the result of extensive research, both primary and secondary.

              INFORMATION SOURCES

              Primary sources

              • Manufacturers and suppliers
              • Channel partners
              • Industry experts
              • Strategic decision makers

              Secondary sources

              • Industry journals and periodicals
              • Government data
              • Financial reports of key industry players
              • Historical data
              • Press releases

              DATA ANALYSIS

              Data Synthesis

              • Collation of data
              • Estimation of key figures
              • Analysis of derived insights

              Data Validation

              • Triangulation with data models
              • Reference against proprietary databases
              • Corroboration with industry experts

              REPORT WRITING

              Qualitative

              • Market drivers
              • Market challenges
              • Market trends
              • Five forces analysis

              Quantitative

              • Market size and forecast
              • Market segmentation
              • Geographical insights
              • Competitive landscape

              Interested in this report?

              Get your sample now to see our research methodology and insights!

              Download Now

              Frequently Asked Questions

              Wood Packaging market growth will increase by $ 18.8 bn during 2024-2028 .

              The Wood Packaging market is expected to grow at a CAGR of 4.6% during 2024-2028 .

              Wood Packaging market is segmented by Product( Pallets, Cases and boxes, boxes) Application( Food and beverages storage, Transportation, Industrial, Shipping, Others)

              Arrington Lumber and Pallet Co., Brambles Ltd., C and K Box Co. Inc., Coxco Inc., Falkenhahn AG, Greif Inc., InterAgra SC, Kamps Inc., Millwood Inc., Mondi Plc, NEFAB GROUP, Ongna Wood Products, Pacific Pallet Ltd., Palcon LLC, Rowlinson Group Ltd., Shur-way Group Inc., Stora Enso Oyj, Totre Industries, UFP Industries Inc., United Pallet Services Inc. are a few of the key vendors in the Wood Packaging market.

              APAC will register the highest growth rate of 31% among the other regions. Therefore, the Wood Packaging market in APAC is expected to garner significant business opportunities for the vendors during the forecast period.

              India, China, Japan, Iran, Brazil

              • Cost benefits associated with wood packagingDistribution centers is the driving factor this market.
              • production units is the driving factor this market.
              • and manufacturing units are focusing on reducing the cost of shipment during the export and import of goods is the driving factor this market.
              • which also includes trade packaging costs is the driving factor this market.
              • sanitization charges is the driving factor this market.
              • floor spacing and utilization costs is the driving factor this market.
              • and labor charges during storage and transportation of goods. Wood packaging solutions such as pallets and wooden boxes for export and import offer a cost-effective option to end-users when compared with substitute products is the driving factor this market.
              • such as plastic pallets. For instance is the driving factor this market.
              • the average cost of wooden pallets is two times lower than plastic pallets. In addition is the driving factor this market.
              • wood packaging products are 100% recyclable when compared with plastic packaging products. The cost of floor spacing and space utilization constitutes a significant percentage of the shipment cost of goods. Proper utilization of the space during the storage and transit of goods can reduce the cost by around 54%. Wooden pallet manufacturers are introducing stackable pallets as they help reduce floor space. Wooden pallets are preferred for transporting food and beverage products. This is because the wood naturally absorbs bacteria is the driving factor this market.
              • which helps protect these products from cross-contamination. is the driving factor this market.

              The Wood Packaging market vendors should focus on grabbing business opportunities from the Pallets segment as it accounted for the largest market share in the base year.