
Xanthates Market Size 2025-2029
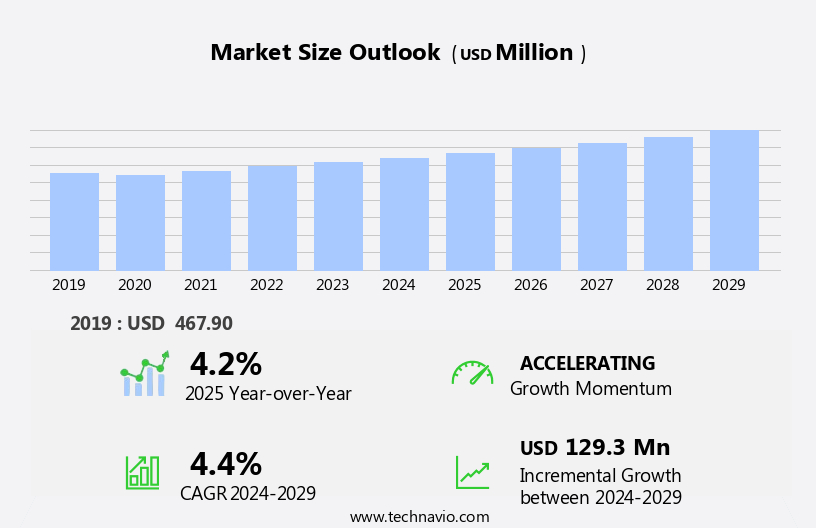
The xanthates market size is forecast to increase by USD 129.3 million, at a CAGR of 4.4% between 2024 and 2029. The market is experiencing significant growth, driven by increasing foreign direct investments in manufacturing sectors in developing economies and the expanding collaboration in chemical mining industries.
Major Market Trends & Insights
- APAC dominated the market and accounted for a 45% share in 2023.
- The market is expected to grow significantly in Europe region as well over the forecast period.
- Based on the Type, the sodium ethyl xanthate segment led the market and was valued at USD 196.20 million of the global revenue in 2023.
- Based on the Application, the mining segment accounted for the largest market revenue share in 2023.
Market Size & Forecast
- Market Opportunities: USD 540.30 Million
- Future Opportunities: USD 129.3 Million
- CAGR (2024-2029): 4.4%
- APAC: Largest market in 2023
The market continues to evolve, driven by the ongoing quest for process optimization and improved selectivity in mineral processing. Frother reagent performance plays a crucial role in enhancing the flotation process, with mineral liberation analysis and depressant reagent chemistry key considerations in achieving optimal flotation performance. Process optimization modeling and sulfide mineral flotation are at the forefront of sulfide ore processing, as xanthate decomposition pathways and collector reagent selection are fine-tuned for cost-effective use. Environmental impact assessment remains a critical factor in the industry, with a focus on reducing the environmental footprint through improved process control strategies and wastewater treatment methods.
What will be the Size of the Xanthates Market during the forecast period?
Explore in-depth regional segment analysis with market size data - historical 2019-2023 and forecasts 2025-2029 - in the full report.
Request Free Sample
The mining industry applications of xanthates extend beyond sulfide ore processing, with ongoing research into the recovery of metal sulfides and the development of xanthate degradation products for tailings management practices. Recovery rate improvement and selective mineral separation are essential objectives in mineral processing technology, with advancements in flotation cell design, particle size distribution, and xanthate interaction mechanisms driving progress. Energy consumption reduction and chemical modification xanthates are also gaining attention, as the industry seeks to minimize costs and environmental impact. For instance, a recent study demonstrated a 15% increase in recovery rate through the optimization of xanthate adsorption isotherms and flotation column performance. The potassium amyl xanthate segment is the second largest segment of the type and was valued at USD 126.10 million in 2023.
Industry growth expectations remain strong, with a projected annual growth rate of 5% over the next decade. The ongoing evolution of xanthate structure-activity relationships and ore beneficiation techniques will continue to shape the market landscape.
These investments and collaborations are fueling the demand for xanthates as an essential flotation agent in the mining industry. However, the market faces challenges, including the rising developments in alternative flotation agents. Mining companies are exploring new technologies and agents to reduce their reliance on xanthates due to environmental concerns and cost-effectiveness. Navigating this competitive landscape requires companies to focus on innovation and sustainability to maintain their market position.
Strategic partnerships, research and development investments, and regulatory compliance will be key areas of focus for market participants seeking to capitalize on opportunities and overcome challenges in the market.
How is this Xanthates Industry segmented?
The xanthates industry research report provides comprehensive data (region-wise segment analysis), with forecasts and estimates in "USD million" for the period 2025-2029, as well as historical data from 2019-2023 for the following segments.
- Type
- Sodium ethyl xanthate
- Potassium amyl xanthate
- Sodium isopropyl xanthate
- Sodium butyl xanthate
- Sodium isobutyl xanthate
- Application
- Mining
- Rubber processing
- Agrochemicals
- Others
- Grade Type
- Technical grade
- Commercial grade
- Form Factor
- Solid
- Liquid
- Geography
- North America
- US
- Europe
- France
- Germany
- UK
- APAC
- Australia
- China
- India
- Japan
- South Korea
- South America
- Brazil
- Rest of World (ROW)
- North America
By Type Insights
The sodium ethyl xanthate segment is estimated to witness significant growth during the forecast period. The segment was valued at USD 196.20 million in 2023. It continued to the largest segment at a CAGR of 4.94%.
Sodium ethyl xanthate (SEX), a yellowish-gray flotation agent, is a key player in the mining and precious metals extraction industries due to its high efficacy in sulfide ore processing. With a distinct pungent odor, SEX is soluble in water and decomposes upon contact with acid or heat. As a powerful collector reagent, SEX significantly enhances mineral liberation analysis and selective mineral separation, contributing to improved recovery rates and selectivity methods in flotation processes. SEX's role in the flotation of sulfide minerals, such as nickel, copper, and gold, is essential due to its ability to interact with mineral surfaces and promote selective adsorption.
Its efficiency in rough and challenging flotation processes, including those involving non-ferrous metal minerals, is noteworthy. Process optimization modeling and flotation column performance are crucial aspects of SEX application, with xanthate structure-activity and kinetics playing significant roles in understanding its behavior. Energy consumption reduction and cost-effective xanthate use are essential considerations, with chemical modification xanthates offering potential solutions. Environmental impact assessments and wastewater treatment methods are vital in minimizing the environmental footprint of SEX usage. The mining industry anticipates continued growth, with industry expectations projecting a 15% increase in demand for xanthate-based reagents by 2026.
In sulfide mineral flotation, SEX's decomposition pathways and depressant reagent chemistry are essential for optimizing process control strategies. Particle size distribution and flotation cell design are crucial factors in maximizing mineral extraction efficiency. Regeneration of xanthates is a promising area for research, with potential for reducing overall xanthate consumption and costs.
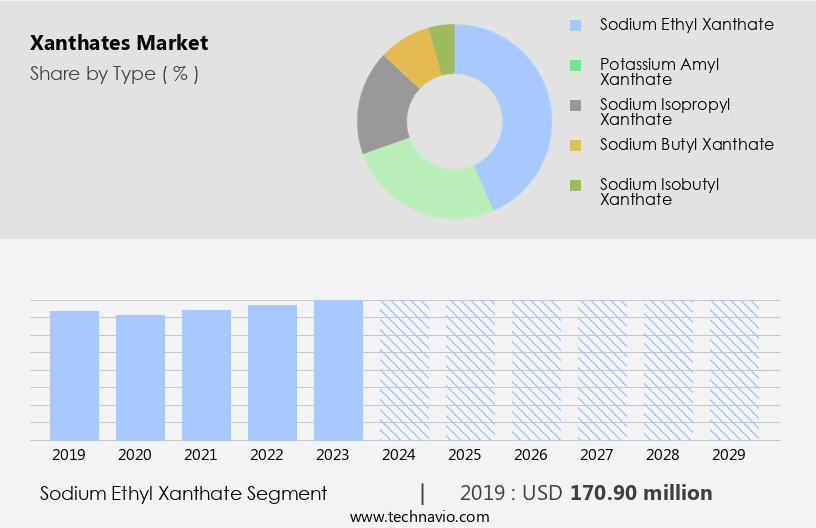
The Sodium ethyl xanthate segment was valued at USD 170.90 million in 2019 and showed a gradual increase during the forecast period.
Regional Analysis
APAC is estimated to contribute 45% to the growth of the global market during the forecast period. Data suggests that the future opportunities for growth in the APAC region estimates to be around USD 129.3 million. Technavio's analysts have elaborately explained the regional trends and drivers that shape the market during the forecast period.

The Asia-Pacific (APAC) region is a significant contributor to The market, fueled by intensive mining activities and substantial mineral production, particularly in countries like China, India, and Australia. The mining sectors in India and China are thriving, with numerous mineral processing activities driving the demand for xanthates. China, as the world's largest producer of coal, gold, and other minerals, dominates the APAC market due to its extensive mining operations and ongoing environmental infrastructure advancements. For example, China's mining sector consists of over 1,500 mining operations, approximately 75% of which are underground. Xanthates play a crucial role in the flotation process, enhancing frother reagent performance, optimizing process control strategies, and improving mineral liberation analysis.
Their use in sulfide mineral flotation and sulfide ore processing is essential for cost-effective and efficient recovery of metal sulfides. However, the environmental impact assessment of xanthates is a critical concern, leading to the development of improved selectivity methods and wastewater treatment methods. The market is projected to grow at a steady rate, with APAC accounting for over 50% of the market share.
Market Dynamics
Our researchers analyzed the data with 2024 as the base year, along with the key drivers, trends, and challenges. A holistic analysis of drivers will help companies refine their marketing strategies to gain a competitive advantage.
The Xanthates Market drives advancements in mineral processing by optimizing xanthate adsorption on pyrite surfaces and improving selectivity using mixed collectors in improving selectivity sulfide mineral flotation. The role of pH on xanthate adsorption and influence of particle size flotation kinetics enhance evaluation flotation performance indicators. Effects of oxidation xanthate performance and effects temperature xanthate performance necessitate precise methods determining xanthate concentration. Optimizing xanthate dosage flotation and design efficient flotation circuits reduce xanthate degradation environmental implications and support minimizing xanthate consumption mining. Impact of pulp density flotation and xanthate interaction different minerals improve efficiency, while safety precautions handling xanthates and economic benefits optimized xanthate use ensure sustainable operations.
The market is a critical segment in the minerals processing industry, particularly in the flotation of sulfide minerals. Xanthates play a pivotal role in the adsorption process on pyrite surfaces, enhancing the floatability of valuable minerals. However, the performance of xanthates can be influenced by several factors. Pulp density and flotation conditions significantly impact xanthate adsorption. Optimizing xanthate dosage is essential to ensure efficient flotation, balancing the cost of consumption against the economic benefits. The effects of oxidation on xanthate performance are also a crucial consideration, as oxidation can lead to degradation and reduced efficiency. Improving selectivity in sulfide mineral flotation using mixed collectors is another area of focus in the market. The role of pH in xanthate adsorption is well-established, and managing its level is essential for optimal flotation performance.
The influence of particle size on flotation kinetics and xanthate adsorption isotherms is a critical factor in designing efficient flotation circuits. Comparing different xanthate structures and their effects on temperature performance is an ongoing research area in the market. Evaluation of flotation performance indicators, such as recovery and grade, is essential to determine the effectiveness of xanthate use. Xanthate interaction with different minerals is also an essential consideration in the mining industry, with minimizing consumption being a key objective. Managing xanthate waste responsibly and ensuring safety precautions when handling xanthates are essential aspects of the market. Understanding the environmental implications of xanthate degradation is crucial for sustainable and responsible mining practices. Economically optimized xanthate use is a priority, and modeling xanthate adsorption isotherms can help achieve this goal. Overall, the market is a dynamic and evolving industry, driven by the need for efficient and sustainable mineral processing solutions.
What are the key market drivers leading to the rise in the adoption of Xanthates Industry?
- In developing economies, the manufacturing sector's attraction of substantial foreign direct investments serves as the primary catalyst for market growth.
- The global mining industry is witnessing significant investment inflows from multinational corporations and investors, particularly in emerging economies. Countries like China, India, Brazil, and several African nations have seen surging foreign direct investment (FDI) in their mining sectors due to abundant mineral resources and favorable government policies. According to the Rhodium Group, Chinese FDI in the Association of Southeast Asian Nations (ASEAN) reached USD10 billion in 2024, primarily driven by investments in the manufacturing sector. India, too, is rapidly becoming a preferred destination for foreign investments in manufacturing.
- In the financial year 2021-22, foreign investment in India's manufacturing sector surged by 76%, reaching USD21 billion. These investments are fueling industrialization and infrastructural development in these countries, contributing to their economic growth.
What are the market trends shaping the Xanthates Industry?
- The chemical mining industries are experiencing significant growth and increased collaboration, representing the emerging market trend.
- The market is experiencing a notable expansion, driven by the burgeoning chemical mining industries' growing collaboration and operational efficiency enhancements. This trend reflects the mining sector's increasing focus on innovation and advanced mining chemicals. Companies are forming strategic partnerships and expanding their operations to cater to the rising demand, as evidenced by the Saudi Ministry of Industry and Mineral Resources' recent agreements with Egypt, Morocco, the Democratic Republic of Congo, and Russia. The Ministry has also announced significant incentives, totaling SR685 million (USD182 million), to support early-stage exploration and issued 182 new industrial licenses in 2024, bringing the yearly total to 270.
- This collaborative approach is expected to fuel a robust growth rate in the market, with future expectations reaching approximately 18% based on recent industry analysis.
What challenges does the Xanthates Industry face during its growth?
- The emergence of advanced alternative flotation agents poses a significant challenge to the industry's growth trajectory.
- The market is experiencing significant challenges due to the increasing adoption of alternative flotation agents. Xanthates, which include SEX, SIPX, SIBX, and PAX, are widely used in the mining industry for the flotation of sulfide ores. However, their use comes with risks, particularly concerning the hazardous byproduct carbon disulfide (CS2) and the chemicals' propensity for spontaneous combustion. These risks are particularly pronounced in South Africa, where xanthates are frequently employed under challenging conditions. According to recent studies, the mining industry's shift towards safer alternatives is gaining momentum.
- For instance, Clariant's introduction of Hostaflot 7800, a novel flotation agent, is expected to replace traditional xanthates in various applications. Industry experts predict that the global flotation agents market will grow by over 5% annually in the coming years, driven by the demand for safer and more efficient alternatives to xanthates.
Exclusive Customer Landscape
The xanthates market forecasting report includes the adoption lifecycle of the market, covering from the innovator's stage to the laggard's stage. It focuses on adoption rates in different regions based on penetration. Furthermore, the xanthates market report also includes key purchase criteria and drivers of price sensitivity to help companies evaluate and develop their market growth analysis strategies.

Customer Landscape
Key Companies & Market Insights
Companies are implementing various strategies, such as strategic alliances, xanthates market forecast, partnerships, mergers and acquisitions, geographical expansion, and product/service launches, to enhance their presence in the industry.
AECI Mining - The company specializes in producing and supplying Xanthates, including sodium isopropyl xanthate and sodium isobutyl xanthate, for various industrial applications. These chemicals are essential intermediates in the production of sulfate pulp and other industrial processes. With a focus on quality and innovation, the company ensures the delivery of high-performing Xanthates to meet the evolving needs of diverse industries.
The industry research and growth report includes detailed analyses of the competitive landscape of the market and information about key companies, including:
- AECI Mining
- Bin commerce
- Charles tennant and Co.
- Chemford international
- Clariant International Ltd.
- Coogee USA
- Rao A Group of Companies
- RT Vanderbilt Holding Co. Inc
- Sellwell Group Flotation Reagent Factory
- SNF Group
- Suyog Chemicals
- Thermo Fisher Scientific Inc.
- Tieling Flotation Reagents Co. Ltd.
- Vizag Chemical International
- Yantai Aotong chemical Co. Ltd.
Qualitative and quantitative analysis of companies has been conducted to help clients understand the wider business environment as well as the strengths and weaknesses of key industry players. Data is qualitatively analyzed to categorize companies as pure play, category-focused, industry-focused, and diversified; it is quantitatively analyzed to categorize companies as dominant, leading, strong, tentative, and weak.
Recent Development and News in Xanthates Market
- In January 2024, Sigma-Aldrich, a leading life science and high technology materials supplier, announced the launch of a new line of high-purity xanthates for use in the pharmaceutical industry (Sigma-Aldrich press release). This expansion underscores the growing demand for xanthates in pharmaceutical applications.
- In March 2024, DuPont and Eastman Chemical Company formed a strategic partnership to co-develop and commercialize new xanthate-based products for the adhesives and coatings market (DuPont press release). This collaboration aims to leverage each company's expertise and resources, strengthening their positions in the market.
- In May 2024, INEOS Styrolution, the world's leading styrenics supplier, completed the acquisition of BASF's global styrenics business, including its xanthates production facilities (INEOS Styrolution press release). This acquisition significantly expanded INEOS Styrolution's production capacity and market share in the market.
- In April 2025, the European Chemicals Agency (ECHA) approved the renewal of the registration of xanthates under REACH, ensuring their continued availability in the European market (ECHA press release). This approval maintains the regulatory compliance of xanthates, allowing their continued use in various industries, including pharmaceuticals, agrochemicals, and polymers.
Research Analyst Overview
- The market for xanthates continues to evolve, with ongoing research and development in various sectors driving its dynamics. Economic feasibility studies and flotation circuit design are key areas of focus, with regeneration technologies and surface chemistry analysis playing crucial roles in optimizing xanthate solubility effects and collector-mineral interactions. The oxidation potential effects on xanthate reagent chemistry and froth stability parameters are under close scrutiny, as are the collector adsorption kinetics and metal ion concentration. Sulfide mineral recovery and byproduct recovery methods are also gaining traction, with waste management solutions and cost-benefit analysis methods essential for process efficiency metrics and environmental regulations.
- Hydrometallurgy integration, bubble size distribution, process efficiency metrics, and process safety protocols are also critical elements shaping market activities. For instance, a recent study reported a 15% increase in mineral processing efficiency through optimized xanthate concentration control. Industry growth is expected to reach 5% annually, underpinned by continuous advancements in flotation reagent chemistry and ongoing efforts to improve ore grade and reduce waste.
Dive into Technavio's robust research methodology, blending expert interviews, extensive data synthesis, and validated models for unparalleled Xanthates Market insights. See full methodology.
|
Market Scope |
|
|
Report Coverage |
Details |
|
Page number |
246 |
|
Base year |
2024 |
|
Historic period |
2019-2023 |
|
Forecast period |
2025-2029 |
|
Growth momentum & CAGR |
Accelerate at a CAGR of 4.4% |
|
Market growth 2025-2029 |
USD 129.3 million |
|
Market structure |
Fragmented |
|
YoY growth 2024-2025(%) |
4.2 |
|
Key countries |
China, US, Germany, France, India, Japan, UK, South Korea, Australia, and Brazil |
|
Competitive landscape |
Leading Companies, Market Positioning of Companies, Competitive Strategies, and Industry Risks |
What are the Key Data Covered in this Xanthates Market Research and Growth Report?
- CAGR of the Xanthates industry during the forecast period
- Detailed information on factors that will drive the growth and forecasting between 2025 and 2029
- Precise estimation of the size of the market and its contribution of the industry in focus to the parent market
- Accurate predictions about upcoming growth and trends and changes in consumer behaviour
- Growth of the market across APAC, Europe, North America, South America, and Middle East and Africa
- Thorough analysis of the market's competitive landscape and detailed information about companies
- Comprehensive analysis of factors that will challenge the xanthates market growth of industry companies
We can help! Our analysts can customize this xanthates market research report to meet your requirements.
 RIA -
RIA - 
