
Zero Trust Network Access Market Size 2025-2029
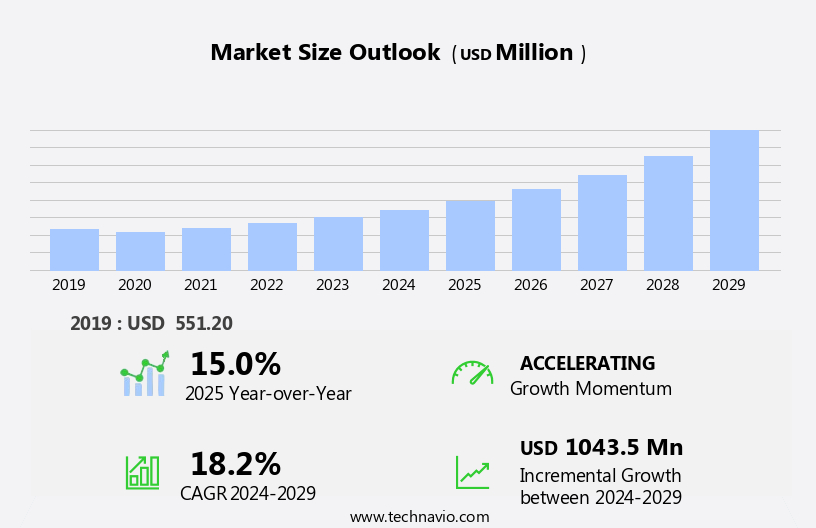
The zero trust network access market size is forecast to increase by USD 1.04 billion at a CAGR of 18.2% between 2024 and 2029.
- Zero Trust Network Access (ZTNA) is a security model gaining significant traction in the current digital landscape, particularly in the context of increasing cyber threats. The market is driven by several factors, including the growing frequency of targeted cyber-attacks and the high demand for improved visibility due to the rise in Internet of Things (IoT) traffic among enterprises. Another key factor fueling market growth is the implementation cost of zero trust security, which can be substantial but is seen as a necessary investment in the face of evolving security threats. Application security, a critical component of Zero Trust Network Access, is enhanced through the use of artificial intelligence (AI) and machine learning algorithms. These technologies enable real-time threat detection and response, ensuring that only authorized users and devices have access to sensitive data and applications. Endpoint security, another essential aspect of Zero Trust Network Access, is strengthened through multi-factor authentication and continuous monitoring. Edge computing, which allows data processing at the edge of the network, is also a trending technology in the market.
What will be the Size of the Market During the Forecast Period?
- The market is experiencing significant growth due to increasing cybersecurity threats and the widespread adoption of cloud technology, digital transformation, and IoT devices. Traditional perimeter security models are no longer sufficient in today's complex IT environments, leading organizations to adopt zero trust network access models. These models, which prioritize verification and authorization for every access request, offer enhanced security benefits, including insider threat protection, privileged access management, and defense in depth. Zero trust network access solutions are integral to IT security models, providing trust gates that ensure the integrity and confidentiality of data. SIEM systems play a crucial role in monitoring and analyzing network traffic, while mobile device usage adds an additional layer of complexity to security.
- Regulatory compliance requirements also drive demand for zero trust network access solutions. Market size is expected to grow steadily as more organizations adopt these solutions to mitigate risks associated with cyberattacks and protect sensitive data. Key trends in the market include the integration of it with other security technologies, such as SIEM and privileged access management, as well as the increasing use of artificial intelligence and machine learning to enhance threat detection and response capabilities.
How is this industry segmented and which is the largest segment?
The industry research report provides comprehensive data (region-wise segment analysis), with forecasts and estimates in "USD billion" for the period 2025-2029, as well as historical data from 2019-2023 for the following segments.
- Deployment
- On-premises
- Cloud
- Geography
- North America
- Canada
- US
- Europe
- Germany
- UK
- France
- Italy
- APAC
- China
- India
- Japan
- South America
- Middle East and Africa
- North America
By Deployment Insights
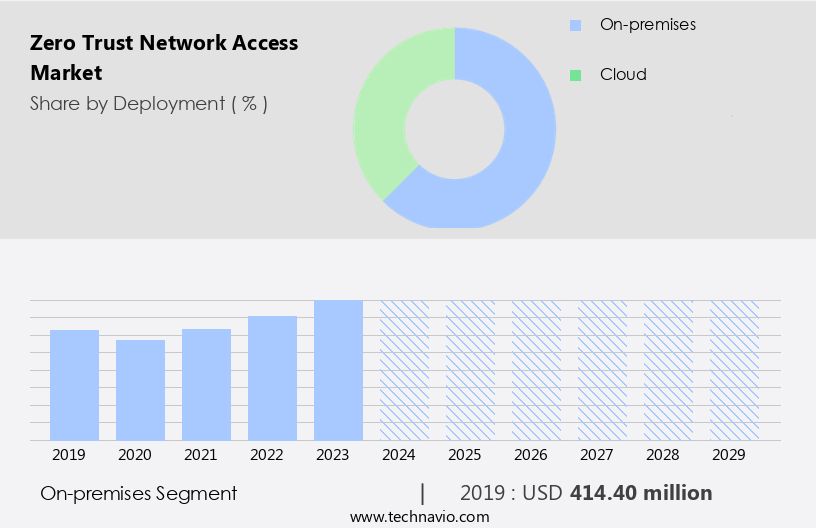
- The on-premises segment is estimated to witness significant growth during the forecast period. These solutions offer enterprises the flexibility to deploy on-premises or as a cloud service, catering to diverse business needs. On-premises deployment enables organizations to maintain control over advanced security solutions like next-generation firewalls and intrusion prevention systems. This model ensures full compliance with organizational mandates and allows for customization to meet specific business requirements. Confidential data remains in-house, providing greater control and visibility. However, with the increasing trend of cloud technology, digital transformation, and remote work, cloud-based ZTNA solutions are gaining popularity. Regardless of the deployment model, ZTNA enhances security by enforcing strict access control, reducing the risk of cyber threats such as insider threats, ransomware attacks, and data breaches.
Get a glance at the market report of share of various segments Request Free Sample
The on-premises segment was valued at USD 414.40 million in 2019 and showed a gradual increase during the forecast period.
Regional Analysis
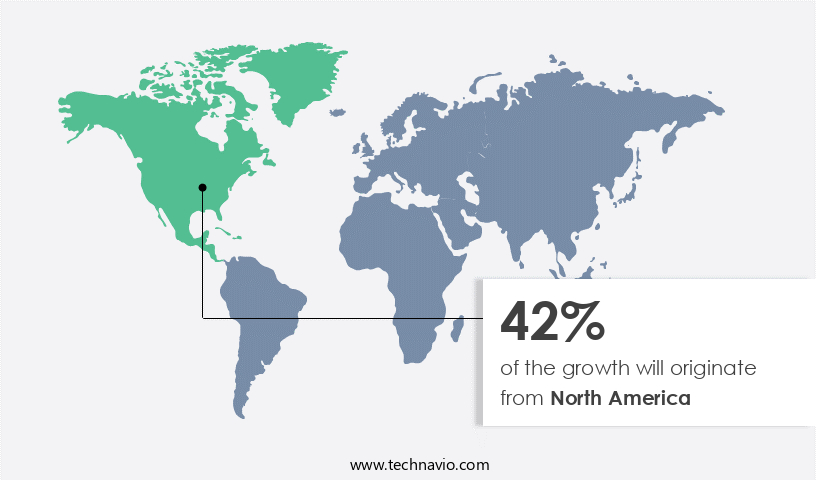
- North America is estimated to contribute 42% to the growth of the global market during the forecast period. Technavio's analysts have elaborately explained the regional trends and drivers that shape the market during the forecast period. The market in North America is driven by the presence of leading technology companies, including Akamai Technologies Inc., VMware Inc., Cisco Systems Inc., Fortinet Inc., International Business Machines Corp., Microsoft Corp., and Palo Alto Networks Inc. These firms provide tailored zero trust network access solutions to various industries, addressing the evolving security needs of organizations. The region's growth is further fueled by strategic investments, partnerships, and continuous research and development. These solutions have gained significance in today's digital transformation era, with increasing cloud adoption, remote work, and IoT device usage. Cyber threats, such as ransomware attacks and insider threats, have intensified the need for advanced security models like Zero Trust.
For more insights on the market size of various regions, Request Free Sample
The BFSI industry, banking services, operations, modernization, 5G, Smart devices, Artificial intelligence, Edge computing, and other sectors are adopting Zero Trust Network Access solutions for enhanced Integrity, Confidentiality, and Availability.
Market Dynamics
Our researchers analyzed the data with 2024 as the base year, along with the key drivers, trends, and challenges. A holistic analysis of drivers will help companies refine their marketing strategies to gain a competitive advantage.
What are the key market drivers leading to the rise in the adoption of Industry?
- Growing frequency of target-based cyber-attacks is the key driver of the market. In today's digital transformation era, IT infrastructures, encompassing on-premises devices, data centers, cloud-based platforms, and other IT systems, are increasingly susceptible to targeted cyber-attacks. These attacks, which include malware, ransomware, and phishing, are executed by intruders seeking to infiltrate targeted networks and steal critical and sensitive information. The consequences of such attacks can be devastating, leading to intellectual property loss, financial damage, and the exposure of confidential customer data. Traditional perimeter security models, which relied on a secure network boundary to protect against threats, are no longer sufficient. Instead, zero trust security, an IT security model that verifies every access request as though it originates from an open network, is gaining popularity.
- Zero trust security employs defense in depth, trust gates, and identity and endpoint security to ensure the integrity, confidentiality, and availability of networks, cloud applications, and data. Cloud technology, mobile device usage, IoT devices, and the increasing use of SIEM systems have made zero trust security a necessity for enterprises. Palo Alto Networks, Okta, Cyber threats, Insider threat protection, Privileged access management, and other industry leaders offer zero trust security solutions to help businesses mitigate cyber risks. Additionally, automation, cloud-based deployment, and advanced technologies like artificial intelligence and edge computing are enhancing zero trust security capabilities. Enterprises in various industries, including BFSI, are adopting zero trust security to safeguard their critical assets.
What are the market trends shaping the Industry?
- High demand for improved visibility due to rise in IoT traffic among enterprises is the upcoming market trend. Enterprises are increasingly integrating Internet of Things (IoT) devices into their operations for enhanced efficiency. IoT devices encompass network-connected gadgets and those utilizing protocols like radio frequency identification (RFID) and Bluetooth. The proliferation of IoT devices and subsequent traffic expansion have broadened the attack surface for cyber threats on enterprise IoT infrastructure. Many IoT devices are susceptible to compromise, serving as a potential gateway for attackers to infiltrate an enterprise's IT systems. These devices are often mass-produced and identical, enabling attackers to learn how to breach them using common default or weak passwords. The escalating cybersecurity risks associated with IoT devices necessitate the adoption of advanced security measures, such as Zero Trust Network Access.
- This security model, which includes Defense in Depth, Trust Gates, Identity security, Endpoint security, Network security, Data security, Application security, and Automation, ensures the protection of networks, cloud applications, and data from insider threats and external cyberattacks. Key components of Zero Trust Security include Insider threat protection, Privileged access management, and Ransomware prevention technology, among others. IoT devices, cloud technology, and digital transformation are driving the need for modernization in the IT industry, with 5G, smart devices, artificial intelligence, edge computing, and Akamai playing essential roles in this evolution.
What challenges does the Industry face during its growth?
- High implementation cost of zero trust security is a key challenge affecting the industry growth. Zero Trust Network Access (ZTNA) is a security model gaining traction in the IT industry due to increasing cyber threats. With digital transformation and cloud technology adoption, traditional perimeter security is no longer sufficient. ZTNA provides a more secure approach by verifying every access request as if it originates from an internal network. However, the high implementation cost is a significant barrier for many enterprises. This cost stems from the need to upgrade existing infrastructure, such as firewalls, VPNs, and access control systems, and integrate new technologies like multi-factor authentication, Identity and Access Management (IAM) tools, and secure web gateways.
- The complexity of managing this transition and hiring specialized expertise further adds to the expense. Despite these challenges, ZTNA offers enhanced security benefits, including insider threat protection, privileged access management, Defense in Depth, Trust Gates, and improved integrity, confidentiality, and availability for networks, cloud applications, and remote work. Key technologies in this space include Zero Trust isolation, SIEM systems, Palo Alto Networks, Okta, and others. IoT devices, mobile device usage, 5G, smart devices, artificial intelligence, edge computing, and cloud-based deployment are also driving the demand for ZTNA solutions. Companies in sectors like BFSI are particularly interested in zero trust security for banking services and operations modernization.
Exclusive Customer Landscape
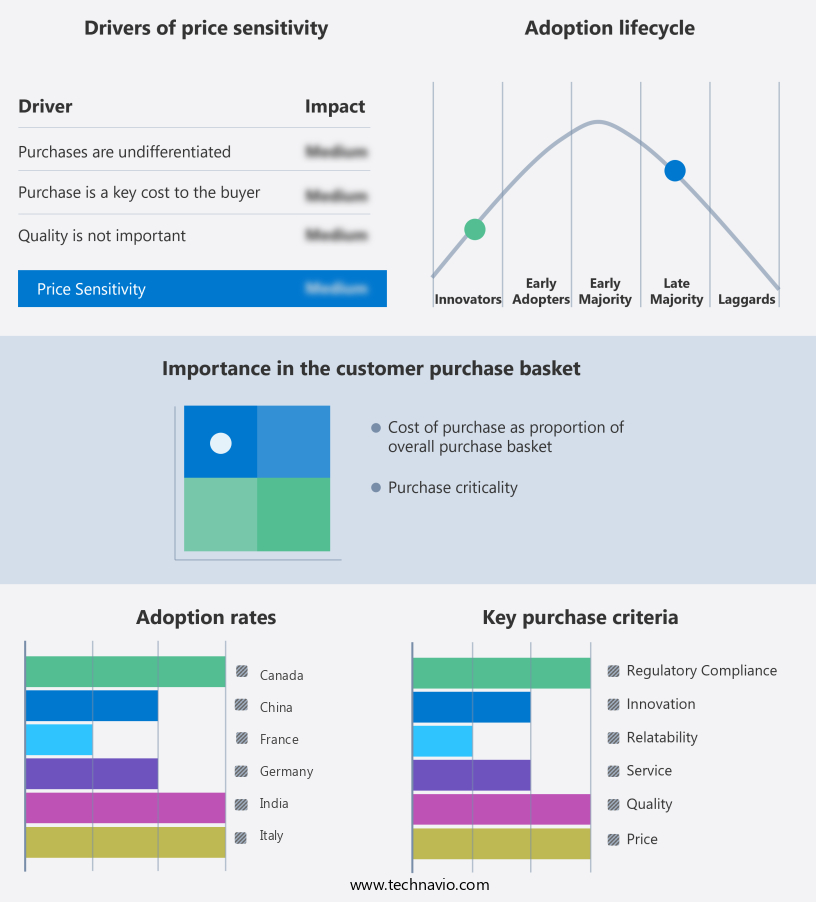
The market forecasting report includes the adoption lifecycle of the market, covering from the innovator's stage to the laggard's stage. It focuses on adoption rates in different regions based on penetration. Furthermore, the market report also includes key purchase criteria and drivers of price sensitivity to help companies evaluate and develop their market growth analysis strategies.
Customer Landscape
Key Companies & Market Insights
Companies are implementing various strategies, such as strategic alliances, market forecast, partnerships, mergers and acquisitions, geographical expansion, and product/service launches, to enhance their presence in the industry.
Akamai Technologies Inc. - The company offers zero trust network access solutions such as Akamai Guardicore Segmentation, Secure Internet Access Enterprise, and Enterprise Application Access.
The industry research and growth report includes detailed analyses of the competitive landscape of the market and information about key companies, including:
- Amazon.com Inc.
- Barracuda Networks Inc.
- Cisco Systems Inc.
- Citrix Systems Inc.
- Cloudflare Inc.
- Fortinet Inc.
- InstaSafe Technologies Pvt. Ltd.
- International Business Machines Corp.
- Ivanti Software Inc.
- JAMF Holding Corp.
- JumpCloud Inc.
- Microsoft Corp.
- Netskope Inc.
- Palo Alto Networks Inc.
- Progress Software Corp.
- SonicWall Inc.
- The Carlyle Group Inc.
- Unisys Corp.
- VMware Inc.
Qualitative and quantitative analysis of companies has been conducted to help clients understand the wider business environment as well as the strengths and weaknesses of key industry players. Data is qualitatively analyzed to categorize companies as pure play, category-focused, industry-focused, and diversified; it is quantitatively analyzed to categorize companies as dominant, leading, strong, tentative, and weak.
Research Analyst Overview
The market is experiencing significant growth as businesses increasingly prioritize securing their digital assets in the face of evolving cyber threats. With the proliferation of cloud technology and the ongoing digital transformation, traditional perimeter security models are no longer sufficient. Instead, organizations are adopting a zero trust security approach, which verifies the identity and trustworthiness of every user, device, and application attempting to access networks and cloud applications. Zero trust security is particularly relevant in today's environment where remote work and mobile device usage are commonplace. The increasing adoption of Internet of Things (IoT) devices and the integration of artificial intelligence and edge computing further complicate network security.
As a result, zero trust security models have become essential for enterprises seeking to maintain the integrity, confidentiality, and availability of their data. Regulatory compliance also plays a significant role in driving the adoption of zero trust network access. As businesses operate in increasingly complex regulatory landscapes, they must ensure that their IT security models provide strong protection against insider threats and privileged access management. Defense in depth strategies, which include trust gates and zero trust isolation, are becoming the norm for enterprises looking to implement a multi-layered security approach. The market is characterized by a high degree of competition, with numerous players offering various solutions.
Moreover, some focus on identity security, while others prioritize endpoint security, network security, or application security. Automation and cloud-based deployment are also key features of many offerings in the market. The BFSI industry, which deals with banking services and operations, is a significant market. With the modernization of banking services and the increasing use of 5G and smart devices, the need for strong security measures has become paramount. Zero trust security solutions offer several benefits, including ransomware prevention technology and protection against insider threats. These solutions enable enterprises to implement a zero trust approach, ensuring that only authorized users, devices, and applications have access to sensitive data.
|
Market Scope |
|
|
Report Coverage |
Details |
|
Page number |
177 |
|
Base year |
2024 |
|
Historic period |
2019-2023 |
|
Forecast period |
2025-2029 |
|
Growth momentum & CAGR |
Accelerate at a CAGR of 18.2% |
|
Market growth 2025-2029 |
USD 1.04 billion |
|
Market structure |
Fragmented |
|
YoY growth 2024-2025(%) |
15.0 |
|
Key countries |
US, Canada, Germany, UK, Japan, Italy, France, The Netherlands, China, and India |
|
Competitive landscape |
Leading Companies, market growth and forecasting, Market Positioning of Companies, Competitive Strategies, and Industry Risks |
What are the Key Data Covered in this Market Research and Growth Report?
- CAGR of the Zero Trust Network Access industry during the forecast period
- Detailed information on factors that will drive the growth and forecasting between 2025 and 2029
- Precise estimation of the size of the market and its contribution of the industry in focus to the parent market
- Accurate predictions about upcoming growth and trends and changes in consumer behaviour
- Growth of the market across North America, Europe, APAC, South America, and Middle East and Africa
- Thorough analysis of the market's competitive landscape and detailed information about companies
- Comprehensive analysis of factors that will challenge the market growth of industry companies
We can help! Our analysts can customize this market research report to meet your requirements.
 RIA -
RIA - 
