Forklift Trucks Market Analysis, Size, and Forecast 2026-2030: APAC (China, Japan, and India), Europe (Germany, UK, and France), North America (US, Canada, and Mexico), Middle East and Africa (Saudi Arabia, UAE, and South Africa), South America (Brazil and Argentina), and Rest of World (ROW)

Forklift Trucks Market Analysis, Size, and Forecast 2026-2030:
APAC (China, Japan, and India), Europe (Germany, UK, and France), North America (US, Canada, and Mexico), Middle East and Africa (Saudi Arabia, UAE, and South Africa), South America (Brazil and Argentina), and Rest of World (ROW)

Published: Mar 2026 304 Pages SKU: IRTNTR40505

Market Overview at a Glance

$29.24 B
Market Opportunity
7.8%
CAGR 2025 - 2030
53.8%
APAC Growth
$23.75 B
Class III segment 2024

Forklift Trucks Market Size 2026-2030

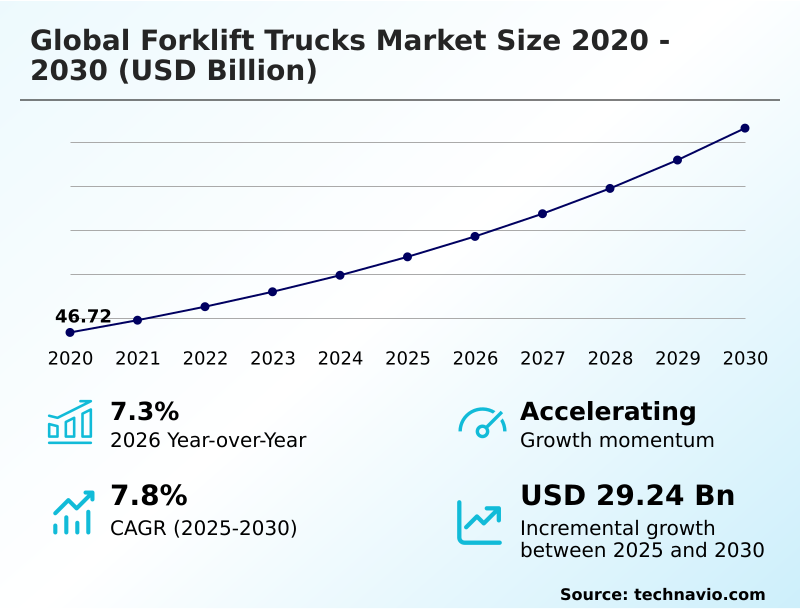
The forklift trucks market size is valued to increase by USD 29.24 billion, at a CAGR of 7.8% from 2025 to 2030. Rapid growth in construction sector will drive the forklift trucks market.

Major Market Trends & Insights

  • APAC dominated the market and accounted for a 53.8% growth during the forecast period.
  • By Class Type - Class III segment was valued at USD 23.75 billion in 2024
  • By Type - Electric segment accounted for the largest market revenue share in 2024

Market Size & Forecast

  • Market Opportunities: USD 46.42 billion
  • Market Future Opportunities: USD 29.24 billion
  • CAGR from 2025 to 2030 : 7.8%

Market Summary

  • The forklift trucks market is characterized by a significant transformation driven by the dual pressures of e-commerce expansion and industrial modernization. The exponential growth in online retail necessitates the development of high-throughput warehouses, escalating demand for electric motor rider trucks and very narrow aisle trucks that maximize spatial efficiency.
  • Concurrently, a persistent shortage of skilled operators is accelerating the adoption of warehouse automation, with companies leveraging automated guided vehicles and autonomous mobile robots to maintain productivity and enhance workplace safety.
  • For instance, a large third-party logistics provider can deploy a fleet of automated forklifts for repetitive pallet-moving tasks, reallocating its human workforce to complex order-picking assignments, thereby improving overall operational efficiency. However, the high initial investment for advanced lithium-ion batteries and hydrogen fuel cell technology, coupled with stringent emission regulations for internal combustion engines, creates significant financial and compliance challenges.
  • Balancing innovation with cost-effectiveness remains a central strategic focus for enterprises navigating this dynamic landscape.

What will be the Size of the Forklift Trucks Market during the forecast period?

Get Key Insights on Market Forecast (PDF) Request Free Sample

How is the Forklift Trucks Market Segmented?

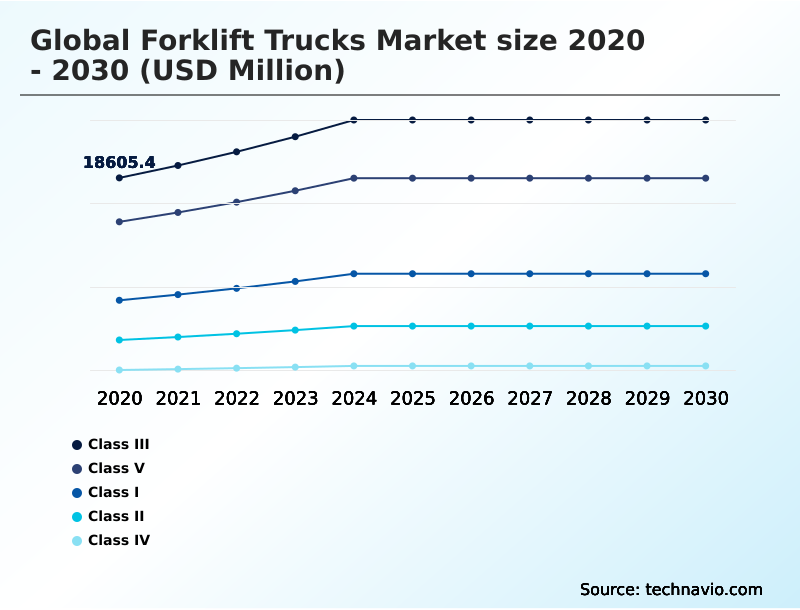
The forklift trucks industry research report provides comprehensive data (region-wise segment analysis), with forecasts and estimates in "USD million" for the period 2026-2030, as well as historical data from 2020-2024 for the following segments.

  • Class type
    • Class III
    • Class V
    • Class I
    • Class II
    • Class IV
  • Type
    • Electric
    • Internal combustion engine
  • End-user
    • Industrial
    • Manufacturing
    • Construction
  • Geography
    • APAC
      • China
      • Japan
      • India
    • Europe
      • Germany
      • UK
      • France
    • North America
      • US
      • Canada
      • Mexico
    • Middle East and Africa
      • Saudi Arabia
      • UAE
      • South Africa
    • South America
      • Brazil
      • Argentina
    • Rest of World (ROW)

By Class Type Insights

The class iii segment is estimated to witness significant growth during the forecast period.

The Class III segment, comprising electric motor hand trucks, serves as a cornerstone for modern material handling equipment.

These zero-emission vehicles like pallet jacks are engineered for horizontal transport in warehouses and retail, excelling in last-mile delivery hubs and supporting lean manufacturing.

Their compact design and ergonomic control handles are crucial for navigating tight spaces common in urban fulfillment centers driven by e-commerce retail. Adoption of advanced batteries enables multi-shift operations through rapid opportunity charging, enhancing operational efficiency.

This is vital in environments like cold storage facilities, where uptime is critical. Integrating these machines with telematics for predictive maintenance has demonstrated the ability to improve picking accuracy by over 15%, reducing errors and boosting throughput.

Request Free Sample

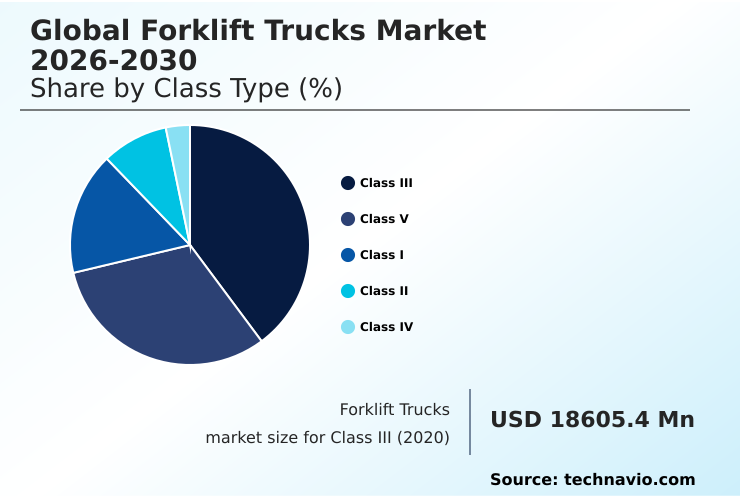
The Class III segment was valued at USD 23.75 billion in 2024 and showed a gradual increase during the forecast period.

Request Free Sample

Regional Analysis

APAC is estimated to contribute 53.8% to the growth of the global market during the forecast period.Technavio’s analysts have elaborately explained the regional trends and drivers that shape the market during the forecast period.

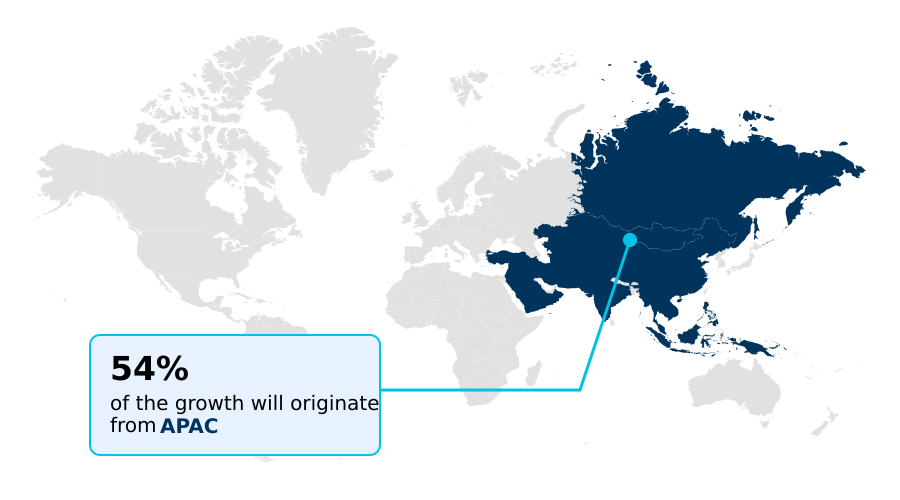
See How Forklift Trucks Market Demand is Rising in APAC Request Free Sample

The geographic landscape is dominated by the APAC region, which accounts for over 53% of the market's incremental growth opportunity.

This is driven by massive industrialization, the Belt and Road Initiative, and the effects of the goods and services tax in key countries, which modernizes supply chains. The region's projected growth rate of 8.5% significantly outpaces Europe's 6.9%.

Demand spans from high-capacity container handlers and straddle carriers at major ports to specialized industrial vehicle types like sideloader forklifts and articulated forklifts in manufacturing. The trend towards nearshoring manufacturing further boosts the need for efficient equipment.

European markets, in contrast, focus more on green procurement strategies and the circular economy, with a high adoption of electric motor rider trucks and walkie straddle stacker models.

Market Dynamics

Our researchers analyzed the data with 2025 as the base year, along with the key drivers, trends, and challenges. A holistic analysis of drivers will help companies refine their marketing strategies to gain a competitive advantage.

  • Strategic decisions in fleet modernization revolve around key technological comparisons, such as hydrogen fuel cell vs lithium-ion forklifts, and understanding the impact of emission standards on forklift design. The ROI of automated forklift implementation is a critical boardroom topic, as the use of automated guided vehicles in warehouse logistics promises significant long-term gains despite high initial costs.
  • An electric forklift maintenance cost comparison often reveals lower lifetime expenses, influencing the shift away from internal combustion models. For specific environments, selecting the right equipment is paramount, whether it is a rough terrain forklift for construction sites or a narrow aisle forklift for high-density storage.
  • Advanced telematics for forklift fleet management can improve utilization by over 20% compared to fleets without such systems. This data-driven approach allows for forklift fleet optimization using data analytics and enables predictive maintenance for forklift hydraulic systems, further reducing total cost of ownership for forklifts.
  • Operator-centric considerations, including ergonomics in forklift operator cabin design and advanced operator safety features in modern forklifts, are also crucial. Technology choices extend to components, with analysis of the benefits of pneumatic vs cushion tires and the latest forklift tyre technology for durability being key to performance in varied applications.
  • Furthermore, integrating forklifts with warehouse management systems and understanding lithium-ion battery charging infrastructure requirements are essential for seamless operations, especially in cold storage forklift technology advancements and e-commerce fulfillment centers.

What are the key market drivers leading to the rise in the adoption of Forklift Trucks Industry?

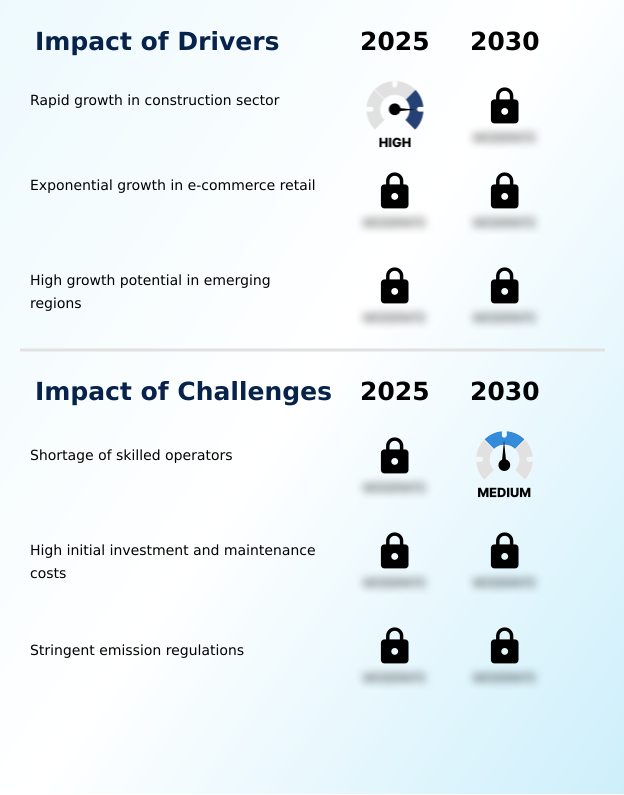
  • Rapid growth in the global construction sector is a primary driver for the forklift trucks market, escalating the need for efficient material handling on job sites.

  • The expansion of e-commerce retail is a primary market driver, fueling demand for modern logistics and warehousing infrastructure.
  • This has led to a 15% year-over-year increase in demand for equipment suited for high-density storage systems, such as order pickers and pallet jacks. Third-party logistics providers are investing heavily to support rapid just-in-time delivery models.
  • In parallel, the construction sector drives demand for heavy-duty applications, where rough terrain forklifts and telehandlers equipped with durable pneumatic tires are essential.
  • Advanced fleet management systems are being deployed in these environments to monitor assets, improving energy efficiency and reducing fuel consumption by as much as 10%, a critical factor for profitability on large-scale projects.

What are the market trends shaping the Forklift Trucks Industry?

  • The advent of hydrogen fuel cell-powered forklift trucks is an emerging market trend, presenting cleaner and more efficient power solutions compared to traditional alternatives.

  • The market is advancing toward the fourth industrial revolution, driven by trends in warehouse automation and carbon neutral operations. Hydrogen fuel cell technology is a key innovation, allowing zero-emission vehicles to refuel in under three minutes, a vast improvement over the 6-8 hours for some battery types. This supports intense, multi-shift intralogistics.
  • Simultaneously, the adoption of automated guided vehicles and autonomous mobile robots, integrated with warehouse management software, is redefining supply chain management. These systems, including very narrow aisle trucks with advanced operator presence detection, improve order fulfilment speed and can increase overall operational efficiency by up to 25% in high-volume distribution centers.

What challenges does the Forklift Trucks Industry face during its growth?

  • A persistent shortage of skilled operators represents a key challenge for the forklift trucks market, constraining operational capacity and hindering industry growth.

  • High initial investments and stringent emission regulations pose significant market challenges. The upfront cost for a forklift with lithium-ion batteries can be up to three times that of traditional internal combustion engines, impacting asset management strategies for many firms.
  • Furthermore, compliance with standards like Stage V, which mandates particulate matter emissions below 0.015 g/kWh, requires complex exhaust aftertreatment systems, increasing the total cost of ownership. While AC motor technology improves performance, the industry also faces hurdles related to workplace safety.
  • Adopting advanced driver assistance systems, load weight sensors, and operator training simulators is crucial but adds expense, balancing the need for better indoor air quality against budgetary constraints.

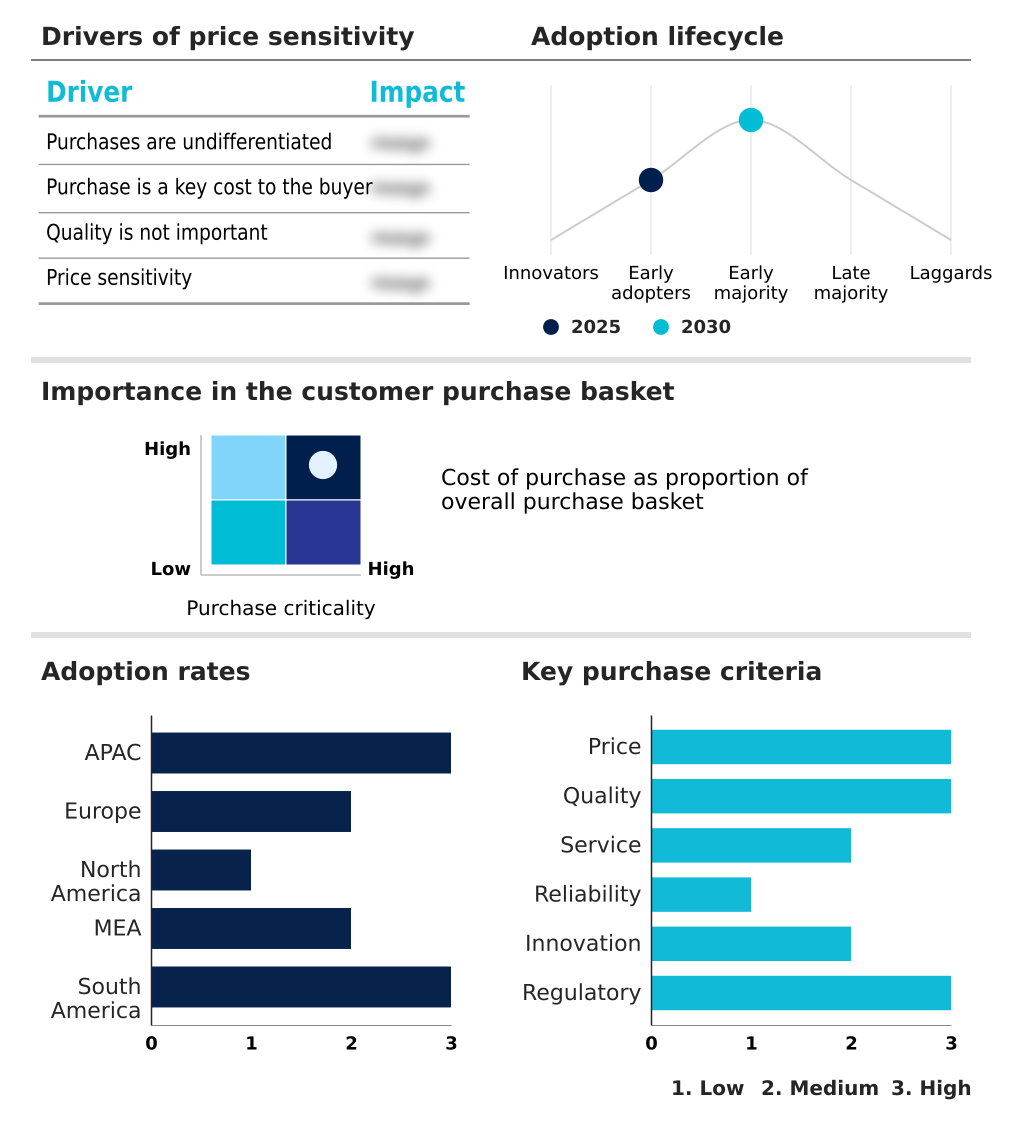
Exclusive Technavio Analysis on Customer Landscape

The forklift trucks market forecasting report includes the adoption lifecycle of the market, covering from the innovator’s stage to the laggard’s stage. It focuses on adoption rates in different regions based on penetration. Furthermore, the forklift trucks market report also includes key purchase criteria and drivers of price sensitivity to help companies evaluate and develop their market growth analysis strategies.

Customer Landscape of Forklift Trucks Industry

Competitive Landscape

Companies are implementing various strategies, such as strategic alliances, forklift trucks market forecast, partnerships, mergers and acquisitions, geographical expansion, and product/service launches, to enhance their presence in the industry.

Baumann Group SRL - Material handling solutions include electric and internal combustion forklifts engineered for high productivity and operational efficiency in demanding warehouse and industrial applications.

The industry research and growth report includes detailed analyses of the competitive landscape of the market and information about key companies, including:

  • Baumann Group SRL
  • BYD Co. Ltd.
  • Clark Material Handling Co.
  • Combilift Ltd.
  • Crown Equipment Corp.
  • Doosan Bobcat Inc.
  • Godrej Enterprises Group
  • Hangcha Group Co. Ltd.
  • Hubtex Maschinenbau GmbH
  • Hyster Yale Materials Handling Inc.
  • Hyundai Motor Co.
  • Jungheinrich Group
  • Kalmar Corp.
  • KION GROUP AG
  • Lonking Holdings Ltd.
  • Manitou BF SA
  • Merlo Spa
  • Mitsubishi Corp.
  • Noblelift Equipment Co. Ltd.
  • Toyota Industries Corp.

Qualitative and quantitative analysis of companies has been conducted to help clients understand the wider business environment as well as the strengths and weaknesses of key industry players. Data is qualitatively analyzed to categorize companies as pure play, category-focused, industry-focused, and diversified; it is quantitatively analyzed to categorize companies as dominant, leading, strong, tentative, and weak.

Recent Development and News in Forklift trucks market

  • In May, 2025, The Raymond Corporation debuted three new lithium-ion powered Class III pallet stacker models, the 6310 Walkie Straddle Stacker, the 6410 Walkie Reach Stacker, and the 6510 Walkie Counterbalanced Stacker, designed to boost efficiency and flexibility in warehouse operations.
  • In April, 2025, Toyota Material Handling Europe and Plug Power announced a strategic collaboration with STEF to deploy advanced hydrogen-powered forklift trucks and fuel cell solutions at two cold storage distribution centers in France and Spain.
  • In March, 2025, PALFINGER premiered its new FLM series middle-seat truck-mounted forklift at the bauma 2025 trade show, a prototype designed to enhance operator visibility, comfort, and ergonomics for transport and logistics applications.
  • In January, 2025, Clark expanded its S-Series electric forklift range with new three-wheel and four-wheel models, designed to replace older combustion engine derivatives in the 48-volt segment with load capacities from 1.6 to 2 tonnes.

Dive into Technavio’s robust research methodology, blending expert interviews, extensive data synthesis, and validated models for unparalleled Forklift Trucks Market insights. See full methodology.

Market Scope
Page number 304
Base year 2025
Historic period 2020-2024
Forecast period 2026-2030
Growth momentum & CAGR Accelerate at a CAGR of 7.8%
Market growth 2026-2030 USD 29244.3 million
Market structure Fragmented
YoY growth 2025-2026(%) 7.3%
Key countries China, Japan, India, South Korea, Australia, Indonesia, Germany, UK, France, Italy, Spain, The Netherlands, US, Canada, Mexico, Saudi Arabia, UAE, South Africa, Turkey, Qatar, Brazil, Argentina and Chile
Competitive landscape Leading Companies, Market Positioning of Companies, Competitive Strategies, and Industry Risks

Request Free Sample

Research Analyst Overview

  • The forklift trucks market is undergoing a fundamental shift toward intelligent and sustainable operations, driven by technological advancements across its core components. The integration of hydrogen fuel cell technology and advanced lithium-ion batteries into zero-emission vehicles is redefining fleet capabilities, moving beyond traditional internal combustion engines.
  • Innovations such as autonomous mobile robots, automated guided vehicles, and warehouse automation systems are becoming standard. These technologies, combined with robust warehouse management software and fleet management systems, enable unprecedented efficiency. For example, the deployment of advanced driver assistance systems and load weight sensors can reduce material damage incidents by over 15%.
  • The market offers a diverse range of equipment, from rough terrain forklifts and telehandlers to specialized very narrow aisle trucks, order pickers, and pallet jacks. Key components like pneumatic tires, cushion tires, and non-marking tyres are evolving, while regenerative braking systems and AC motor technology enhance performance in electric motor rider trucks.
  • The focus is on creating a connected, safe, and productive ecosystem.

What are the Key Data Covered in this Forklift Trucks Market Research and Growth Report?

  • What is the expected growth of the Forklift Trucks Market between 2026 and 2030?

    • USD 29.24 billion, at a CAGR of 7.8%

  • What segmentation does the market report cover?

    • The report is segmented by Class Type (Class III, Class V, Class I, Class II, and Class IV), Type (Electric, and Internal combustion engine), End-user (Industrial, Manufacturing, and Construction) and Geography (APAC, Europe, North America, Middle East and Africa, South America)

  • Which regions are analyzed in the report?

    • APAC, Europe, North America, Middle East and Africa and South America

  • What are the key growth drivers and market challenges?

    • Rapid growth in construction sector, Shortage of skilled operators

  • Who are the major players in the Forklift Trucks Market?

    • Baumann Group SRL, BYD Co. Ltd., Clark Material Handling Co., Combilift Ltd., Crown Equipment Corp., Doosan Bobcat Inc., Godrej Enterprises Group, Hangcha Group Co. Ltd., Hubtex Maschinenbau GmbH, Hyster Yale Materials Handling Inc., Hyundai Motor Co., Jungheinrich Group, Kalmar Corp., KION GROUP AG, Lonking Holdings Ltd., Manitou BF SA, Merlo Spa, Mitsubishi Corp., Noblelift Equipment Co. Ltd. and Toyota Industries Corp.

Market Research Insights

  • The market's dynamics are shaped by a strong focus on enhancing operational efficiency and achieving sustainability goals. The adoption of electric industrial vehicle fleets has been shown to reduce energy costs by up to 40% compared to legacy internal combustion models, a compelling incentive for green procurement strategies.
  • In logistics and warehousing, the integration of advanced material handling equipment with warehouse management software can improve order fulfilment accuracy by over 25%. This push for technological integration is a response to the demands of e-commerce retail and the need for greater precision in supply chain management.
  • As firms pursue carbon neutral operations, the shift toward technologies that improve energy efficiency is becoming a standard for maintaining a competitive edge in third-party logistics and manufacturing.

We can help! Our analysts can customize this forklift trucks market research report to meet your requirements.

Get in touch

1. Executive Summary

1.1 Market overview

Executive Summary - Chart on Market Overview
Executive Summary - Data Table on Market Overview
Executive Summary - Chart on Global Market Characteristics
Executive Summary - Chart on Market by Geography
Executive Summary - Chart on Market Segmentation by Class Type
Executive Summary - Chart on Market Segmentation by Type
Executive Summary - Chart on Market Segmentation by End-user
Executive Summary - Chart on Incremental Growth
Executive Summary - Data Table on Incremental Growth
Executive Summary - Chart on Company Market Positioning

2. Technavio Analysis

2.1 Analysis of price sensitivity, lifecycle, customer purchase basket, adoption rates, and purchase criteria

2.2 Criticality of inputs and Factors of differentiation

Chart on Overview on criticality of inputs and factors of differentiation

2.3 Factors of disruption

Chart on Overview on factors of disruption

2.4 Impact of drivers and challenges

Chart on Impact of drivers and challenges in 2025 and 2030

3. Market Landscape

3.1 Market ecosystem

Chart on Parent Market
Data Table on - Parent Market

3.2 Market characteristics

Chart on Market characteristics analysis

3.3 Value chain analysis

Chart on Value chain analysis

4. Market Sizing

4.1 Market definition

Data Table on Offerings of companies included in the market definition

4.2 Market segment analysis

Market segments

4.3 Market size 2025

4.4 Market outlook: Forecast for 2025-2030

Chart on Global - Market size and forecast 2025-2030 ($ million)
Data Table on Global - Market size and forecast 2025-2030 ($ million)
Chart on Global Market: Year-over-year growth 2025-2030 (%)
Data Table on Global Market: Year-over-year growth 2025-2030 (%)

5. Historic Market Size

5.1 Global Forklift Trucks Market 2020 - 2024

Historic Market Size - Data Table on Global Forklift Trucks Market 2020 - 2024 ($ million)

5.2 Class Type segment analysis 2020 - 2024

Historic Market Size - Class Type Segment 2020 - 2024 ($ million)

5.3 Type segment analysis 2020 - 2024

Historic Market Size - Type Segment 2020 - 2024 ($ million)

5.4 End-user segment analysis 2020 - 2024

Historic Market Size - End-user Segment 2020 - 2024 ($ million)

5.5 Geography segment analysis 2020 - 2024

Historic Market Size - Geography Segment 2020 - 2024 ($ million)

5.6 Country segment analysis 2020 - 2024

Historic Market Size - Country Segment 2020 - 2024 ($ million)

6. Qualitative Analysis

6.1 AI Impact on the Global Forklift Trucks Market

7. Five Forces Analysis

7.1 Five forces summary

Five forces analysis - Comparison between 2025 and 2030

7.2 Bargaining power of buyers

Bargaining power of buyers - Impact of key factors 2025 and 2030

7.3 Bargaining power of suppliers

Bargaining power of suppliers - Impact of key factors in 2025 and 2030

7.4 Threat of new entrants

Threat of new entrants - Impact of key factors in 2025 and 2030

7.5 Threat of substitutes

Threat of substitutes - Impact of key factors in 2025 and 2030

7.6 Threat of rivalry

Threat of rivalry - Impact of key factors in 2025 and 2030

7.7 Market condition

Chart on Market condition - Five forces 2025 and 2030

8. Market Segmentation by Class Type

8.1 Market segments

Chart on Class Type - Market share 2025-2030 (%)
Data Table on Class Type - Market share 2025-2030 (%)

8.2 Comparison by Class Type

Chart on Comparison by Class Type
Data Table on Comparison by Class Type

8.3 Class III - Market size and forecast 2025-2030

Chart on Class III - Market size and forecast 2025-2030 ($ million)
Data Table on Class III - Market size and forecast 2025-2030 ($ million)
Chart on Class III - Year-over-year growth 2025-2030 (%)
Data Table on Class III - Year-over-year growth 2025-2030 (%)

8.4 Class V - Market size and forecast 2025-2030

Chart on Class V - Market size and forecast 2025-2030 ($ million)
Data Table on Class V - Market size and forecast 2025-2030 ($ million)
Chart on Class V - Year-over-year growth 2025-2030 (%)
Data Table on Class V - Year-over-year growth 2025-2030 (%)

8.5 Class I - Market size and forecast 2025-2030

Chart on Class I - Market size and forecast 2025-2030 ($ million)
Data Table on Class I - Market size and forecast 2025-2030 ($ million)
Chart on Class I - Year-over-year growth 2025-2030 (%)
Data Table on Class I - Year-over-year growth 2025-2030 (%)

8.6 Class II - Market size and forecast 2025-2030

Chart on Class II - Market size and forecast 2025-2030 ($ million)
Data Table on Class II - Market size and forecast 2025-2030 ($ million)
Chart on Class II - Year-over-year growth 2025-2030 (%)
Data Table on Class II - Year-over-year growth 2025-2030 (%)

8.7 Class IV - Market size and forecast 2025-2030

Chart on Class IV - Market size and forecast 2025-2030 ($ million)
Data Table on Class IV - Market size and forecast 2025-2030 ($ million)
Chart on Class IV - Year-over-year growth 2025-2030 (%)
Data Table on Class IV - Year-over-year growth 2025-2030 (%)

8.8 Market opportunity by Class Type

Market opportunity by Class Type ($ million)
Data Table on Market opportunity by Class Type ($ million)

9. Market Segmentation by Type

9.1 Market segments

Chart on Type - Market share 2025-2030 (%)
Data Table on Type - Market share 2025-2030 (%)

9.2 Comparison by Type

Chart on Comparison by Type
Data Table on Comparison by Type

9.3 Electric - Market size and forecast 2025-2030

Chart on Electric - Market size and forecast 2025-2030 ($ million)
Data Table on Electric - Market size and forecast 2025-2030 ($ million)
Chart on Electric - Year-over-year growth 2025-2030 (%)
Data Table on Electric - Year-over-year growth 2025-2030 (%)

9.4 Internal combustion engine - Market size and forecast 2025-2030

Chart on Internal combustion engine - Market size and forecast 2025-2030 ($ million)
Data Table on Internal combustion engine - Market size and forecast 2025-2030 ($ million)
Chart on Internal combustion engine - Year-over-year growth 2025-2030 (%)
Data Table on Internal combustion engine - Year-over-year growth 2025-2030 (%)

9.5 Market opportunity by Type

Market opportunity by Type ($ million)
Data Table on Market opportunity by Type ($ million)

10. Market Segmentation by End-user

10.1 Market segments

Chart on End-user - Market share 2025-2030 (%)
Data Table on End-user - Market share 2025-2030 (%)

10.2 Comparison by End-user

Chart on Comparison by End-user
Data Table on Comparison by End-user

10.3 Industrial - Market size and forecast 2025-2030

Chart on Industrial - Market size and forecast 2025-2030 ($ million)
Data Table on Industrial - Market size and forecast 2025-2030 ($ million)
Chart on Industrial - Year-over-year growth 2025-2030 (%)
Data Table on Industrial - Year-over-year growth 2025-2030 (%)

10.4 Manufacturing - Market size and forecast 2025-2030

Chart on Manufacturing - Market size and forecast 2025-2030 ($ million)
Data Table on Manufacturing - Market size and forecast 2025-2030 ($ million)
Chart on Manufacturing - Year-over-year growth 2025-2030 (%)
Data Table on Manufacturing - Year-over-year growth 2025-2030 (%)

10.5 Construction - Market size and forecast 2025-2030

Chart on Construction - Market size and forecast 2025-2030 ($ million)
Data Table on Construction - Market size and forecast 2025-2030 ($ million)
Chart on Construction - Year-over-year growth 2025-2030 (%)
Data Table on Construction - Year-over-year growth 2025-2030 (%)

10.6 Market opportunity by End-user

Market opportunity by End-user ($ million)
Data Table on Market opportunity by End-user ($ million)

11. Customer Landscape

11.1 Customer landscape overview

Analysis of price sensitivity, lifecycle, customer purchase basket, adoption rates, and purchase criteria

12. Geographic Landscape

12.1 Geographic segmentation

Chart on Market share by geography 2025-2030 (%)
Data Table on Market share by geography 2025-2030 (%)

12.2 Geographic comparison

Chart on Geographic comparison
Data Table on Geographic comparison

12.3 APAC - Market size and forecast 2025-2030

Chart on APAC - Market size and forecast 2025-2030 ($ million)
Data Table on APAC - Market size and forecast 2025-2030 ($ million)
Chart on APAC - Year-over-year growth 2025-2030 (%)
Data Table on APAC - Year-over-year growth 2025-2030 (%)
Chart on Regional Comparison - APAC
Data Table on Regional Comparison - APAC

12.3.1 China - Market size and forecast 2025-2030

Chart on China - Market size and forecast 2025-2030 ($ million)
Data Table on China - Market size and forecast 2025-2030 ($ million)
Chart on China - Year-over-year growth 2025-2030 (%)
Data Table on China - Year-over-year growth 2025-2030 (%)

12.3.2 Japan - Market size and forecast 2025-2030

Chart on Japan - Market size and forecast 2025-2030 ($ million)
Data Table on Japan - Market size and forecast 2025-2030 ($ million)
Chart on Japan - Year-over-year growth 2025-2030 (%)
Data Table on Japan - Year-over-year growth 2025-2030 (%)

12.3.3 India - Market size and forecast 2025-2030

Chart on India - Market size and forecast 2025-2030 ($ million)
Data Table on India - Market size and forecast 2025-2030 ($ million)
Chart on India - Year-over-year growth 2025-2030 (%)
Data Table on India - Year-over-year growth 2025-2030 (%)

12.3.4 South Korea - Market size and forecast 2025-2030

Chart on South Korea - Market size and forecast 2025-2030 ($ million)
Data Table on South Korea - Market size and forecast 2025-2030 ($ million)
Chart on South Korea - Year-over-year growth 2025-2030 (%)
Data Table on South Korea - Year-over-year growth 2025-2030 (%)

12.3.5 Australia - Market size and forecast 2025-2030

Chart on Australia - Market size and forecast 2025-2030 ($ million)
Data Table on Australia - Market size and forecast 2025-2030 ($ million)
Chart on Australia - Year-over-year growth 2025-2030 (%)
Data Table on Australia - Year-over-year growth 2025-2030 (%)

12.3.6 Indonesia - Market size and forecast 2025-2030

Chart on Indonesia - Market size and forecast 2025-2030 ($ million)
Data Table on Indonesia - Market size and forecast 2025-2030 ($ million)
Chart on Indonesia - Year-over-year growth 2025-2030 (%)
Data Table on Indonesia - Year-over-year growth 2025-2030 (%)

12.4 Europe - Market size and forecast 2025-2030

Chart on Europe - Market size and forecast 2025-2030 ($ million)
Data Table on Europe - Market size and forecast 2025-2030 ($ million)
Chart on Europe - Year-over-year growth 2025-2030 (%)
Data Table on Europe - Year-over-year growth 2025-2030 (%)
Chart on Regional Comparison - Europe
Data Table on Regional Comparison - Europe

12.4.1 Germany - Market size and forecast 2025-2030

Chart on Germany - Market size and forecast 2025-2030 ($ million)
Data Table on Germany - Market size and forecast 2025-2030 ($ million)
Chart on Germany - Year-over-year growth 2025-2030 (%)
Data Table on Germany - Year-over-year growth 2025-2030 (%)

12.4.2 UK - Market size and forecast 2025-2030

Chart on UK - Market size and forecast 2025-2030 ($ million)
Data Table on UK - Market size and forecast 2025-2030 ($ million)
Chart on UK - Year-over-year growth 2025-2030 (%)
Data Table on UK - Year-over-year growth 2025-2030 (%)

12.4.3 France - Market size and forecast 2025-2030

Chart on France - Market size and forecast 2025-2030 ($ million)
Data Table on France - Market size and forecast 2025-2030 ($ million)
Chart on France - Year-over-year growth 2025-2030 (%)
Data Table on France - Year-over-year growth 2025-2030 (%)

12.4.4 Italy - Market size and forecast 2025-2030

Chart on Italy - Market size and forecast 2025-2030 ($ million)
Data Table on Italy - Market size and forecast 2025-2030 ($ million)
Chart on Italy - Year-over-year growth 2025-2030 (%)
Data Table on Italy - Year-over-year growth 2025-2030 (%)

12.4.5 Spain - Market size and forecast 2025-2030

Chart on Spain - Market size and forecast 2025-2030 ($ million)
Data Table on Spain - Market size and forecast 2025-2030 ($ million)
Chart on Spain - Year-over-year growth 2025-2030 (%)
Data Table on Spain - Year-over-year growth 2025-2030 (%)

12.4.6 The Netherlands - Market size and forecast 2025-2030

Chart on The Netherlands - Market size and forecast 2025-2030 ($ million)
Data Table on The Netherlands - Market size and forecast 2025-2030 ($ million)
Chart on The Netherlands - Year-over-year growth 2025-2030 (%)
Data Table on The Netherlands - Year-over-year growth 2025-2030 (%)

12.5 North America - Market size and forecast 2025-2030

Chart on North America - Market size and forecast 2025-2030 ($ million)
Data Table on North America - Market size and forecast 2025-2030 ($ million)
Chart on North America - Year-over-year growth 2025-2030 (%)
Data Table on North America - Year-over-year growth 2025-2030 (%)
Chart on Regional Comparison - North America
Data Table on Regional Comparison - North America

12.5.1 US - Market size and forecast 2025-2030

Chart on US - Market size and forecast 2025-2030 ($ million)
Data Table on US - Market size and forecast 2025-2030 ($ million)
Chart on US - Year-over-year growth 2025-2030 (%)
Data Table on US - Year-over-year growth 2025-2030 (%)

12.5.2 Canada - Market size and forecast 2025-2030

Chart on Canada - Market size and forecast 2025-2030 ($ million)
Data Table on Canada - Market size and forecast 2025-2030 ($ million)
Chart on Canada - Year-over-year growth 2025-2030 (%)
Data Table on Canada - Year-over-year growth 2025-2030 (%)

12.5.3 Mexico - Market size and forecast 2025-2030

Chart on Mexico - Market size and forecast 2025-2030 ($ million)
Data Table on Mexico - Market size and forecast 2025-2030 ($ million)
Chart on Mexico - Year-over-year growth 2025-2030 (%)
Data Table on Mexico - Year-over-year growth 2025-2030 (%)

12.6 Middle East and Africa - Market size and forecast 2025-2030

Chart on Middle East and Africa - Market size and forecast 2025-2030 ($ million)
Data Table on Middle East and Africa - Market size and forecast 2025-2030 ($ million)
Chart on Middle East and Africa - Year-over-year growth 2025-2030 (%)
Data Table on Middle East and Africa - Year-over-year growth 2025-2030 (%)
Chart on Regional Comparison - Middle East and Africa
Data Table on Regional Comparison - Middle East and Africa

12.6.1 Saudi Arabia - Market size and forecast 2025-2030

Chart on Saudi Arabia - Market size and forecast 2025-2030 ($ million)
Data Table on Saudi Arabia - Market size and forecast 2025-2030 ($ million)
Chart on Saudi Arabia - Year-over-year growth 2025-2030 (%)
Data Table on Saudi Arabia - Year-over-year growth 2025-2030 (%)

12.6.2 UAE - Market size and forecast 2025-2030

Chart on UAE - Market size and forecast 2025-2030 ($ million)
Data Table on UAE - Market size and forecast 2025-2030 ($ million)
Chart on UAE - Year-over-year growth 2025-2030 (%)
Data Table on UAE - Year-over-year growth 2025-2030 (%)

12.6.3 South Africa - Market size and forecast 2025-2030

Chart on South Africa - Market size and forecast 2025-2030 ($ million)
Data Table on South Africa - Market size and forecast 2025-2030 ($ million)
Chart on South Africa - Year-over-year growth 2025-2030 (%)
Data Table on South Africa - Year-over-year growth 2025-2030 (%)

12.6.4 Turkey - Market size and forecast 2025-2030

Chart on Turkey - Market size and forecast 2025-2030 ($ million)
Data Table on Turkey - Market size and forecast 2025-2030 ($ million)
Chart on Turkey - Year-over-year growth 2025-2030 (%)
Data Table on Turkey - Year-over-year growth 2025-2030 (%)

12.6.5 Qatar - Market size and forecast 2025-2030

Chart on Qatar - Market size and forecast 2025-2030 ($ million)
Data Table on Qatar - Market size and forecast 2025-2030 ($ million)
Chart on Qatar - Year-over-year growth 2025-2030 (%)
Data Table on Qatar - Year-over-year growth 2025-2030 (%)

12.7 South America - Market size and forecast 2025-2030

Chart on South America - Market size and forecast 2025-2030 ($ million)
Data Table on South America - Market size and forecast 2025-2030 ($ million)
Chart on South America - Year-over-year growth 2025-2030 (%)
Data Table on South America - Year-over-year growth 2025-2030 (%)
Chart on Regional Comparison - South America
Data Table on Regional Comparison - South America

12.7.1 Brazil - Market size and forecast 2025-2030

Chart on Brazil - Market size and forecast 2025-2030 ($ million)
Data Table on Brazil - Market size and forecast 2025-2030 ($ million)
Chart on Brazil - Year-over-year growth 2025-2030 (%)
Data Table on Brazil - Year-over-year growth 2025-2030 (%)

12.7.2 Argentina - Market size and forecast 2025-2030

Chart on Argentina - Market size and forecast 2025-2030 ($ million)
Data Table on Argentina - Market size and forecast 2025-2030 ($ million)
Chart on Argentina - Year-over-year growth 2025-2030 (%)
Data Table on Argentina - Year-over-year growth 2025-2030 (%)

12.7.3 Chile - Market size and forecast 2025-2030

Chart on Chile - Market size and forecast 2025-2030 ($ million)
Data Table on Chile - Market size and forecast 2025-2030 ($ million)
Chart on Chile - Year-over-year growth 2025-2030 (%)
Data Table on Chile - Year-over-year growth 2025-2030 (%)

12.8 Market opportunity by geography

Market opportunity by geography ($ million)
Data Tables on Market opportunity by geography ($ million)

13. Drivers, Challenges, and Opportunity

13.1 Market drivers

Rapid growth in construction sector
Exponential growth in e-commerce retail
High growth potential in emerging regions

13.2 Market challenges

Shortage of skilled operators
High initial investment and maintenance costs
Stringent emission regulations

13.3 Impact of drivers and challenges

Impact of drivers and challenges in 2025 and 2030

13.4 Market opportunities

Advent of hydrogen fuel cell-powered forklift trucks
Growing popularity of automation
Rising prominence of tyre technology

14. Competitive Landscape

14.1 Overview

14.2

Overview on criticality of inputs and factors of differentiation

14.3 Landscape disruption

Overview on factors of disruption

14.4 Industry risks

Impact of key risks on business

15. Competitive Analysis

15.1 Companies profiled

Companies covered

15.2 Company ranking index

15.3 Market positioning of companies

Matrix on companies position and classification

15.4 BYD Co. Ltd.

BYD Co. Ltd. - Overview
BYD Co. Ltd. - Business segments
BYD Co. Ltd. - Key news
BYD Co. Ltd. - Key offerings
BYD Co. Ltd. - Segment focus
SWOT

15.5 Clark Material Handling Co.

Clark Material Handling Co. - Overview
Clark Material Handling Co. - Product / Service
Clark Material Handling Co. - Key offerings
SWOT

15.6 Combilift Ltd.

Combilift Ltd. - Overview
Combilift Ltd. - Product / Service
Combilift Ltd. - Key offerings
SWOT

15.7 Crown Equipment Corp.

Crown Equipment Corp. - Overview
Crown Equipment Corp. - Product / Service
Crown Equipment Corp. - Key offerings
SWOT

15.8 Doosan Bobcat Inc.

Doosan Bobcat Inc. - Overview
Doosan Bobcat Inc. - Product / Service
Doosan Bobcat Inc. - Key offerings
SWOT

15.9 Hangcha Group Co. Ltd.

Hangcha Group Co. Ltd. - Overview
Hangcha Group Co. Ltd. - Product / Service
Hangcha Group Co. Ltd. - Key offerings
SWOT

15.10 Hyster Yale Materials Handling Inc.

Hyster Yale Materials Handling Inc. - Overview
Hyster Yale Materials Handling Inc. - Business segments
Hyster Yale Materials Handling Inc. - Key offerings
Hyster Yale Materials Handling Inc. - Segment focus
SWOT

15.11 Hyundai Motor Co.

Hyundai Motor Co. - Overview
Hyundai Motor Co. - Business segments
Hyundai Motor Co. - Key news
Hyundai Motor Co. - Key offerings
Hyundai Motor Co. - Segment focus
SWOT

15.12 Jungheinrich Group

Jungheinrich Group - Overview
Jungheinrich Group - Business segments
Jungheinrich Group - Key news
Jungheinrich Group - Key offerings
Jungheinrich Group - Segment focus
SWOT

15.13 Kalmar Corp.

Kalmar Corp. - Overview
Kalmar Corp. - Product / Service
Kalmar Corp. - Key offerings
SWOT

15.14 KION GROUP AG

KION GROUP AG - Overview
KION GROUP AG - Business segments
KION GROUP AG - Key offerings
KION GROUP AG - Segment focus
SWOT

15.15 Lonking Holdings Ltd.

Lonking Holdings Ltd. - Overview
Lonking Holdings Ltd. - Business segments
Lonking Holdings Ltd. - Key offerings
Lonking Holdings Ltd. - Segment focus
SWOT

15.16 Manitou BF SA

Manitou BF SA - Overview
Manitou BF SA - Product / Service
Manitou BF SA - Key offerings
SWOT

15.17 Mitsubishi Corp.

Mitsubishi Corp. - Overview
Mitsubishi Corp. - Business segments
Mitsubishi Corp. - Key offerings
Mitsubishi Corp. - Segment focus
SWOT

15.18 Toyota Industries Corp.

Toyota Industries Corp. - Overview
Toyota Industries Corp. - Business segments
Toyota Industries Corp. - Key news
Toyota Industries Corp. - Key offerings
Toyota Industries Corp. - Segment focus
SWOT

16. Appendix

16.1 Scope of the report

Market definition
Objectives
Notes and caveats

16.2 Inclusions and exclusions checklist

Inclusions checklist
Exclusions checklist

16.3 Currency conversion rates for US$

16.4 Research methodology

16.5 Data procurement

Information sources

16.6 Data validation

16.7 Validation techniques employed for market sizing

16.8 Data synthesis

16.9 360 degree market analysis

16.10 List of abbreviations

Research Methodology

Technavio presents a detailed picture of the market by way of study, synthesis, and summation of data from multiple sources. The analysts have presented the various facets of the market with a particular focus on identifying the key industry influencers. The data thus presented is comprehensive, reliable, and the result of extensive research, both primary and secondary.

INFORMATION SOURCES

Primary sources

  • Manufacturers and suppliers
  • Channel partners
  • Industry experts
  • Strategic decision makers

Secondary sources

  • Industry journals and periodicals
  • Government data
  • Financial reports of key industry players
  • Historical data
  • Press releases

DATA ANALYSIS

Data Synthesis

  • Collation of data
  • Estimation of key figures
  • Analysis of derived insights

Data Validation

  • Triangulation with data models
  • Reference against proprietary databases
  • Corroboration with industry experts

REPORT WRITING

Qualitative

  • Market drivers
  • Market challenges
  • Market trends
  • Five forces analysis

Quantitative

  • Market size and forecast
  • Market segmentation
  • Geographical insights
  • Competitive landscape

Interested in this report?

Get your sample now to see our research methodology and insights!

Download Now

Frequently Asked Questions

Forklift Trucks market growth will increase by USD 29244.3 million during 2026-2030.

The Forklift Trucks market is expected to grow at a CAGR of 7.8% during 2026-2030.

Forklift Trucks market is segmented by Class type (Class III, Class V, Class I, Class II, Class IV) Type (Electric, Internal combustion engine) End-user (Industrial, Manufacturing, Construction)

Baumann Group SRL, BYD Co. Ltd., Clark Material Handling Co., Combilift Ltd., Crown Equipment Corp., Doosan Bobcat Inc., Godrej Enterprises Group, Hangcha Group Co. Ltd., Hubtex Maschinenbau GmbH, Hyster Yale Materials Handling Inc., Hyundai Motor Co., Jungheinrich Group, Kalmar Corp., KION GROUP AG, Lonking Holdings Ltd., Manitou BF SA, Merlo Spa, Mitsubishi Corp., Noblelift Equipment Co. Ltd., Toyota Industries Corp. are a few of the key vendors in the Forklift Trucks market.

APAC will register the highest growth rate of 53.8% among the other regions. Therefore, the Forklift Trucks market in APAC is expected to garner significant business opportunities for the vendors during the forecast period.

China, Japan, India, South Korea, Australia, Indonesia, Germany, UK, France, Italy, Spain, The Netherlands, US, Canada, Mexico, Saudi Arabia, UAE, South Africa, Turkey, Qatar, Brazil, Argentina, Chile

  • Rapid growth in construction sector is the driving factor this market.

The Forklift Trucks market vendors should focus on grabbing business opportunities from the Class type segment as it accounted for the largest market share in the base year.
RIA - Research AI Assistant
Ask RIA