
Product Information Management Market Size 2025-2029
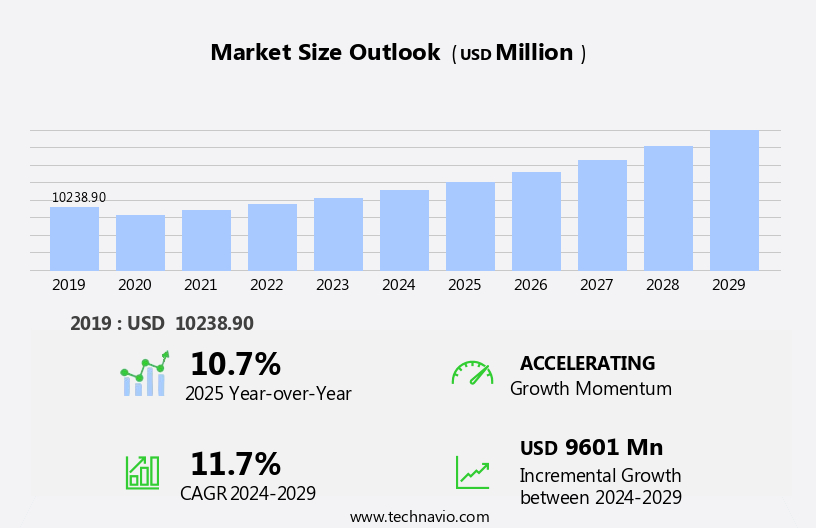
The product information management market size is forecast to increase by USD 9.6 billion, at a CAGR of 11.7% between 2024 and 2029.
- The Product Information Management (PIM) market experiences significant growth due to the burgeoning e-commerce industry, which increasingly relies on PIM solutions to efficiently manage vast amounts of product data. These systems enable businesses to centralize, enrich, and distribute accurate product information across multiple sales channels, ensuring a consistent and engaging consumer experience. Advancements in technology, such as AI and machine learning, further bolster the PIM market. By integrating these skills into data management processes, companies can enhance their offerings, improve search functionality, and personalize recommendations for customers.
- With the increasing volume and complexity of data, ensuring its protection becomes a critical concern for businesses. Addressing these challenges requires robust security measures and stringent data governance policies to mitigate risks and maintain consumer trust. Companies seeking to capitalize on market opportunities and navigate challenges effectively must focus on implementing advanced PIM solutions and prioritizing data security. However, the market faces challenges, primarily concerning data security and privacy threats.
What will be the Size of the Product Information Management Market during the forecast period?
Get Key Insights on Market Forecast (PDF)
Request Free Sample
- The product information management (PIM) market continues to evolve, driven by the increasing complexity of managing vast amounts of data and the need for real-time, accurate product information across various sectors. Product content creation requires adherence to data standardization techniques and data enrichment services to ensure compliance with regulations and enhance product offerings. Real-time data synchronization and workflow automation tools facilitate seamless supplier data integration into a centralized product repository. Data governance policies and product lifecycle management ensure product data accuracy and consistency. E-commerce product feeds and product data syndication enable multichannel distribution, while data quality monitoring and master data management maintain product information accuracy.
- Content syndication platforms and API integration services streamline product information modeling and data migration strategies. Industry growth in PIM is expected to reach 12% annually, with a focus on metadata schema design, taxonomy development, and rich media integration to optimize omnichannel product data. Product information architecture and data analytics dashboards provide valuable insights, enhancing search engine optimization and customer data integration. For instance, a leading retailer implemented a PIM solution, resulting in a 30% increase in product data accuracy and a 25% reduction in time spent on manual data entry. This streamlined process allowed the retailer to provide customers with accurate, consistent product information across all channels, ultimately driving sales growth.
How is this Product Information Management Industry segmented?
The product information management industry research report provides comprehensive data (region-wise segment analysis), with forecasts and estimates in "USD million" for the period 2025-2029, as well as historical data from 2019-2023 for the following segments.
- Deployment
- On-premises
- Cloud
- End-user
- Large enterprises
- SMEs
- Application
- Product data publishing
- Digital asset management
- Data syndication
- Data modelling
- Geography
- North America
- US
- Canada
- Europe
- France
- Germany
- Italy
- UK
- APAC
- China
- India
- Japan
- South America
- Brazil
- Rest of World (ROW)
- North America
By Deployment Insights
The On-premises segment is estimated to witness significant growth during the forecast period. The on-premises product information management (PIM) market segment involves organizations installing and managing PIM software on their in-house servers and computing infrastructure. This setup offers businesses complete control over their PIM environment, including data, security protocols, hardware, and software maintenance. On-premises solutions are particularly attractive to industries with stringent data security requirements, such as finance, healthcare, defense, and government. According to the latest market analysis, on-premises PIM adoption currently accounts for approximately 60% of the global PIM market share. Data enrichment through Artificial Intelligence and Augmented Reality (AR) further enhances the value proposition of PIM systems.
The cloud segment has emerged as the dominant and most dynamic force within the global product information management market. This model, typically delivered as a Software as a Service (SaaS) solution, involves a PIM company hosting and managing the application and its associated data on its own server infrastructure, providing access to customers over the internet. This approach fundamentally alters the economic and operational paradigm of PIM implementation, shifting the financial burden from large upfront capital expenditures to a more manageable and predictable subscription based operational expenditure model. The strategic advantages of cloud PIM are compelling and numerous, fueling its widespread adoption across nearly all industries, from retail and manufacturing to distribution and consumer packaged goods. PIM systems integrate with Enterprise Resource Planning (ERP) and Customer Relationship Management (CRM) systems, downstream channels, marketing channels, and IT service teams.
In comparison, cloud-based PIM solutions, which account for the remaining 40% of the market, are projected to grow by 15% during the same period. These figures underscore the ongoing demand for both on-premises and cloud-based PIM solutions, highlighting the market's dynamism and the importance of businesses staying informed about the latest trends and developments. Data governance frameworks and product information governance facilitate business process automation, while content collaboration tools and marketing content integration streamline workflows.
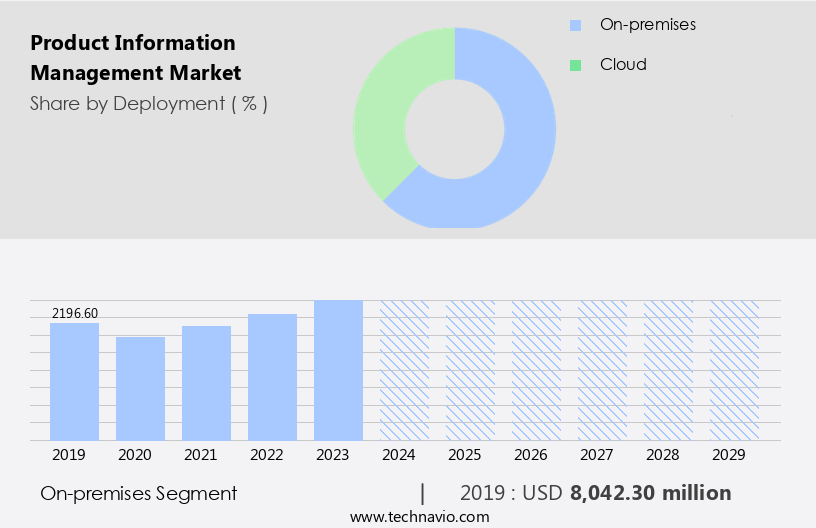
The On-premises segment was valued at USD 8.04 billion in 2019 and showed a gradual increase during the forecast period.
Organizations are implementing PIM system implementation projects to establish a single source of truth and streamline the data cleansing process. A robust product information strategy enables better sales content integration, while content syndication best practices help reach wider audiences. Establishing a strong data governance framework with data lineage tracking and data audit trails supports transparency and trust. Furthermore, data lifecycle management ensures that product information remains relevant and accurate over time. The adoption of PIM is especially valuable in optimizing product data for e-commerce, managing product information across channels, and integrating PIM with other enterprise systems. Businesses are leveraging PIM for improved customer experience by building a scalable PIM infrastructure and centralizing product information management.
Regional Analysis
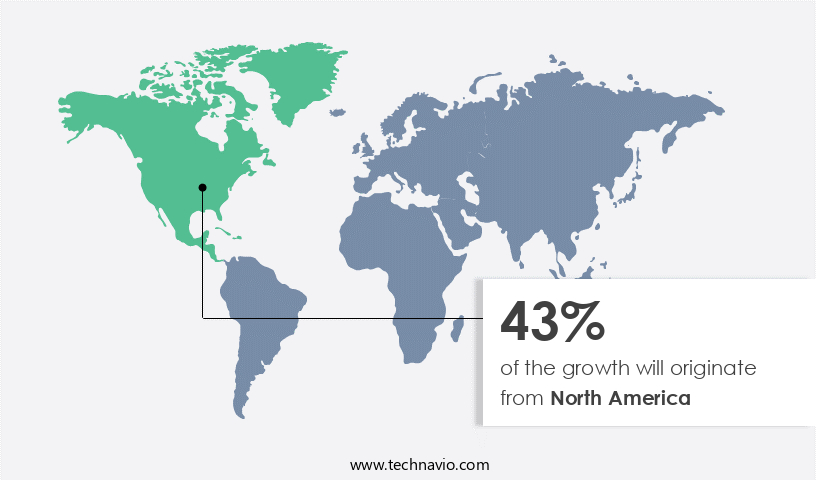
North America is estimated to contribute 43% to the growth of the global market during the forecast period. Technavio's analysts have elaborately explained the regional trends and drivers that shape the market during the forecast period.
See How product information management market Demand is Rising in North America Request Free Sample
Product Information Management (PIM) solutions have gained significant traction in North America, making it the most mature and extensive market in the world. With a high adoption rate, this region, comprising the United States and Canada, is primarily driven by the competitive e-commerce landscape. Retailers and brands in this region face immense pressure to deliver exceptional, consistent, and rich customer experiences across various digital touchpoints. Consumer expectations for detailed specifications, high-resolution imagery, 360-degree views, and accurate inventory data are non-negotiable. As a result, a robust PIM system is no longer a luxury but a fundamental requirement for a modern digital commerce stack.
According to recent market data, PIM adoption in North America grew by 21% in 2021. Furthermore, industry experts anticipate a 25% increase in PIM adoption by 2025. Comparing the adoption rates of PIM solutions in North America and Europe, the former region shows a 3% higher adoption rate. This discrepancy can be attributed to the more mature ecommerce landscape and the increasing pressure to meet consumer expectations in North America. By implementing PIM solutions, businesses in North America can streamline their product data management processes, ensuring accurate, consistent, and enriched product information across all digital touchpoints. This not only enhances the overall customer experience but also improves operational efficiency and reduces errors, ultimately leading to increased sales and customer satisfaction.
Market Dynamics
Our researchers analyzed the data with 2024 as the base year, along with the key drivers, trends, and challenges. A holistic analysis of drivers will help companies refine their marketing strategies to gain a competitive advantage. The Product Information Management (PIM) market is experiencing significant growth, driven by the increasing need for businesses to maintain accurate, consistent, and centralized product data across multiple channels. Data quality metrics play a vital role in ensuring that organizations meet compliance requirements and maintain brand integrity. Effective product catalog management combined with product data validation ensures seamless customer experiences. Businesses are increasingly adopting attribute mapping strategies and data mapping techniques to improve efficiency in multichannel data distribution.
Automation, such as automating product data syndication workflows, boosts productivity, while using metadata to improve searchability enhances discoverability. Companies are focusing on the enrichment of product information with customer reviews and the effective use of PIM for supply chain optimization to gain competitive advantages. From managing product information throughout its lifecycle to maintaining consistent product data across platforms, the PIM market enables better data-driven decisions. Key priorities include implementing a data governance framework for PIM, improving data accuracy and consistency, and enhancing product discovery and customer experience. Ultimately, businesses benefit from streamlining product data management processes, driving growth, and delivering a seamless omnichannel presence.
What are the key market drivers leading to the rise in the adoption of Product Information Management Industry?
- The e-commerce industry's continued growth and success is the primary catalyst for the increasing demand for Product Information Management (PIM) solutions, making it a significant market driver. Urban residents in these nations increasingly rely on e-commerce platforms for their purchases. Major e-commerce players include Amazon.Com Inc., Alibaba Group Holding Ltd., eBay Inc., Walmart Inc., and Target Brands Inc. The pandemic significantly boosted global e-commerce spending. Implementing a robust PIM system strategy is essential for improving data quality through automation and ensuring product information compliance.
- The global e-commerce market experiences robust growth, fueled by surging consumer demand, expanding Internet penetration, and rising smartphone usage. Annual online sales growth exceeds 18%, with developing countries such as Mexico, India, the Philippines, and China witnessing a 25% expansion rate. PIM systems help businesses manage product data in a centralized and consistent manner, reducing errors and improving data accuracy. By optimizing PIM for business process efficiency and regulatory compliance, businesses can improve their bottom line and enhance the customer experience.
What are the market trends shaping the Product Information Management Industry?
- The adoption of artificial intelligence and machine learning skills is becoming a mandated trend in data management and consumer experience enhancement. In today's competitive business landscape, companies across industries, including healthcare, retail, and BFSI, invest in advanced technologies like artificial intelligence (AI) and machine learning (ML) to enhance their Product Information Management (PIM) systems. AI-driven PIM solutions offer numerous benefits, such as automatic product classification, anomaly detection, data enrichment, product grading, and contextual suggestions.
- According to recent market research, the global PIM market is expected to grow by over 12% in the next few years, underscoring the growing importance of effective product data management. For instance, a leading retailer reported a 10% increase in sales after implementing an AI-driven PIM solution. These features enable businesses to streamline their operations, improve data accuracy, and gain valuable insights. Furthermore, AI-powered chatbots can significantly enhance customer experience, leading to increased sales and profitability.
What challenges does the Product Information Management Industry face during its growth?
- Data security and privacy concerns represent significant challenges that can hinder industry growth. Companies must balance the need to collect and utilize data with the imperative to protect it from threats and ensure compliance with regulations. Product Information Management (PIM) systems have gained significant attention in the business world due to their ability to streamline and centralize product data. However, the adoption of PIM solutions is not without challenges. Security and regulatory concerns have emerged as major barriers to implementation, particularly for organizations handling sensitive data. The collection, transmission, and synchronization of product information across various channels pose potential risks.
- According to recent studies, the global PIM market is projected to grow by over 15% annually, indicating a robust demand for these solutions. For instance, a retail company reported a 25% increase in sales after implementing a PIM system that ensured accurate and consistent product data across all sales channels. Consequently, businesses are more inclined towards integrating PIM functionalities into their existing systems rather than adopting new solutions. Small and medium-sized enterprises (SMEs), in particular, have reconsidered their decision to use cloud-based PIM systems due to privacy concerns.
Exclusive Customer Landscape
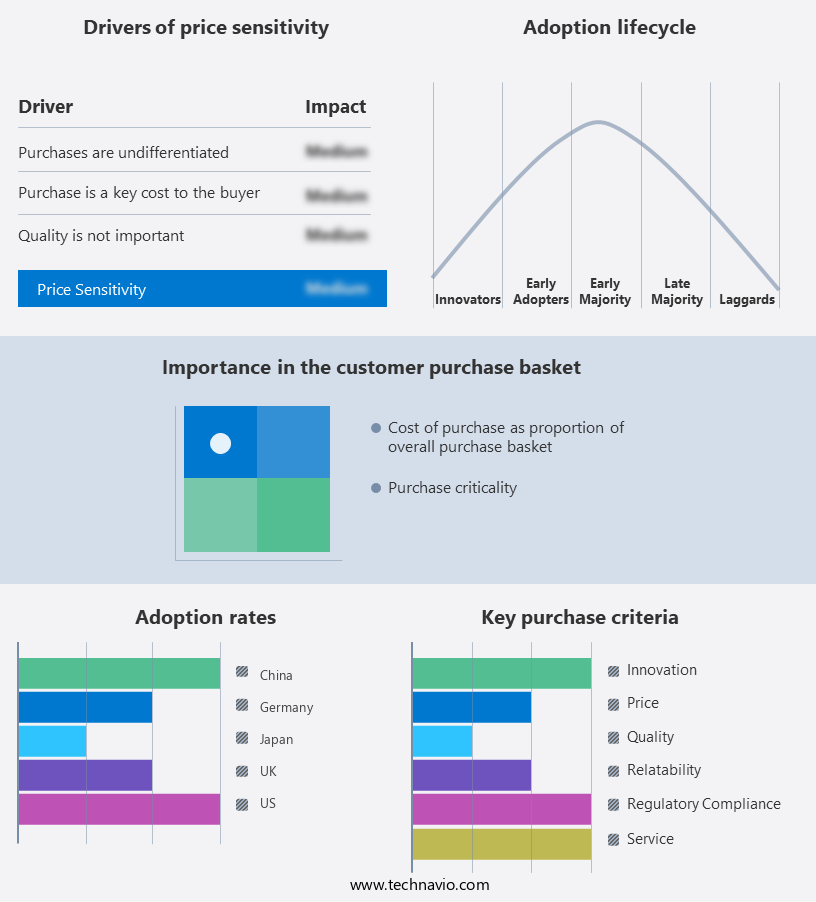
The product information management market forecasting report includes the adoption lifecycle of the market, covering from the innovator's stage to the laggard's stage. It focuses on adoption rates in different regions based on penetration. Furthermore, the product information management market report also includes key purchase criteria and drivers of price sensitivity to help companies evaluate and develop their market growth analysis strategies.
Customer Landscape
Key Companies & Market Insights
Companies are implementing various strategies, such as strategic alliances, product information management market forecast, partnerships, mergers and acquisitions, geographical expansion, and product/service launches, to enhance their presence in the industry.
Akeneo SAS - The company specializes in product information management and offers Akeneo PIM Growth Edition, a powerful solution designed to streamline data management.
The industry research and growth report includes detailed analyses of the competitive landscape of the market and information about key companies, including:
- Akeneo SAS
- Bluestone Norway
- Censhare GmbH
- Contentserv Swiss GmbH
- Informatica Inc.
- Inriver AB
- International Business Machines Corp.
- Jasper Commerce Inc.
- Mobius Knowledge Services P. Ltd.
- Oracle Corp.
- Pimcore GmbH
- Plytix SLU
- Salsify Inc.
- SAP SE
- Stibo Systems
- Syndigo LLC
- True Commerce Inc.
- Viamedici Software GmbH
- Vinculum Solutions Pvt. Ltd.
Qualitative and quantitative analysis of companies has been conducted to help clients understand the wider business environment as well as the strengths and weaknesses of key industry players. Data is qualitatively analyzed to categorize companies as pure play, category-focused, industry-focused, and diversified; it is quantitatively analyzed to categorize companies as dominant, leading, strong, tentative, and weak.
Recent Development and News in Product Information Management Market
- In January 2024, Informatica, a leading data management solutions provider, announced the launch of its new Product Information Management (PIM) solution, Informatica MDM for Product, designed to help businesses manage and enrich product data across multiple channels (Informatica Press Release).
- In March 2024, Akeneo, a prominent open-source PIM solution provider, entered into a strategic partnership with Salesforce, enabling Akeneo users to easily integrate their product data with Salesforce Commerce Cloud (Akeneo Press Release).
- In April 2025, SAP SE, a leading enterprise application software company, completed the acquisition of Gigya, a customer identity and access management company, to strengthen its product portfolio and enhance its PIM offerings (SAP Press Release).
- In May 2025, Adobe, a major player in digital media and marketing solutions, unveiled significant advancements in its Experience Manager (AEM) platform, including improved PIM capabilities, enabling businesses to manage and deliver personalized product experiences (Adobe Press Release).
Research Analyst Overview
- The market for Product Information Management (PIM) solutions continues to evolve, driven by the increasing complexity of managing vast amounts of product data across various sectors. Data version control and data quality rules are essential components of PIM systems, ensuring accurate and consistent product information. PIM implementation enables customer experience management by providing access to up-to-date product content throughout the product content lifecycle. Image management systems, multi-language support, and automated data updates are critical features that enhance the efficiency of PIM systems.
- Product data translation and localization, pricing data management, and data cleansing processes are essential for global businesses. The PIM market is expected to grow by 12% annually, driven by the need for improved product information management and regulatory compliance management. For instance, a leading retailer reported a 20% increase in sales due to the implementation of a PIM system, which enabled seamless integration of sales content and inventory data. Additionally, video management systems, technical documentation management, and inventory data integration are emerging trends in the market.
Dive into Technavio's robust research methodology, blending expert interviews, extensive data synthesis, and validated models for unparalleled Product Information Management Market insights. See full methodology.
|
Market Scope |
|
|
Report Coverage |
Details |
|
Page number |
217 |
|
Base year |
2024 |
|
Historic period |
2019-2023 |
|
Forecast period |
2025-2029 |
|
Growth momentum & CAGR |
Accelerate at a CAGR of 11.7% |
|
Market growth 2025-2029 |
USD 9.6 billion |
|
Market structure |
Fragmented |
|
YoY growth 2024-2025(%) |
10.7 |
|
Key countries |
US, China, Germany, Canada, Japan, UK, France, India, Italy, and Brazil |
|
Competitive landscape |
Leading Companies, Market Positioning of Companies, Competitive Strategies, and Industry Risks |
What are the Key Data Covered in this Product Information Management Market Research and Growth Report?
- CAGR of the Product Information Management industry during the forecast period
- Detailed information on factors that will drive the growth and forecasting between 2025 and 2029
- Precise estimation of the size of the market and its contribution of the industry in focus to the parent market
- Accurate predictions about upcoming growth and trends and changes in consumer behaviour
- Growth of the market across North America, Europe, APAC, South America, and Middle East and Africa
- Thorough analysis of the market's competitive landscape and detailed information about companies
- Comprehensive analysis of factors that will challenge the product information management market growth of industry companies
We can help! Our analysts can customize this product information management market research report to meet your requirements.
 RIA -
RIA - 
