3D Automated Optical Inspection (AOI) Equipment Market Analysis, Size, and Forecast 2026-2030: APAC (China, Japan, and South Korea), North America (US, Canada, and Mexico), Europe (Germany, UK, and France), South America (Brazil and Argentina), Middle East and Africa (Saudi Arabia, UAE, and South Africa), and Rest of World (ROW)

3D Automated Optical Inspection (AOI) Equipment Market Analysis, Size, and Forecast 2026-2030:
APAC (China, Japan, and South Korea), North America (US, Canada, and Mexico), Europe (Germany, UK, and France), South America (Brazil and Argentina), Middle East and Africa (Saudi Arabia, UAE, and South Africa), and Rest of World (ROW)

Published: Apr 2026 303 Pages SKU: IRTNTR41188

Market Overview at a Glance

$2.61 B
Market Opportunity
44.2%
CAGR 2025 - 2030
64.2%
APAC Growth
$262.2 Mn
3D inline AOI segment 2024

3D Automated Optical Inspection (AOI) Equipment Market Size 2026-2030

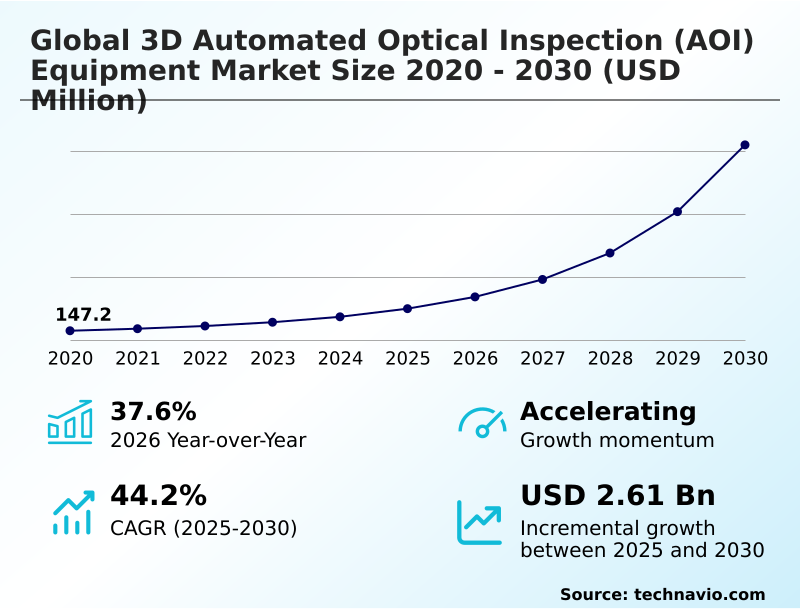
The 3d automated optical inspection (aoi) equipment market size is valued to increase by USD 2.61 billion, at a CAGR of 44.2% from 2025 to 2030. Accelerating complexity in electronic component miniaturization will drive the 3d automated optical inspection (aoi) equipment market.

Major Market Trends & Insights

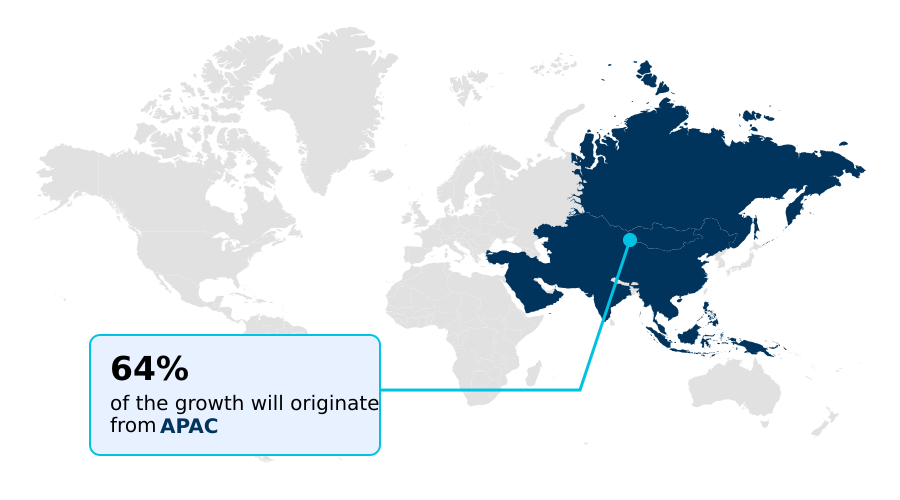
  • APAC dominated the market and accounted for a 64.2% growth during the forecast period.
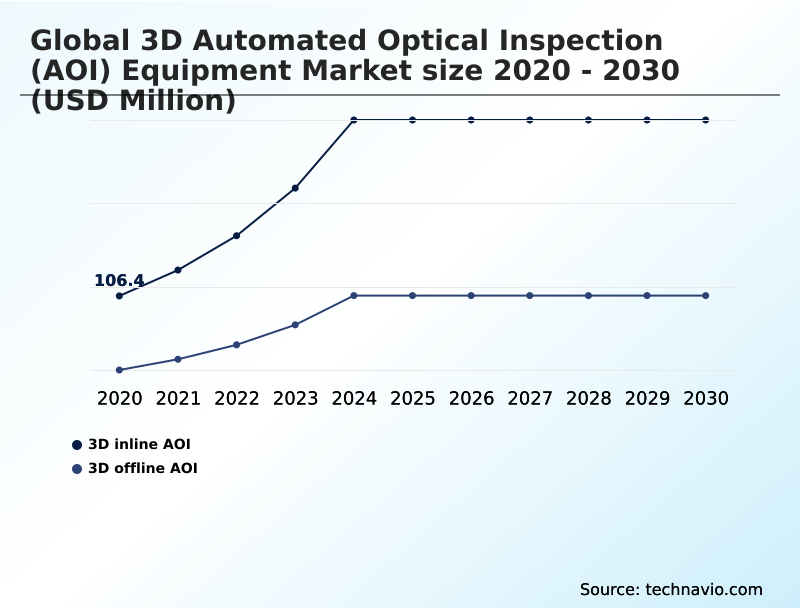
  • By Distribution Channel - 3D inline AOI segment was valued at USD 262.2 million in 2024
  • By Technology - Confocal inspection segment accounted for the largest market revenue share in 2024

Market Size & Forecast

  • Market Opportunities: USD 2.96 billion
  • Market Future Opportunities: USD 2.61 billion
  • CAGR from 2025 to 2030 : 44.2%

Market Summary

  • The 3D automated optical inspection (AOI) equipment market is undergoing a significant transformation, driven by the relentless pace of electronic component miniaturization and the widespread adoption of Industry 4.0 principles. Traditional 2D inspection methods are no longer sufficient for verifying the integrity of high density interconnect designs found in advanced electronics.
  • This has created a critical need for systems capable of precise volumetric measurement to detect defects like lifted leads and ensure the reliability of micro solder joints. For instance, an automotive electronics manufacturer producing advanced driver assistance systems (ADAS) relies on 3D AOI to achieve zero-defect quality mandates, thereby preventing costly recalls and ensuring passenger safety.
  • While the integration of AI-driven autonomous programming promises to enhance defect classification and reduce the reliance on skilled operators, the industry grapples with the high initial capital investment for these systems and the complexities of managing the massive datasets they generate.
  • The convergence of 3D AOI with solder paste inspection (SPI) and automated x-ray inspection (AXI) into unified platforms marks a key trend toward achieving a holistic view of the manufacturing process, transforming inspection from a quality gate into a predictive optimization tool.

What will be the Size of the 3D Automated Optical Inspection (AOI) Equipment Market during the forecast period?

Get Key Insights on Market Forecast (PDF) Request Free Sample

How is the 3D Automated Optical Inspection (AOI) Equipment Market Segmented?

The 3d automated optical inspection (aoi) equipment industry research report provides comprehensive data (region-wise segment analysis), with forecasts and estimates in "USD million" for the period 2026-2030, as well as historical data from 2020-2024 for the following segments.

  • Distribution channel
    • 3D inline AOI
    • 3D offline AOI
  • Technology
    • Confocal inspection
    • Structured light inspection
    • Laser inspection
    • Multi-directional inspection
  • End-user
    • Original equipment manufacturers
    • Contract manufacturers
    • Research and development institutions
    • Quality control laboratories
  • Geography
    • APAC
      • China
      • Japan
      • South Korea
    • North America
      • US
      • Canada
      • Mexico
    • Europe
      • Germany
      • UK
      • France
    • South America
      • Brazil
      • Argentina
    • Middle East and Africa
      • Saudi Arabia
      • UAE
      • South Africa
    • Rest of World (ROW)

By Distribution Channel Insights

The 3d inline aoi segment is estimated to witness significant growth during the forecast period.

The 3D inline AOI segment is central to modern manufacturing, enabling real-time, high-speed volumetric measurement without interrupting production flow.

These systems are crucial for achieving high first pass yields, particularly in high-volume sectors where firms using this technology report a defect detection improvement of over 98% compared to manual methods.

Integrating directly into the SMT line, they facilitate immediate closed loop process control by providing data for real-time process optimization.

The technology's capability for coplanarity verification and inspection of micro solder joints is indispensable for the assembly of advanced driver assistance systems and wearable medical sensors.

This approach to quality assurance drives significant gains in overall equipment effectiveness by minimizing rework and scrap, ensuring total process transparency within the smart factory ecosystem.

Request Free Sample

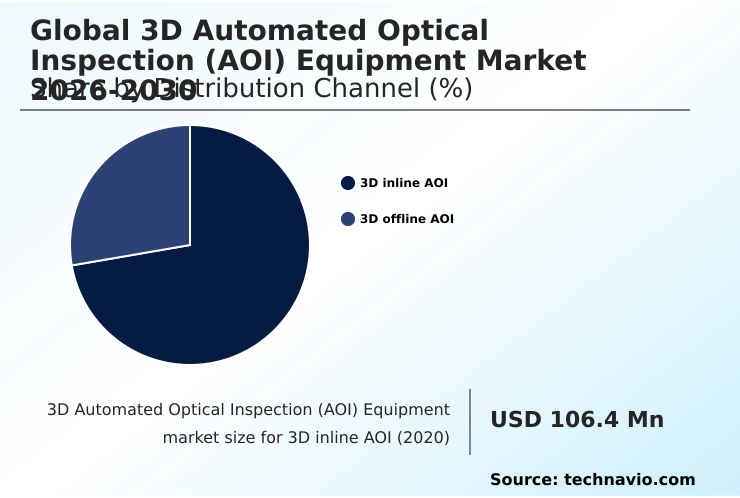
The 3D inline AOI segment was valued at USD 262.2 million in 2024 and showed a gradual increase during the forecast period.

Request Free Sample

Regional Analysis

APAC is estimated to contribute 64.2% to the growth of the global market during the forecast period.Technavio’s analysts have elaborately explained the regional trends and drivers that shape the market during the forecast period.

See How 3D Automated Optical Inspection (AOI) Equipment Market Demand is Rising in APAC Request Free Sample

The geographic landscape is dominated by APAC, which accounts for over 64% of the market's incremental growth, driven by its massive electronics manufacturing hubs.

In this region, the push toward lights out manufacturing leverages 3D inline AOI and AI-driven autonomous programming to manage high-volume production.

North America and Europe focus on high-value sectors, where IATF 16949 certification is crucial for automotive suppliers using these systems for the inspection of electric vehicle electronics and autonomous driving sensors.

In these markets, advanced systems for non destructive testing and first article inspection are standard.

Firms in these regions achieve a significant reduction in inspection-related labor costs, sometimes by as much as 50%, by adopting automated platforms for high mix low volume production. The expansion into specialized semiconductor wafer inspection further defines regional priorities.

Market Dynamics

Our researchers analyzed the data with 2025 as the base year, along with the key drivers, trends, and challenges. A holistic analysis of drivers will help companies refine their marketing strategies to gain a competitive advantage.

  • The strategic implementation of 3D automated optical inspection (AOI) equipment is reshaping quality assurance across advanced manufacturing. For specialized applications like 3D automated optical inspection for EV power modules, the technology's ability to perform volumetric measurement of solder fillets for automotive electronics is critical for ensuring long-term reliability.
  • The integration of AI-driven defect classification in SMT lines is a core component of the role of 3D AOI in Industry 4.0 environments, where systems learn to distinguish true defects from minor process variations. This capability is pivotal for reducing false call rates in 3D AOI systems, which has been a persistent challenge.
  • The use of structured light inspection for BGA solder joints and confocal inspection for advanced semiconductor packaging addresses the impact of component miniaturization on 3d aoi adoption. Furthermore, innovations like high speed multi projection moire for reflective surfaces solve inspection challenges with mirror finish dies using 3d aoi.
  • The integration of disparate systems is another key area of development, with a focus on integrating 3D AOI with solder paste inspection systems and using IPC CFX for smart factory connectivity with AOI. This creates a closed loop feedback from 3D AOI to pick and place machines, enabling real-time adjustments.
  • The adoption of 3d aoi for 01005 and 008004 chip components and 3D metrology for micro bumps and through silicon vias is now standard for firms assembling high performance computing module assembly. Multi-directional inspection to eliminate shadow effects is essential for complex assemblies, as is the inspection of wide bandgap semiconductors like SiC and GaN.
  • Even in flexible manufacturing, 3D offline AOI for high mix low volume manufacturing provides a pathway to zero defect manufacturing using 3d optical inspection, with some users reporting double the throughput of older methods. Finally, AI autonomous programming for 3d aoi systems simplifies setup and operation, making advanced inspection more accessible.

What are the key market drivers leading to the rise in the adoption of 3D Automated Optical Inspection (AOI) Equipment Industry?

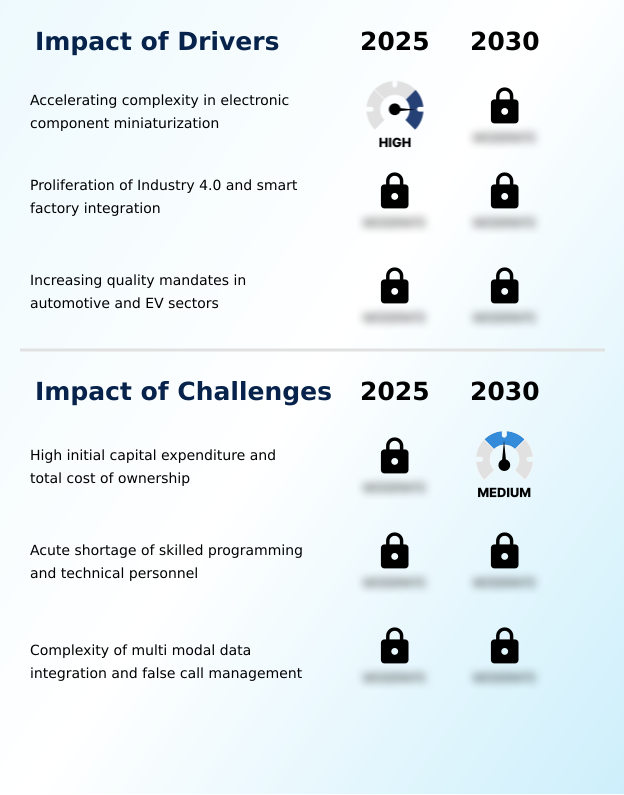
  • The accelerating complexity in electronic component miniaturization is a key driver for the 3D automated optical inspection (AOI) equipment market.

  • Market growth is fundamentally driven by the accelerating complexity of electronic assemblies and the stringent quality demands of high-reliability sectors.
  • The relentless trend of electronic component miniaturization makes 3D metrology indispensable for verifying the structural integrity of high density interconnects and micro solder joints.
  • In the automotive sector, the transition to electric vehicle electronics and advanced driver assistance systems mandates rigorous inspection to IATF 16949 certification standards, with some manufacturers reporting a 99.9% defect capture rate for critical components.
  • Furthermore, the proliferation of Industry 4.0 and the smart factory ecosystem requires the closed loop process control that 3D AOI systems provide, feeding real-time data to pick and place machines and solder paste printers to dynamically optimize production and improve overall equipment effectiveness by up to 20%.

What are the market trends shaping the 3D Automated Optical Inspection (AOI) Equipment Industry?

  • The integration of AI-driven autonomous programming and defect classification is a transformative market trend. This development automates complex inspection parameter settings and enhances defect classification accuracy.

  • Key market trends are centered on intelligent automation and system convergence. The adoption of deep learning algorithms for AI-based defect classification allows systems to reduce false call rates by over 30%, a significant improvement that minimizes manual intervention. This trend toward AI autonomous programming is critical for addressing the complexities of high-mix production environments.
  • Concurrently, the market is seeing a convergence of inspection technologies, with multi modal data fusion integrating data from solder paste inspection and automated x ray inspection. This provides a holistic view of the manufacturing process, enabling predictive process optimization.
  • The use of the IPC CFX protocol facilitates seamless machine to machine communication, transforming disparate inspection points into a cohesive, data-rich network that enhances process capability index metrics and supports zero defect manufacturing goals.

What challenges does the 3D Automated Optical Inspection (AOI) Equipment Industry face during its growth?

  • The high initial capital expenditure and total cost of ownership present a key challenge affecting the growth of the 3D automated optical inspection (AOI) equipment industry.

  • Significant challenges constrain market adoption, primarily the high initial capital investment and the complexity of data management. The cost of acquiring systems with high resolution CMOS sensors and advanced digital light projectors is a barrier for smaller enterprises.
  • Moreover, managing the high volume of data and the prevalence of false calls creates operational bottlenecks, with some lines experiencing a 10% reduction in throughput due to unnecessary re-inspection. The technical skills gap presents another hurdle, as programming and optimizing these systems for tasks like silicon carbide inspection or gallium nitride inspection require specialized expertise.
  • Integrating data across platforms for shadow effect elimination and lifted leads detection remains a complex software challenge, hindering the achievement of a truly unified, multi-vendor inspection ecosystem.

Exclusive Technavio Analysis on Customer Landscape

The 3d automated optical inspection (aoi) equipment market forecasting report includes the adoption lifecycle of the market, covering from the innovator’s stage to the laggard’s stage. It focuses on adoption rates in different regions based on penetration. Furthermore, the 3d automated optical inspection (aoi) equipment market report also includes key purchase criteria and drivers of price sensitivity to help companies evaluate and develop their market growth analysis strategies.

Customer Landscape of 3D Automated Optical Inspection (AOI) Equipment Industry

Competitive Landscape

Companies are implementing various strategies, such as strategic alliances, 3d automated optical inspection (aoi) equipment market forecast, partnerships, mergers and acquisitions, geographical expansion, and product/service launches, to enhance their presence in the industry.

Shenzhen Zhenhuaxing Intelligent - Delivers true 3D measurement-based inspection technology, focusing on the development and manufacturing of advanced 3D metrology solutions for complete process optimization.

The industry research and growth report includes detailed analyses of the competitive landscape of the market and information about key companies, including:

  • Shenzhen Zhenhuaxing Intelligent
  • Camtek Ltd.
  • GOPEL electronic GmbH
  • KLA Corp.
  • Koh Young Technology Inc.
  • MEK Europe BV
  • Mirtec Co. Ltd.
  • Mycronic AB
  • NANOTRONICS IMAGING INC.
  • Nordson Corp.
  • OMRON Corp.
  • PARMI Co. Ltd.
  • Saki Corp.
  • Stratus Vision GmbH
  • Viscom AG
  • Machine Vision Products Inc.
  • Visionx Inc.
  • ViTrox Corp. Berhad
  • Yamaha Motor Co. Ltd.

Qualitative and quantitative analysis of companies has been conducted to help clients understand the wider business environment as well as the strengths and weaknesses of key industry players. Data is qualitatively analyzed to categorize companies as pure play, category-focused, industry-focused, and diversified; it is quantitatively analyzed to categorize companies as dominant, leading, strong, tentative, and weak.

Recent Development and News in 3d automated optical inspection (aoi) equipment market

  • In March 2025, Koh Young Technology Inc. launched its advanced AI-powered software suite, designed to reduce 3D AOI programming time and automate defect classification, significantly enhancing efficiency in high-mix manufacturing environments.
  • In February 2025, Saki Corp. announced a strategic partnership with a leading industrial robotics firm to integrate its 3D-AOI systems into fully autonomous SMT lines, improving M2M communication for real-time process adjustments and predictive maintenance.
  • In November 2024, Viscom AG expanded its North American presence by opening a new technology and training center in California, dedicated to providing enhanced local support for semiconductor and electric vehicle manufacturing clients.
  • In September 2024, Nordson Corp. completed the acquisition of a specialized optics technology firm, strengthening its portfolio of high-resolution sensors and advanced digital light projectors for its 3D inspection division.

Dive into Technavio’s robust research methodology, blending expert interviews, extensive data synthesis, and validated models for unparalleled 3D Automated Optical Inspection (AOI) Equipment Market insights. See full methodology.

Market Scope
Page number 303
Base year 2025
Historic period 2020-2024
Forecast period 2026-2030
Growth momentum & CAGR Accelerate at a CAGR of 44.2%
Market growth 2026-2030 USD 2605.7 million
Market structure Fragmented
YoY growth 2025-2026(%) 37.6%
Key countries China, Japan, South Korea, India, Australia, Indonesia, US, Canada, Mexico, Germany, UK, France, Italy, Spain, The Netherlands, Brazil, Argentina, Chile, Saudi Arabia, UAE, South Africa, Israel and Turkey
Competitive landscape Leading Companies, Market Positioning of Companies, Competitive Strategies, and Industry Risks

Request Free Sample

Research Analyst Overview

  • The 3D automated optical inspection (AOI) equipment market is defined by a shift toward data-driven, autonomous quality control. The proliferation of electric vehicle electronics and components for high performance computing necessitates advanced 3D metrology for tasks like solder fillets inspection and coplanarity verification. Key technologies such as structured light inspection, confocal inspection, and multi-directional inspection are fundamental to this evolution.
  • The integration of these systems into a smart factory ecosystem enables closed loop process control, where data from 3D inline AOI units feeds back to solder paste printers and pick and place machines, optimizing overall equipment effectiveness. This machine to machine communication is crucial for managing high density interconnect designs and advanced semiconductor packaging.
  • A primary trend influencing boardroom budgeting is the adoption of AI driven autonomous programming and deep learning algorithms, which address the skills gap and push toward lights out manufacturing. Firms adopting these AI-enhanced systems have reported a reduction in program creation time by up to 60%.
  • The market also encompasses 3D offline AOI for flexible production, solder paste inspection, and automated x ray inspection for comprehensive multi modal data fusion. Challenges remain in managing false call rates and the high cost of high resolution CMOS sensors and digital light projectors.
  • The ultimate goal is achieving high first pass yields and ensuring the integrity of heterogenous integration, 2.5d/3d chip stacking, micro solder joints, and through silicon vias.

What are the Key Data Covered in this 3D Automated Optical Inspection (AOI) Equipment Market Research and Growth Report?

  • What is the expected growth of the 3D Automated Optical Inspection (AOI) Equipment Market between 2026 and 2030?

    • USD 2.61 billion, at a CAGR of 44.2%

  • What segmentation does the market report cover?

    • The report is segmented by Distribution Channel (3D inline AOI, and 3D offline AOI), Technology (Confocal inspection, Structured light inspection, Laser inspection, and Multi-directional inspection), End-user (Original equipment manufacturers, Contract manufacturers, Research and development institutions, and Quality control laboratories) and Geography (APAC, North America, Europe, South America, Middle East and Africa)

  • Which regions are analyzed in the report?

    • APAC, North America, Europe, South America and Middle East and Africa

  • What are the key growth drivers and market challenges?

    • Accelerating complexity in electronic component miniaturization , High initial capital expenditure and total cost of ownership

  • Who are the major players in the 3D Automated Optical Inspection (AOI) Equipment Market?

    • Shenzhen Zhenhuaxing Intelligent, Camtek Ltd., GOPEL electronic GmbH, KLA Corp., Koh Young Technology Inc., MEK Europe BV, Mirtec Co. Ltd., Mycronic AB, NANOTRONICS IMAGING INC., Nordson Corp., OMRON Corp., PARMI Co. Ltd., Saki Corp., Stratus Vision GmbH, Viscom AG, Machine Vision Products Inc., Visionx Inc., ViTrox Corp. Berhad and Yamaha Motor Co. Ltd.

Market Research Insights

  • The market dynamics are increasingly shaped by the need for superior defect detection, where advanced systems demonstrate a 40% reduction in false call rates compared to legacy platforms. The adoption of AI-based defect classification and predictive process optimization enables manufacturers to achieve higher yields, with some reporting a 15% improvement in overall equipment effectiveness.
  • The integration of cloud based analytics allows for real time process optimization across global facilities. Technologies enabling sub micron accuracy are critical for advanced packaging metrology and the inspection of wearable medical sensors.
  • These sophisticated capabilities are essential for achieving the zero defect manufacturing standards required by sectors utilizing advanced driver assistance systems, pushing the industry toward greater automation and data-driven quality control.

We can help! Our analysts can customize this 3d automated optical inspection (aoi) equipment market research report to meet your requirements.

Get in touch

1. Executive Summary

1.1 Market overview

Executive Summary - Chart on Market Overview
Executive Summary - Data Table on Market Overview
Executive Summary - Chart on Global Market Characteristics
Executive Summary - Chart on Market by Geography
Executive Summary - Chart on Market Segmentation by Distribution Channel
Executive Summary - Chart on Market Segmentation by Technology
Executive Summary - Chart on Market Segmentation by End-user
Executive Summary - Chart on Incremental Growth
Executive Summary - Data Table on Incremental Growth
Executive Summary - Chart on Company Market Positioning

2. Technavio Analysis

2.1 Analysis of price sensitivity, lifecycle, customer purchase basket, adoption rates, and purchase criteria

2.2 Criticality of inputs and Factors of differentiation

Chart on Overview on criticality of inputs and factors of differentiation

2.3 Factors of disruption

Chart on Overview on factors of disruption

2.4 Impact of drivers and challenges

Chart on Impact of drivers and challenges in 2025 and 2030

3. Market Landscape

3.1 Market ecosystem

Chart on Parent Market
Data Table on - Parent Market

3.2 Market characteristics

Chart on Market characteristics analysis

3.3 Value chain analysis

Chart on Value chain analysis

4. Market Sizing

4.1 Market definition

Data Table on Offerings of companies included in the market definition

4.2 Market segment analysis

Market segments

4.3 Market size 2025

4.4 Market outlook: Forecast for 2025-2030

Chart on Global - Market size and forecast 2025-2030 ($ million)
Data Table on Global - Market size and forecast 2025-2030 ($ million)
Chart on Global Market: Year-over-year growth 2025-2030 (%)
Data Table on Global Market: Year-over-year growth 2025-2030 (%)

5. Historic Market Size

5.1 Global 3D Automated Optical Inspection (AOI) Equipment Market 2020 - 2024

Historic Market Size - Data Table on Global 3D Automated Optical Inspection (AOI) Equipment Market 2020 - 2024 ($ million)

5.2 Distribution Channel segment analysis 2020 - 2024

Historic Market Size - Distribution Channel Segment 2020 - 2024 ($ million)

5.3 Technology segment analysis 2020 - 2024

Historic Market Size - Technology Segment 2020 - 2024 ($ million)

5.4 End-user segment analysis 2020 - 2024

Historic Market Size - End-user Segment 2020 - 2024 ($ million)

5.5 Geography segment analysis 2020 - 2024

Historic Market Size - Geography Segment 2020 - 2024 ($ million)

5.6 Country segment analysis 2020 - 2024

Historic Market Size - Country Segment 2020 - 2024 ($ million)

6. Qualitative Analysis

6.1 Impact of AI in global 3D automated optical inspection (AOI) equipment market

6.2 Impact of geopolitical conflict for global 3D automated optical inspection (AOI) equipment market

7. Five Forces Analysis

7.1 Five forces summary

Five forces analysis - Comparison between 2025 and 2030

7.2 Bargaining power of buyers

Bargaining power of buyers - Impact of key factors 2025 and 2030

7.3 Bargaining power of suppliers

Bargaining power of suppliers - Impact of key factors in 2025 and 2030

7.4 Threat of new entrants

Threat of new entrants - Impact of key factors in 2025 and 2030

7.5 Threat of substitutes

Threat of substitutes - Impact of key factors in 2025 and 2030

7.6 Threat of rivalry

Threat of rivalry - Impact of key factors in 2025 and 2030

7.7 Market condition

Chart on Market condition - Five forces 2025 and 2030

8. Market Segmentation by Distribution Channel

8.1 Market segments

Chart on Distribution Channel - Market share 2025-2030 (%)
Data Table on Distribution Channel - Market share 2025-2030 (%)

8.2 Comparison by Distribution Channel

Chart on Comparison by Distribution Channel
Data Table on Comparison by Distribution Channel

8.3 3D inline AOI - Market size and forecast 2025-2030

Chart on 3D inline AOI - Market size and forecast 2025-2030 ($ million)
Data Table on 3D inline AOI - Market size and forecast 2025-2030 ($ million)
Chart on 3D inline AOI - Year-over-year growth 2025-2030 (%)
Data Table on 3D inline AOI - Year-over-year growth 2025-2030 (%)

8.4 3D offline AOI - Market size and forecast 2025-2030

Chart on 3D offline AOI - Market size and forecast 2025-2030 ($ million)
Data Table on 3D offline AOI - Market size and forecast 2025-2030 ($ million)
Chart on 3D offline AOI - Year-over-year growth 2025-2030 (%)
Data Table on 3D offline AOI - Year-over-year growth 2025-2030 (%)

8.5 Market opportunity by Distribution Channel

Market opportunity by Distribution Channel ($ million)
Data Table on Market opportunity by Distribution Channel ($ million)

9. Market Segmentation by Technology

9.1 Market segments

Chart on Technology - Market share 2025-2030 (%)
Data Table on Technology - Market share 2025-2030 (%)

9.2 Comparison by Technology

Chart on Comparison by Technology
Data Table on Comparison by Technology

9.3 Confocal inspection - Market size and forecast 2025-2030

Chart on Confocal inspection - Market size and forecast 2025-2030 ($ million)
Data Table on Confocal inspection - Market size and forecast 2025-2030 ($ million)
Chart on Confocal inspection - Year-over-year growth 2025-2030 (%)
Data Table on Confocal inspection - Year-over-year growth 2025-2030 (%)

9.4 Structured light inspection - Market size and forecast 2025-2030

Chart on Structured light inspection - Market size and forecast 2025-2030 ($ million)
Data Table on Structured light inspection - Market size and forecast 2025-2030 ($ million)
Chart on Structured light inspection - Year-over-year growth 2025-2030 (%)
Data Table on Structured light inspection - Year-over-year growth 2025-2030 (%)

9.5 Laser inspection - Market size and forecast 2025-2030

Chart on Laser inspection - Market size and forecast 2025-2030 ($ million)
Data Table on Laser inspection - Market size and forecast 2025-2030 ($ million)
Chart on Laser inspection - Year-over-year growth 2025-2030 (%)
Data Table on Laser inspection - Year-over-year growth 2025-2030 (%)

9.6 Multi-directional inspection - Market size and forecast 2025-2030

Chart on Multi-directional inspection - Market size and forecast 2025-2030 ($ million)
Data Table on Multi-directional inspection - Market size and forecast 2025-2030 ($ million)
Chart on Multi-directional inspection - Year-over-year growth 2025-2030 (%)
Data Table on Multi-directional inspection - Year-over-year growth 2025-2030 (%)

9.7 Market opportunity by Technology

Market opportunity by Technology ($ million)
Data Table on Market opportunity by Technology ($ million)

10. Market Segmentation by End-user

10.1 Market segments

Chart on End-user - Market share 2025-2030 (%)
Data Table on End-user - Market share 2025-2030 (%)

10.2 Comparison by End-user

Chart on Comparison by End-user
Data Table on Comparison by End-user

10.3 Original equipment manufacturers - Market size and forecast 2025-2030

Chart on Original equipment manufacturers - Market size and forecast 2025-2030 ($ million)
Data Table on Original equipment manufacturers - Market size and forecast 2025-2030 ($ million)
Chart on Original equipment manufacturers - Year-over-year growth 2025-2030 (%)
Data Table on Original equipment manufacturers - Year-over-year growth 2025-2030 (%)

10.4 Contract manufacturers - Market size and forecast 2025-2030

Chart on Contract manufacturers - Market size and forecast 2025-2030 ($ million)
Data Table on Contract manufacturers - Market size and forecast 2025-2030 ($ million)
Chart on Contract manufacturers - Year-over-year growth 2025-2030 (%)
Data Table on Contract manufacturers - Year-over-year growth 2025-2030 (%)

10.5 Research and development institutions - Market size and forecast 2025-2030

Chart on Research and development institutions - Market size and forecast 2025-2030 ($ million)
Data Table on Research and development institutions - Market size and forecast 2025-2030 ($ million)
Chart on Research and development institutions - Year-over-year growth 2025-2030 (%)
Data Table on Research and development institutions - Year-over-year growth 2025-2030 (%)

10.6 Quality control laboratories - Market size and forecast 2025-2030

Chart on Quality control laboratories - Market size and forecast 2025-2030 ($ million)
Data Table on Quality control laboratories - Market size and forecast 2025-2030 ($ million)
Chart on Quality control laboratories - Year-over-year growth 2025-2030 (%)
Data Table on Quality control laboratories - Year-over-year growth 2025-2030 (%)

10.7 Market opportunity by End-user

Market opportunity by End-user ($ million)
Data Table on Market opportunity by End-user ($ million)

11. Customer Landscape

11.1 Customer landscape overview

Analysis of price sensitivity, lifecycle, customer purchase basket, adoption rates, and purchase criteria

12. Geographic Landscape

12.1 Geographic segmentation

Chart on Market share by geography 2025-2030 (%)
Data Table on Market share by geography 2025-2030 (%)

12.2 Geographic comparison

Chart on Geographic comparison
Data Table on Geographic comparison

12.3 APAC - Market size and forecast 2025-2030

Chart on APAC - Market size and forecast 2025-2030 ($ million)
Data Table on APAC - Market size and forecast 2025-2030 ($ million)
Chart on APAC - Year-over-year growth 2025-2030 (%)
Data Table on APAC - Year-over-year growth 2025-2030 (%)
Chart on Regional Comparison - APAC
Data Table on Regional Comparison - APAC

12.3.1 China - Market size and forecast 2025-2030

Chart on China - Market size and forecast 2025-2030 ($ million)
Data Table on China - Market size and forecast 2025-2030 ($ million)
Chart on China - Year-over-year growth 2025-2030 (%)
Data Table on China - Year-over-year growth 2025-2030 (%)

12.3.2 Japan - Market size and forecast 2025-2030

Chart on Japan - Market size and forecast 2025-2030 ($ million)
Data Table on Japan - Market size and forecast 2025-2030 ($ million)
Chart on Japan - Year-over-year growth 2025-2030 (%)
Data Table on Japan - Year-over-year growth 2025-2030 (%)

12.3.3 South Korea - Market size and forecast 2025-2030

Chart on South Korea - Market size and forecast 2025-2030 ($ million)
Data Table on South Korea - Market size and forecast 2025-2030 ($ million)
Chart on South Korea - Year-over-year growth 2025-2030 (%)
Data Table on South Korea - Year-over-year growth 2025-2030 (%)

12.3.4 India - Market size and forecast 2025-2030

Chart on India - Market size and forecast 2025-2030 ($ million)
Data Table on India - Market size and forecast 2025-2030 ($ million)
Chart on India - Year-over-year growth 2025-2030 (%)
Data Table on India - Year-over-year growth 2025-2030 (%)

12.3.5 Australia - Market size and forecast 2025-2030

Chart on Australia - Market size and forecast 2025-2030 ($ million)
Data Table on Australia - Market size and forecast 2025-2030 ($ million)
Chart on Australia - Year-over-year growth 2025-2030 (%)
Data Table on Australia - Year-over-year growth 2025-2030 (%)

12.3.6 Indonesia - Market size and forecast 2025-2030

Chart on Indonesia - Market size and forecast 2025-2030 ($ million)
Data Table on Indonesia - Market size and forecast 2025-2030 ($ million)
Chart on Indonesia - Year-over-year growth 2025-2030 (%)
Data Table on Indonesia - Year-over-year growth 2025-2030 (%)

12.4 North America - Market size and forecast 2025-2030

Chart on North America - Market size and forecast 2025-2030 ($ million)
Data Table on North America - Market size and forecast 2025-2030 ($ million)
Chart on North America - Year-over-year growth 2025-2030 (%)
Data Table on North America - Year-over-year growth 2025-2030 (%)
Chart on Regional Comparison - North America
Data Table on Regional Comparison - North America

12.4.1 US - Market size and forecast 2025-2030

Chart on US - Market size and forecast 2025-2030 ($ million)
Data Table on US - Market size and forecast 2025-2030 ($ million)
Chart on US - Year-over-year growth 2025-2030 (%)
Data Table on US - Year-over-year growth 2025-2030 (%)

12.4.2 Canada - Market size and forecast 2025-2030

Chart on Canada - Market size and forecast 2025-2030 ($ million)
Data Table on Canada - Market size and forecast 2025-2030 ($ million)
Chart on Canada - Year-over-year growth 2025-2030 (%)
Data Table on Canada - Year-over-year growth 2025-2030 (%)

12.4.3 Mexico - Market size and forecast 2025-2030

Chart on Mexico - Market size and forecast 2025-2030 ($ million)
Data Table on Mexico - Market size and forecast 2025-2030 ($ million)
Chart on Mexico - Year-over-year growth 2025-2030 (%)
Data Table on Mexico - Year-over-year growth 2025-2030 (%)

12.5 Europe - Market size and forecast 2025-2030

Chart on Europe - Market size and forecast 2025-2030 ($ million)
Data Table on Europe - Market size and forecast 2025-2030 ($ million)
Chart on Europe - Year-over-year growth 2025-2030 (%)
Data Table on Europe - Year-over-year growth 2025-2030 (%)
Chart on Regional Comparison - Europe
Data Table on Regional Comparison - Europe

12.5.1 Germany - Market size and forecast 2025-2030

Chart on Germany - Market size and forecast 2025-2030 ($ million)
Data Table on Germany - Market size and forecast 2025-2030 ($ million)
Chart on Germany - Year-over-year growth 2025-2030 (%)
Data Table on Germany - Year-over-year growth 2025-2030 (%)

12.5.2 UK - Market size and forecast 2025-2030

Chart on UK - Market size and forecast 2025-2030 ($ million)
Data Table on UK - Market size and forecast 2025-2030 ($ million)
Chart on UK - Year-over-year growth 2025-2030 (%)
Data Table on UK - Year-over-year growth 2025-2030 (%)

12.5.3 France - Market size and forecast 2025-2030

Chart on France - Market size and forecast 2025-2030 ($ million)
Data Table on France - Market size and forecast 2025-2030 ($ million)
Chart on France - Year-over-year growth 2025-2030 (%)
Data Table on France - Year-over-year growth 2025-2030 (%)

12.5.4 Italy - Market size and forecast 2025-2030

Chart on Italy - Market size and forecast 2025-2030 ($ million)
Data Table on Italy - Market size and forecast 2025-2030 ($ million)
Chart on Italy - Year-over-year growth 2025-2030 (%)
Data Table on Italy - Year-over-year growth 2025-2030 (%)

12.5.5 Spain - Market size and forecast 2025-2030

Chart on Spain - Market size and forecast 2025-2030 ($ million)
Data Table on Spain - Market size and forecast 2025-2030 ($ million)
Chart on Spain - Year-over-year growth 2025-2030 (%)
Data Table on Spain - Year-over-year growth 2025-2030 (%)

12.5.6 The Netherlands - Market size and forecast 2025-2030

Chart on The Netherlands - Market size and forecast 2025-2030 ($ million)
Data Table on The Netherlands - Market size and forecast 2025-2030 ($ million)
Chart on The Netherlands - Year-over-year growth 2025-2030 (%)
Data Table on The Netherlands - Year-over-year growth 2025-2030 (%)

12.6 South America - Market size and forecast 2025-2030

Chart on South America - Market size and forecast 2025-2030 ($ million)
Data Table on South America - Market size and forecast 2025-2030 ($ million)
Chart on South America - Year-over-year growth 2025-2030 (%)
Data Table on South America - Year-over-year growth 2025-2030 (%)
Chart on Regional Comparison - South America
Data Table on Regional Comparison - South America

12.6.1 Brazil - Market size and forecast 2025-2030

Chart on Brazil - Market size and forecast 2025-2030 ($ million)
Data Table on Brazil - Market size and forecast 2025-2030 ($ million)
Chart on Brazil - Year-over-year growth 2025-2030 (%)
Data Table on Brazil - Year-over-year growth 2025-2030 (%)

12.6.2 Argentina - Market size and forecast 2025-2030

Chart on Argentina - Market size and forecast 2025-2030 ($ million)
Data Table on Argentina - Market size and forecast 2025-2030 ($ million)
Chart on Argentina - Year-over-year growth 2025-2030 (%)
Data Table on Argentina - Year-over-year growth 2025-2030 (%)

12.6.3 Chile - Market size and forecast 2025-2030

Chart on Chile - Market size and forecast 2025-2030 ($ million)
Data Table on Chile - Market size and forecast 2025-2030 ($ million)
Chart on Chile - Year-over-year growth 2025-2030 (%)
Data Table on Chile - Year-over-year growth 2025-2030 (%)

12.7 Middle East and Africa - Market size and forecast 2025-2030

Chart on Middle East and Africa - Market size and forecast 2025-2030 ($ million)
Data Table on Middle East and Africa - Market size and forecast 2025-2030 ($ million)
Chart on Middle East and Africa - Year-over-year growth 2025-2030 (%)
Data Table on Middle East and Africa - Year-over-year growth 2025-2030 (%)
Chart on Regional Comparison - Middle East and Africa
Data Table on Regional Comparison - Middle East and Africa

12.7.1 Saudi Arabia - Market size and forecast 2025-2030

Chart on Saudi Arabia - Market size and forecast 2025-2030 ($ million)
Data Table on Saudi Arabia - Market size and forecast 2025-2030 ($ million)
Chart on Saudi Arabia - Year-over-year growth 2025-2030 (%)
Data Table on Saudi Arabia - Year-over-year growth 2025-2030 (%)

12.7.2 UAE - Market size and forecast 2025-2030

Chart on UAE - Market size and forecast 2025-2030 ($ million)
Data Table on UAE - Market size and forecast 2025-2030 ($ million)
Chart on UAE - Year-over-year growth 2025-2030 (%)
Data Table on UAE - Year-over-year growth 2025-2030 (%)

12.7.3 South Africa - Market size and forecast 2025-2030

Chart on South Africa - Market size and forecast 2025-2030 ($ million)
Data Table on South Africa - Market size and forecast 2025-2030 ($ million)
Chart on South Africa - Year-over-year growth 2025-2030 (%)
Data Table on South Africa - Year-over-year growth 2025-2030 (%)

12.7.4 Israel - Market size and forecast 2025-2030

Chart on Israel - Market size and forecast 2025-2030 ($ million)
Data Table on Israel - Market size and forecast 2025-2030 ($ million)
Chart on Israel - Year-over-year growth 2025-2030 (%)
Data Table on Israel - Year-over-year growth 2025-2030 (%)

12.7.5 Turkey - Market size and forecast 2025-2030

Chart on Turkey - Market size and forecast 2025-2030 ($ million)
Data Table on Turkey - Market size and forecast 2025-2030 ($ million)
Chart on Turkey - Year-over-year growth 2025-2030 (%)
Data Table on Turkey - Year-over-year growth 2025-2030 (%)

12.8 Market opportunity by geography

Market opportunity by geography ($ million)
Data Tables on Market opportunity by geography ($ million)

13. Drivers, Challenges, and Opportunity

13.1 Market drivers

Accelerating complexity in electronic component miniaturization
Proliferation of Industry 4.0 and smart factory integration
Increasing quality mandates in automotive and EV sectors

13.2 Market challenges

High initial capital expenditure and total cost of ownership
Acute shortage of skilled programming and technical personnel
Complexity of multi modal data integration and false call management

13.3 Impact of drivers and challenges

Impact of drivers and challenges in 2025 and 2030

13.4 Market opportunities

Integration of AI driven autonomous programming and defect classification
Convergence of multi modal inspection and smart factory connectivity
Expansion into specialized semiconductor packaging and advanced metrology

14. Competitive Landscape

14.1 Overview

14.2

Overview on criticality of inputs and factors of differentiation

14.3 Landscape disruption

Overview on factors of disruption

14.4 Industry risks

Impact of key risks on business

15. Competitive Analysis

15.1 Companies profiled

Companies covered

15.2 Company ranking index

15.3 Market positioning of companies

Matrix on companies position and classification

15.4 Camtek Ltd.

Camtek Ltd. - Overview
Camtek Ltd. - Product / Service
Camtek Ltd. - Key offerings
SWOT

15.5 GOPEL electronic GmbH

GOPEL electronic GmbH - Overview
GOPEL electronic GmbH - Product / Service
GOPEL electronic GmbH - Key offerings
SWOT

15.6 KLA Corp.

KLA Corp. - Overview
KLA Corp. - Business segments
KLA Corp. - Key offerings
KLA Corp. - Segment focus
SWOT

15.7 Koh Young Technology Inc.

Koh Young Technology Inc. - Overview
Koh Young Technology Inc. - Product / Service
Koh Young Technology Inc. - Key offerings
SWOT

15.8 Mirtec Co. Ltd.

Mirtec Co. Ltd. - Overview
Mirtec Co. Ltd. - Product / Service
Mirtec Co. Ltd. - Key offerings
SWOT

15.9 Mycronic AB

Mycronic AB - Overview
Mycronic AB - Business segments
Mycronic AB - Key offerings
Mycronic AB - Segment focus
SWOT

15.10 Nordson Corp.

Nordson Corp. - Overview
Nordson Corp. - Business segments
Nordson Corp. - Key offerings
Nordson Corp. - Segment focus
SWOT

15.11 OMRON Corp.

OMRON Corp. - Overview
OMRON Corp. - Business segments
OMRON Corp. - Key offerings
OMRON Corp. - Segment focus
SWOT

15.12 PARMI Co. Ltd.

PARMI Co. Ltd. - Overview
PARMI Co. Ltd. - Product / Service
PARMI Co. Ltd. - Key offerings
SWOT

15.13 Saki Corp.

Saki Corp. - Overview
Saki Corp. - Product / Service
Saki Corp. - Key offerings
SWOT

15.14 Stratus Vision GmbH

Stratus Vision GmbH - Overview
Stratus Vision GmbH - Product / Service
Stratus Vision GmbH - Key offerings
SWOT

15.15 Viscom AG

Viscom AG - Overview
Viscom AG - Product / Service
Viscom AG - Key offerings
SWOT

15.16 Visionx Inc.

Visionx Inc. - Overview
Visionx Inc. - Product / Service
Visionx Inc. - Key offerings
SWOT

15.17 ViTrox Corp. Berhad

ViTrox Corp. Berhad - Overview
ViTrox Corp. Berhad - Product / Service
ViTrox Corp. Berhad - Key offerings
SWOT

15.18 Yamaha Motor Co. Ltd.

Yamaha Motor Co. Ltd. - Overview
Yamaha Motor Co. Ltd. - Business segments
Yamaha Motor Co. Ltd. - Key offerings
Yamaha Motor Co. Ltd. - Segment focus
SWOT

16. Appendix

16.1 Scope of the report

Market definition
Objectives
Notes and caveats

16.2 Inclusions and exclusions checklist

Inclusions checklist
Exclusions checklist

16.3 Currency conversion rates for US$

16.4 Research methodology

16.5 Data procurement

Information sources

16.6 Data validation

16.7 Validation techniques employed for market sizing

16.8 Data synthesis

16.9 360 degree market analysis

16.10 List of abbreviations

Research Methodology

Technavio presents a detailed picture of the market by way of study, synthesis, and summation of data from multiple sources. The analysts have presented the various facets of the market with a particular focus on identifying the key industry influencers. The data thus presented is comprehensive, reliable, and the result of extensive research, both primary and secondary.

INFORMATION SOURCES

Primary sources

  • Manufacturers and suppliers
  • Channel partners
  • Industry experts
  • Strategic decision makers

Secondary sources

  • Industry journals and periodicals
  • Government data
  • Financial reports of key industry players
  • Historical data
  • Press releases

DATA ANALYSIS

Data Synthesis

  • Collation of data
  • Estimation of key figures
  • Analysis of derived insights

Data Validation

  • Triangulation with data models
  • Reference against proprietary databases
  • Corroboration with industry experts

REPORT WRITING

Qualitative

  • Market drivers
  • Market challenges
  • Market trends
  • Five forces analysis

Quantitative

  • Market size and forecast
  • Market segmentation
  • Geographical insights
  • Competitive landscape

Interested in this report?

Get your sample now to see our research methodology and insights!

Download Now

Frequently Asked Questions

3D Automated Optical Inspection (AOI) Equipment market growth will increase by USD 2605.7 million during 2026-2030.

The 3D Automated Optical Inspection (AOI) Equipment market is expected to grow at a CAGR of 44.2% during 2026-2030.

3D Automated Optical Inspection (AOI) Equipment market is segmented by Distribution channel (3D inline AOI, 3D offline AOI) Technology (Confocal inspection, Structured light inspection, Laser inspection, Multi-directional inspection) End-user (Original equipment manufacturers, Contract manufacturers, Research and development institutions, Quality control laboratories)

Shenzhen Zhenhuaxing Intelligent, Camtek Ltd., GOPEL electronic GmbH, KLA Corp., Koh Young Technology Inc., MEK Europe BV, Mirtec Co. Ltd., Mycronic AB, NANOTRONICS IMAGING INC., Nordson Corp., OMRON Corp., PARMI Co. Ltd., Saki Corp., Stratus Vision GmbH, Viscom AG, Machine Vision Products Inc., Visionx Inc., ViTrox Corp. Berhad, Yamaha Motor Co. Ltd. are a few of the key vendors in the 3D Automated Optical Inspection (AOI) Equipment market.

APAC will register the highest growth rate of 64.2% among the other regions. Therefore, the 3D Automated Optical Inspection (AOI) Equipment market in APAC is expected to garner significant business opportunities for the vendors during the forecast period.

China, Japan, South Korea, India, Australia, Indonesia, US, Canada, Mexico, Germany, UK, France, Italy, Spain, The Netherlands, Brazil, Argentina, Chile, Saudi Arabia, UAE, South Africa, Israel, Turkey

  • Accelerating complexity in electronic component miniaturization is the driving factor this market.

The 3D Automated Optical Inspection (AOI) Equipment market vendors should focus on grabbing business opportunities from the Distribution channel segment as it accounted for the largest market share in the base year.
RIA - Research AI Assistant
Ask RIA