3D Mapping And Modeling Market Analysis, Size, and Forecast 2026-2030: North America (US, Canada, and Mexico), APAC (China, Japan, and India), Europe (Germany, UK, and France), Middle East and Africa (UAE, Saudi Arabia, and South Africa), South America (Brazil and Argentina), and Rest of World (ROW)

3D Mapping And Modeling Market Analysis, Size, and Forecast 2026-2030:
North America (US, Canada, and Mexico), APAC (China, Japan, and India), Europe (Germany, UK, and France), Middle East and Africa (UAE, Saudi Arabia, and South Africa), South America (Brazil and Argentina), and Rest of World (ROW)

Published: Mar 2026 293 Pages SKU: IRTNTR75125

Market Overview at a Glance

$2.95 B
Market Opportunity
6.1%
CAGR 2025 - 2030
36%
North America Growth
$5.81 B
3D modeling segment 2024

3D Mapping And Modeling Market Size 2026-2030

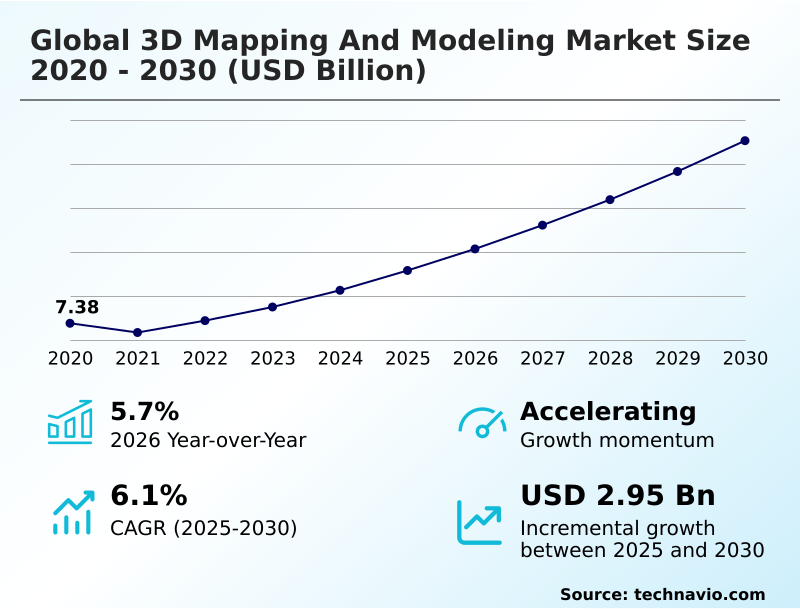
The 3d mapping and modeling market size is valued to increase by USD 2.95 billion, at a CAGR of 6.1% from 2025 to 2030. Technological convergence and AI-driven automation will drive the 3d mapping and modeling market.

Major Market Trends & Insights

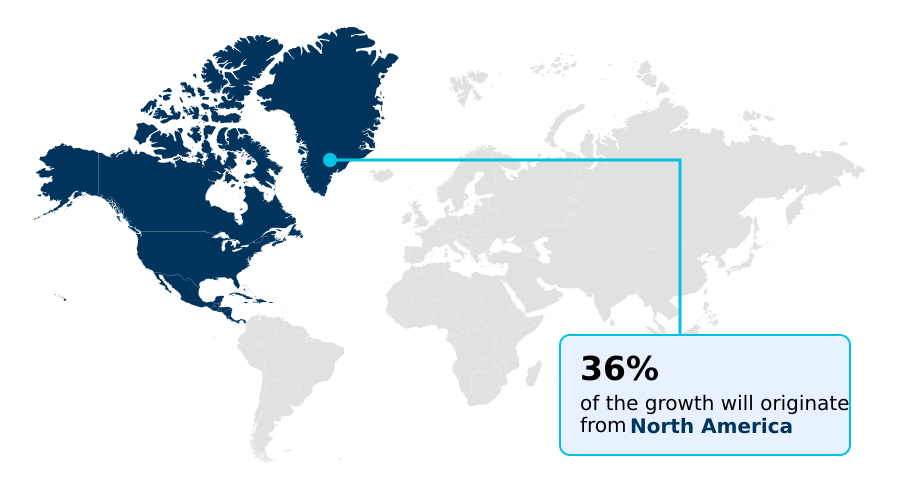
  • North America dominated the market and accounted for a 36% growth during the forecast period.
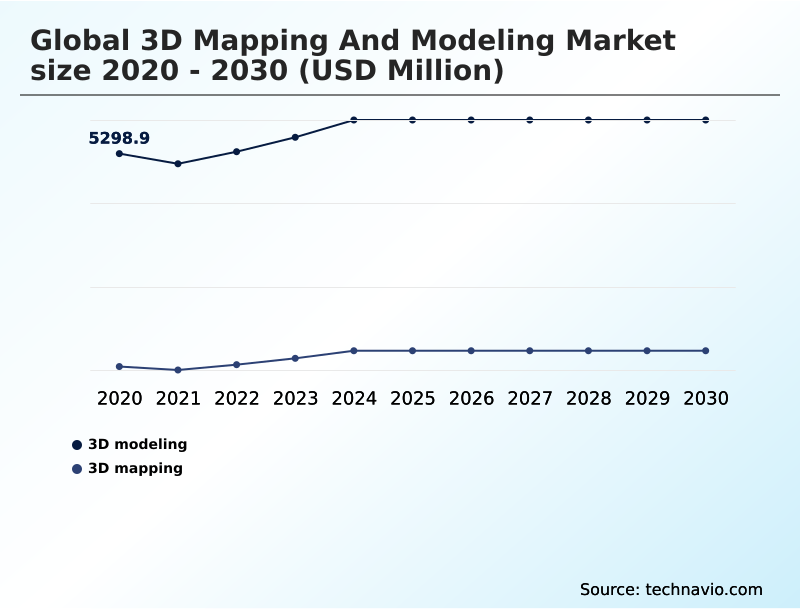
  • By Product Type - 3D modeling segment was valued at USD 5.81 billion in 2024
  • By Component - Software segment accounted for the largest market revenue share in 2024

Market Size & Forecast

  • Market Opportunities: USD 4.15 billion
  • Market Future Opportunities: USD 2.95 billion
  • CAGR from 2025 to 2030 : 6.1%

Market Summary

  • The 3D mapping and modeling market is undergoing a rapid transformation, shifting from static representations to dynamic, intelligent digital environments. The convergence of geospatial technologies with AI is a primary driver, automating complex workflows like point cloud classification and feature extraction from high-fidelity spatial data. This allows for the creation of semantic digital twins with unprecedented speed.
  • A key trend is the adoption of physics-based simulations within these digital twins, especially in industrial settings, enabling predictive analysis for asset management. For example, a utility company can use a radio frequency digital twin to optimize its network infrastructure, simulating signal propagation to identify and mitigate potential coverage gaps before committing to costly physical deployments.
  • However, the market faces challenges related to the immense computational power and GPU architectures required for processing petabyte-scale datasets generated by LiDAR and photogrammetry, which can be a barrier for smaller enterprises. The evolution toward cloud-native platforms is helping to democratize access, but the technical expertise needed to manage these systems remains a significant consideration for market-wide adoption.

What will be the Size of the 3D Mapping And Modeling Market during the forecast period?

Get Key Insights on Market Forecast (PDF) Request Free Sample

How is the 3D Mapping And Modeling Market Segmented?

The 3d mapping and modeling industry research report provides comprehensive data (region-wise segment analysis), with forecasts and estimates in "USD million" for the period 2026-2030, as well as historical data from 2020-2024 for the following segments.

  • Product type
    • 3D modeling
    • 3D mapping
  • Component
    • Software
    • Services
  • Technology
    • LiDAR
    • Photogrammetry
    • SLAM
    • Others
  • Geography
    • North America
      • US
      • Canada
      • Mexico
    • APAC
      • China
      • Japan
      • India
    • Europe
      • Germany
      • UK
      • France
    • Middle East and Africa
      • UAE
      • Saudi Arabia
      • South Africa
    • South America
      • Brazil
      • Argentina
    • Rest of World (ROW)

By Product Type Insights

The 3d modeling segment is estimated to witness significant growth during the forecast period.

The 3D modeling segment is driven by the industrial imperative to create high-fidelity representations for simulation and product design.

The shift toward generative design and parametric design enables the creation of optimized components, while the media sector leverages procedural generation for complex virtual worlds.

AI-assisted modeling is transforming workflows in computer-aided design (CAD) by automating repetitive tasks like volumetric modeling and texture mapping, facilitating efficient 3D asset creation.

This integration of machine learning directly into modeling pipelines enhances precision and operational speed, with some platforms reporting a reduction in loading times for complex semantic digital twins by up to 40 times, accelerating the path from concept to production-ready asset.

Request Free Sample

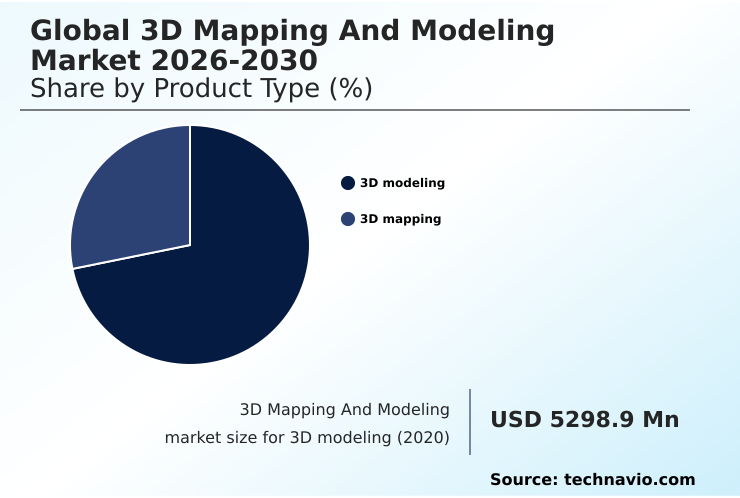
The 3D modeling segment was valued at USD 5.81 billion in 2024 and showed a gradual increase during the forecast period.

Request Free Sample

Regional Analysis

North America is estimated to contribute 36% to the growth of the global market during the forecast period.Technavio’s analysts have elaborately explained the regional trends and drivers that shape the market during the forecast period.

See How 3D Mapping And Modeling Market Demand is Rising in North America Request Free Sample

The geographic landscape of the 3D mapping and modeling market is led by North America, which accounts for approximately 36% of the market's incremental growth, driven by extensive investment in smart city platforms and infrastructure renewal.

The use of airborne LiDAR for large-scale topographic surveys and mobile mapping systems for digital construction is widespread.

In contrast, the APAC region is projected to exhibit the fastest expansion, with a growth rate nearly 5% higher than Europe's, fueled by rapid urbanization and government initiatives.

In North America, the integration of building information modeling (BIM) with geographic information systems (GIS) is standard practice.

Advanced applications like hydrographic missions and environmental monitoring benefit from technologies providing direct georeferencing, which improves data accuracy and accelerates 3D GIS visualization workflows.

Market Dynamics

Our researchers analyzed the data with 2025 as the base year, along with the key drivers, trends, and challenges. A holistic analysis of drivers will help companies refine their marketing strategies to gain a competitive advantage.

  • Strategic decision-making in the industry often begins with evaluating LiDAR vs photogrammetry for terrain mapping, where the choice depends on project requirements for accuracy and vegetation penetration. For indoor environments, using SLAM for indoor 3D modeling has become a cost-effective method.
  • Architects and designers seek the best software for 3D architectural visualization to create compelling presentations, often involving real-time rendering for 3D architectural walkthroughs. A significant trend is creating digital twins for industrial facilities, which enables using 3D models for predictive maintenance and operational optimization. This is accelerated by understanding how AI is automating 3D model generation from raw sensor data.
  • Concurrently, the automotive sector's focus on 3D mapping for autonomous vehicle navigation is driving innovation in high-definition map creation. In urban development, integrating BIM and GIS for urban planning has proven highly effective, with projects adopting this integrated approach reporting a reduction in planning conflicts by over 20% compared to siloed methods.
  • However, practitioners face the challenges of processing large point cloud data, making cloud platforms for streaming 3D geospatial data essential. The future lies in enhancing physics-based simulation in digital twins and improving geospatial intelligence for infrastructure management.
  • Other key areas include managing the cost of implementing airborne LiDAR surveys, expanding applications of 3D mapping in defense, and leveraging generative design for lightweight component manufacturing. Even virtual entertainment is impacted, with procedural generation for virtual world creation becoming more sophisticated.
  • Finally, 3D mapping solutions for utility companies, semantic segmentation of 3D point clouds, and the advancements in solid-state LiDAR technology continue to reshape the market's capabilities.

What are the key market drivers leading to the rise in the adoption of 3D Mapping And Modeling Industry?

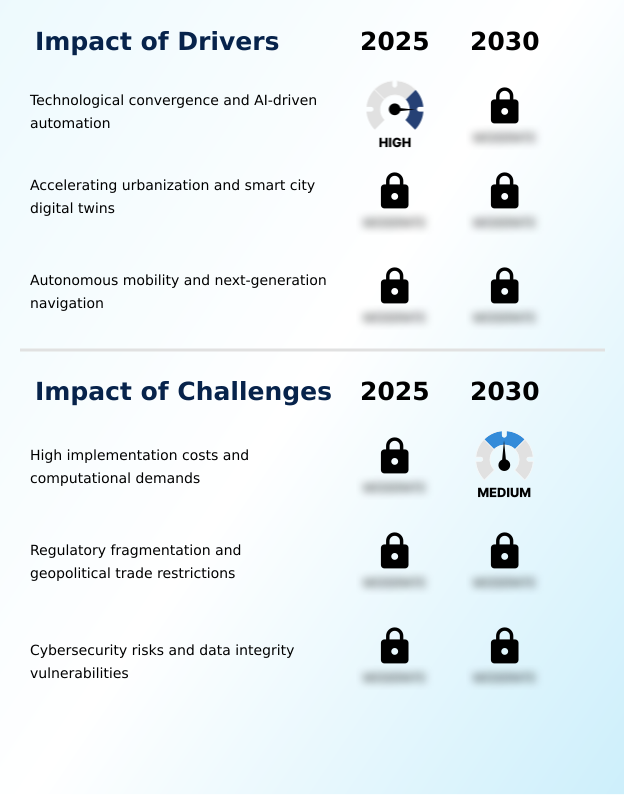
  • Technological convergence and AI-driven automation are the key drivers propelling market growth.

  • The convergence of geospatial technologies and AI-driven automation is a primary market driver, fundamentally altering the economics of content creation.
  • The use of computer vision and AI-assisted modeling automates complex tasks such as feature extraction and point cloud classification, with some systems achieving over 95% accuracy in identifying infrastructure components from aerial data.
  • This automation, powered by advanced LiDAR data processing and photogrammetry software, significantly reduces the manual effort required. This democratization of tools enables more firms to engage in sophisticated geospatial data analytics for applications like asset portfolio management.
  • By automating workflows, companies can reduce project turnaround times by half, broadening market access and stimulating demand across new sectors.

What are the market trends shaping the 3D Mapping And Modeling Industry?

  • The operationalization of the industrial metaverse represents a key market trend. This is driven by the adoption of physics-based digital twins for high-fidelity simulation and predictive analysis.

  • A dominant trend is the operationalization of the industrial metaverse through physics-based simulations embedded within digital twins. This moves beyond simple visualization to active simulation, where high-fidelity spatial data representing as-built conditions is used for multi-physics simulations.
  • This digital twin creation enables engineers to test complex scenarios in virtual reality environments, identifying potential design flaws that can reduce downstream engineering changes by up to 15%. Furthermore, integrating real-time sensor data allows for predictive maintenance, which has been shown to decrease critical asset downtime by over 20%.
  • This capability is also crucial for disaster response planning, allowing organizations to simulate impacts and formulate effective mitigation strategies.

What challenges does the 3D Mapping And Modeling Industry face during its growth?

  • High implementation costs and significant computational demands present a key challenge affecting industry growth.

  • A primary challenge is the prohibitive cost and complexity of managing high-fidelity spatial data. The data acquisition phase, requiring expensive mobile mapping systems or airborne LiDAR surveys, can account for up to 40% of a project's total budget. Processing the resulting petabyte-scale datasets for applications like large-scale urban visualization or detailed infrastructure design necessitates significant investment in high-performance GPU architectures.
  • While cloud-native platforms offer a scalable alternative, the associated subscription and data transfer costs can be substantial. This computational barrier limits widespread adoption, as creating a detailed 3D surface modeling of a single large asset can generate terabytes of data, requiring specialized expertise and infrastructure that remains out of reach for many smaller organizations.

Exclusive Technavio Analysis on Customer Landscape

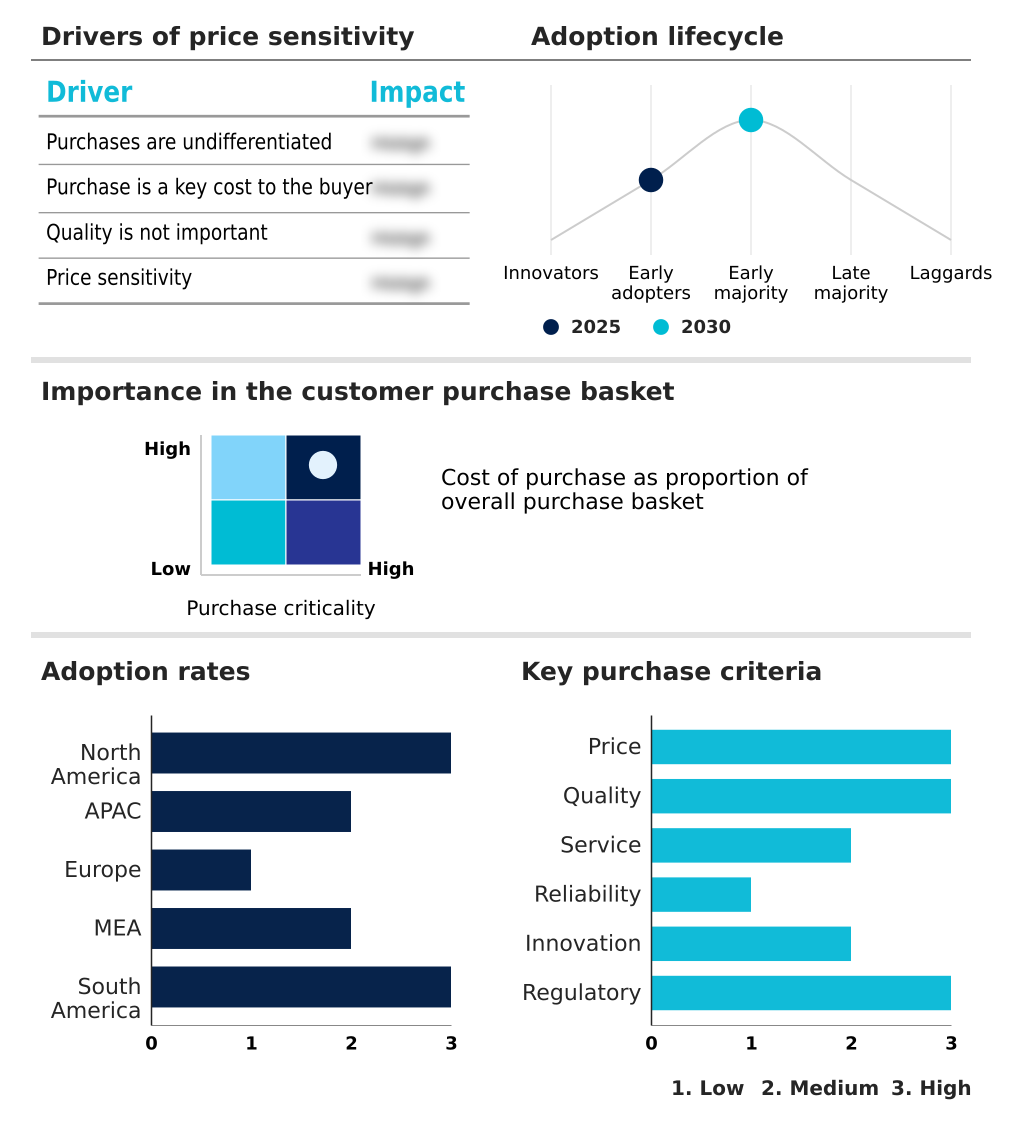
The 3d mapping and modeling market forecasting report includes the adoption lifecycle of the market, covering from the innovator’s stage to the laggard’s stage. It focuses on adoption rates in different regions based on penetration. Furthermore, the 3d mapping and modeling market report also includes key purchase criteria and drivers of price sensitivity to help companies evaluate and develop their market growth analysis strategies.

Customer Landscape of 3D Mapping And Modeling Industry

Competitive Landscape

Companies are implementing various strategies, such as strategic alliances, 3d mapping and modeling market forecast, partnerships, mergers and acquisitions, geographical expansion, and product/service launches, to enhance their presence in the industry.

Adobe Inc. - Provides advanced solutions for creating detailed 3D assets, catering to creative and industrial design applications through innovative modeling software.

The industry research and growth report includes detailed analyses of the competitive landscape of the market and information about key companies, including:

  • Adobe Inc.
  • Airbus SE
  • Autodesk Inc.
  • Bentley Systems Inc.
  • Blue Marble Geographics
  • Cesium GS
  • CyberCity 3D Inc.
  • Dassault Systemes SE
  • Esri Global Inc.
  • Golden Software LLC
  • Intermap Technologies Corp.
  • Mapbox Inc.
  • Matterport Inc.
  • Maxon Computer GmbH
  • Pix4D SA
  • Saab AB
  • The Foundry Visionmongers Ltd.
  • Topcon Positioning Systems Inc.
  • Trimble Inc.

Qualitative and quantitative analysis of companies has been conducted to help clients understand the wider business environment as well as the strengths and weaknesses of key industry players. Data is qualitatively analyzed to categorize companies as pure play, category-focused, industry-focused, and diversified; it is quantitatively analyzed to categorize companies as dominant, leading, strong, tentative, and weak.

Recent Development and News in 3d mapping and modeling market

  • In March, 2025, Esri announced a strategic collaboration with Google Maps Platform, integrating Photorealistic 3D Tiles into its ArcGIS system to provide users with accessible, global-scale 3D context for geospatial analysis.
  • In March, 2025, NVIDIA unveiled its Omniverse Blueprint for Real-Time Digital Twins at the GTC conference, providing a platform engineered for designing and operating AI factories and industrial facilities using multi-physics simulations.
  • In February, 2025, Vexcel Data Program announced the completion of its Urban Ultra collection initiative, capturing ultra-high-resolution oblique and nadir imagery across the top 100 metropolitan areas in the United States and Canada.
  • In February, 2025, CoStar Group completed its acquisition of Matterport, combining digital twin technology with extensive real estate analytics platforms to accelerate the digitization of the built world.

Dive into Technavio’s robust research methodology, blending expert interviews, extensive data synthesis, and validated models for unparalleled 3D Mapping And Modeling Market insights. See full methodology.

Market Scope
Page number 293
Base year 2025
Historic period 2020-2024
Forecast period 2026-2030
Growth momentum & CAGR Accelerate at a CAGR of 6.1%
Market growth 2026-2030 USD 2947.8 million
Market structure Fragmented
YoY growth 2025-2026(%) 5.7%
Key countries US, Canada, Mexico, China, Japan, India, South Korea, Australia, Indonesia, Germany, UK, France, Italy, Spain, The Netherlands, UAE, Saudi Arabia, South Africa, Israel, Turkey, Brazil, Argentina and Chile
Competitive landscape Leading Companies, Market Positioning of Companies, Competitive Strategies, and Industry Risks

Request Free Sample

Research Analyst Overview

  • The 3D mapping and modeling market is defined by the ongoing integration of geospatial technologies with advanced computer vision and AI-assisted modeling. Core technologies like LiDAR, photogrammetry, and SLAM are no longer standalone but are part of a connected workflow for reality capture and digital twins creation.
  • The rise of neural radiance fields and gaussian splatting enables the generation of highly realistic scenes, while remote sensing software automates feature extraction and point cloud classification. This push toward automation, which has been shown to reduce data processing times by over 30%, directly impacts boardroom decisions regarding capital expenditure on GPU architectures and cloud-native platforms.
  • The ability to create semantic digital twins and run physics-based simulations, including multi-physics simulations and even a radio frequency digital twin, requires significant investment. This shift forces leadership to balance the high cost of implementation against the long-term ROI from enhanced design and operational efficiency in computer-aided design, building information modeling, and geographic information systems.

What are the Key Data Covered in this 3D Mapping And Modeling Market Research and Growth Report?

  • What is the expected growth of the 3D Mapping And Modeling Market between 2026 and 2030?

    • USD 2.95 billion, at a CAGR of 6.1%

  • What segmentation does the market report cover?

    • The report is segmented by Product Type (3D modeling, and 3D mapping), Component (Software, and Services), Technology (LiDAR, Photogrammetry, SLAM, and Others) and Geography (North America, APAC, Europe, Middle East and Africa, South America)

  • Which regions are analyzed in the report?

    • North America, APAC, Europe, Middle East and Africa and South America

  • What are the key growth drivers and market challenges?

    • Technological convergence and AI-driven automation, High implementation costs and computational demands

  • Who are the major players in the 3D Mapping And Modeling Market?

    • Adobe Inc., Airbus SE, Autodesk Inc., Bentley Systems Inc., Blue Marble Geographics, Cesium GS, CyberCity 3D Inc., Dassault Systemes SE, Esri Global Inc., Golden Software LLC, Intermap Technologies Corp., Mapbox Inc., Matterport Inc., Maxon Computer GmbH, Pix4D SA, Saab AB, The Foundry Visionmongers Ltd., Topcon Positioning Systems Inc. and Trimble Inc.

Market Research Insights

  • The 3D mapping and modeling market is pivotal for modern infrastructure design and urban planning. The use of digital twin creation for digital construction is becoming standard, enabling clash detection that reduces costly rework by up to 15%. Solutions for real-time 3D mapping and autonomous navigation maps are advancing rapidly.
  • In asset portfolio management, firms leveraging detailed 3D city models report enhanced accuracy in structural integrity assessment. This shift toward data-driven decision-making is powered by geospatial data analytics and advanced reality capture solutions.
  • Moreover, workflow optimizations through AI-assisted tools have demonstrated the ability to reduce project modeling times by nearly half, allowing for more agile development cycles in creating virtual reality environments and augmented reality overlays.

We can help! Our analysts can customize this 3d mapping and modeling market research report to meet your requirements.

Get in touch

1. Executive Summary

1.1 Market overview

Executive Summary - Chart on Market Overview
Executive Summary - Data Table on Market Overview
Executive Summary - Chart on Global Market Characteristics
Executive Summary - Chart on Market by Geography
Executive Summary - Chart on Market Segmentation by Product Type
Executive Summary - Chart on Market Segmentation by Component
Executive Summary - Chart on Market Segmentation by Technology
Executive Summary - Chart on Incremental Growth
Executive Summary - Data Table on Incremental Growth
Executive Summary - Chart on Company Market Positioning

2. Technavio Analysis

2.1 Analysis of price sensitivity, lifecycle, customer purchase basket, adoption rates, and purchase criteria

2.2 Criticality of inputs and Factors of differentiation

Chart on Overview on criticality of inputs and factors of differentiation

2.3 Factors of disruption

Chart on Overview on factors of disruption

2.4 Impact of drivers and challenges

Chart on Impact of drivers and challenges in 2025 and 2030

3. Market Landscape

3.1 Market ecosystem

Chart on Parent Market
Data Table on - Parent Market

3.2 Market characteristics

Chart on Market characteristics analysis

3.3 Value chain analysis

Chart on Value chain analysis

4. Market Sizing

4.1 Market definition

Data Table on Offerings of companies included in the market definition

4.2 Market segment analysis

Market segments

4.3 Market size 2025

4.4 Market outlook: Forecast for 2025-2030

Chart on Global - Market size and forecast 2025-2030 ($ million)
Data Table on Global - Market size and forecast 2025-2030 ($ million)
Chart on Global Market: Year-over-year growth 2025-2030 (%)
Data Table on Global Market: Year-over-year growth 2025-2030 (%)

5. Historic Market Size

5.1 Global 3D Mapping And Modeling Market 2020 - 2024

Historic Market Size - Data Table on Global 3D Mapping And Modeling Market 2020 - 2024 ($ million)

5.2 Product Type segment analysis 2020 - 2024

Historic Market Size - Product Type Segment 2020 - 2024 ($ million)

5.3 Component segment analysis 2020 - 2024

Historic Market Size - Component Segment 2020 - 2024 ($ million)

5.4 Technology segment analysis 2020 - 2024

Historic Market Size - Technology Segment 2020 - 2024 ($ million)

5.5 Geography segment analysis 2020 - 2024

Historic Market Size - Geography Segment 2020 - 2024 ($ million)

5.6 Country segment analysis 2020 - 2024

Historic Market Size - Country Segment 2020 - 2024 ($ million)

6. Qualitative Analysis

6.1 Impact of AI on Global 3D Mapping and Modeling Market

7. Five Forces Analysis

7.1 Five forces summary

Five forces analysis - Comparison between 2025 and 2030

7.2 Bargaining power of buyers

Bargaining power of buyers - Impact of key factors 2025 and 2030

7.3 Bargaining power of suppliers

Bargaining power of suppliers - Impact of key factors in 2025 and 2030

7.4 Threat of new entrants

Threat of new entrants - Impact of key factors in 2025 and 2030

7.5 Threat of substitutes

Threat of substitutes - Impact of key factors in 2025 and 2030

7.6 Threat of rivalry

Threat of rivalry - Impact of key factors in 2025 and 2030

7.7 Market condition

Chart on Market condition - Five forces 2025 and 2030

8. Market Segmentation by Product Type

8.1 Market segments

Chart on Product Type - Market share 2025-2030 (%)
Data Table on Product Type - Market share 2025-2030 (%)

8.2 Comparison by Product Type

Chart on Comparison by Product Type
Data Table on Comparison by Product Type

8.3 3D modeling - Market size and forecast 2025-2030

Chart on 3D modeling - Market size and forecast 2025-2030 ($ million)
Data Table on 3D modeling - Market size and forecast 2025-2030 ($ million)
Chart on 3D modeling - Year-over-year growth 2025-2030 (%)
Data Table on 3D modeling - Year-over-year growth 2025-2030 (%)

8.4 3D mapping - Market size and forecast 2025-2030

Chart on 3D mapping - Market size and forecast 2025-2030 ($ million)
Data Table on 3D mapping - Market size and forecast 2025-2030 ($ million)
Chart on 3D mapping - Year-over-year growth 2025-2030 (%)
Data Table on 3D mapping - Year-over-year growth 2025-2030 (%)

8.5 Market opportunity by Product Type

Market opportunity by Product Type ($ million)
Data Table on Market opportunity by Product Type ($ million)

9. Market Segmentation by Component

9.1 Market segments

Chart on Component - Market share 2025-2030 (%)
Data Table on Component - Market share 2025-2030 (%)

9.2 Comparison by Component

Chart on Comparison by Component
Data Table on Comparison by Component

9.3 Software - Market size and forecast 2025-2030

Chart on Software - Market size and forecast 2025-2030 ($ million)
Data Table on Software - Market size and forecast 2025-2030 ($ million)
Chart on Software - Year-over-year growth 2025-2030 (%)
Data Table on Software - Year-over-year growth 2025-2030 (%)

9.4 Services - Market size and forecast 2025-2030

Chart on Services - Market size and forecast 2025-2030 ($ million)
Data Table on Services - Market size and forecast 2025-2030 ($ million)
Chart on Services - Year-over-year growth 2025-2030 (%)
Data Table on Services - Year-over-year growth 2025-2030 (%)

9.5 Market opportunity by Component

Market opportunity by Component ($ million)
Data Table on Market opportunity by Component ($ million)

10. Market Segmentation by Technology

10.1 Market segments

Chart on Technology - Market share 2025-2030 (%)
Data Table on Technology - Market share 2025-2030 (%)

10.2 Comparison by Technology

Chart on Comparison by Technology
Data Table on Comparison by Technology

10.3 LiDAR - Market size and forecast 2025-2030

Chart on LiDAR - Market size and forecast 2025-2030 ($ million)
Data Table on LiDAR - Market size and forecast 2025-2030 ($ million)
Chart on LiDAR - Year-over-year growth 2025-2030 (%)
Data Table on LiDAR - Year-over-year growth 2025-2030 (%)

10.4 Photogrammetry - Market size and forecast 2025-2030

Chart on Photogrammetry - Market size and forecast 2025-2030 ($ million)
Data Table on Photogrammetry - Market size and forecast 2025-2030 ($ million)
Chart on Photogrammetry - Year-over-year growth 2025-2030 (%)
Data Table on Photogrammetry - Year-over-year growth 2025-2030 (%)

10.5 SLAM - Market size and forecast 2025-2030

Chart on SLAM - Market size and forecast 2025-2030 ($ million)
Data Table on SLAM - Market size and forecast 2025-2030 ($ million)
Chart on SLAM - Year-over-year growth 2025-2030 (%)
Data Table on SLAM - Year-over-year growth 2025-2030 (%)

10.6 Others - Market size and forecast 2025-2030

Chart on Others - Market size and forecast 2025-2030 ($ million)
Data Table on Others - Market size and forecast 2025-2030 ($ million)
Chart on Others - Year-over-year growth 2025-2030 (%)
Data Table on Others - Year-over-year growth 2025-2030 (%)

10.7 Market opportunity by Technology

Market opportunity by Technology ($ million)
Data Table on Market opportunity by Technology ($ million)

11. Customer Landscape

11.1 Customer landscape overview

Analysis of price sensitivity, lifecycle, customer purchase basket, adoption rates, and purchase criteria

12. Geographic Landscape

12.1 Geographic segmentation

Chart on Market share by geography 2025-2030 (%)
Data Table on Market share by geography 2025-2030 (%)

12.2 Geographic comparison

Chart on Geographic comparison
Data Table on Geographic comparison

12.3 North America - Market size and forecast 2025-2030

Chart on North America - Market size and forecast 2025-2030 ($ million)
Data Table on North America - Market size and forecast 2025-2030 ($ million)
Chart on North America - Year-over-year growth 2025-2030 (%)
Data Table on North America - Year-over-year growth 2025-2030 (%)
Chart on Regional Comparison - North America
Data Table on Regional Comparison - North America

12.3.1 US - Market size and forecast 2025-2030

Chart on US - Market size and forecast 2025-2030 ($ million)
Data Table on US - Market size and forecast 2025-2030 ($ million)
Chart on US - Year-over-year growth 2025-2030 (%)
Data Table on US - Year-over-year growth 2025-2030 (%)

12.3.2 Canada - Market size and forecast 2025-2030

Chart on Canada - Market size and forecast 2025-2030 ($ million)
Data Table on Canada - Market size and forecast 2025-2030 ($ million)
Chart on Canada - Year-over-year growth 2025-2030 (%)
Data Table on Canada - Year-over-year growth 2025-2030 (%)

12.3.3 Mexico - Market size and forecast 2025-2030

Chart on Mexico - Market size and forecast 2025-2030 ($ million)
Data Table on Mexico - Market size and forecast 2025-2030 ($ million)
Chart on Mexico - Year-over-year growth 2025-2030 (%)
Data Table on Mexico - Year-over-year growth 2025-2030 (%)

12.4 APAC - Market size and forecast 2025-2030

Chart on APAC - Market size and forecast 2025-2030 ($ million)
Data Table on APAC - Market size and forecast 2025-2030 ($ million)
Chart on APAC - Year-over-year growth 2025-2030 (%)
Data Table on APAC - Year-over-year growth 2025-2030 (%)
Chart on Regional Comparison - APAC
Data Table on Regional Comparison - APAC

12.4.1 China - Market size and forecast 2025-2030

Chart on China - Market size and forecast 2025-2030 ($ million)
Data Table on China - Market size and forecast 2025-2030 ($ million)
Chart on China - Year-over-year growth 2025-2030 (%)
Data Table on China - Year-over-year growth 2025-2030 (%)

12.4.2 Japan - Market size and forecast 2025-2030

Chart on Japan - Market size and forecast 2025-2030 ($ million)
Data Table on Japan - Market size and forecast 2025-2030 ($ million)
Chart on Japan - Year-over-year growth 2025-2030 (%)
Data Table on Japan - Year-over-year growth 2025-2030 (%)

12.4.3 India - Market size and forecast 2025-2030

Chart on India - Market size and forecast 2025-2030 ($ million)
Data Table on India - Market size and forecast 2025-2030 ($ million)
Chart on India - Year-over-year growth 2025-2030 (%)
Data Table on India - Year-over-year growth 2025-2030 (%)

12.4.4 South Korea - Market size and forecast 2025-2030

Chart on South Korea - Market size and forecast 2025-2030 ($ million)
Data Table on South Korea - Market size and forecast 2025-2030 ($ million)
Chart on South Korea - Year-over-year growth 2025-2030 (%)
Data Table on South Korea - Year-over-year growth 2025-2030 (%)

12.4.5 Australia - Market size and forecast 2025-2030

Chart on Australia - Market size and forecast 2025-2030 ($ million)
Data Table on Australia - Market size and forecast 2025-2030 ($ million)
Chart on Australia - Year-over-year growth 2025-2030 (%)
Data Table on Australia - Year-over-year growth 2025-2030 (%)

12.4.6 Indonesia - Market size and forecast 2025-2030

Chart on Indonesia - Market size and forecast 2025-2030 ($ million)
Data Table on Indonesia - Market size and forecast 2025-2030 ($ million)
Chart on Indonesia - Year-over-year growth 2025-2030 (%)
Data Table on Indonesia - Year-over-year growth 2025-2030 (%)

12.5 Europe - Market size and forecast 2025-2030

Chart on Europe - Market size and forecast 2025-2030 ($ million)
Data Table on Europe - Market size and forecast 2025-2030 ($ million)
Chart on Europe - Year-over-year growth 2025-2030 (%)
Data Table on Europe - Year-over-year growth 2025-2030 (%)
Chart on Regional Comparison - Europe
Data Table on Regional Comparison - Europe

12.5.1 Germany - Market size and forecast 2025-2030

Chart on Germany - Market size and forecast 2025-2030 ($ million)
Data Table on Germany - Market size and forecast 2025-2030 ($ million)
Chart on Germany - Year-over-year growth 2025-2030 (%)
Data Table on Germany - Year-over-year growth 2025-2030 (%)

12.5.2 UK - Market size and forecast 2025-2030

Chart on UK - Market size and forecast 2025-2030 ($ million)
Data Table on UK - Market size and forecast 2025-2030 ($ million)
Chart on UK - Year-over-year growth 2025-2030 (%)
Data Table on UK - Year-over-year growth 2025-2030 (%)

12.5.3 France - Market size and forecast 2025-2030

Chart on France - Market size and forecast 2025-2030 ($ million)
Data Table on France - Market size and forecast 2025-2030 ($ million)
Chart on France - Year-over-year growth 2025-2030 (%)
Data Table on France - Year-over-year growth 2025-2030 (%)

12.5.4 Italy - Market size and forecast 2025-2030

Chart on Italy - Market size and forecast 2025-2030 ($ million)
Data Table on Italy - Market size and forecast 2025-2030 ($ million)
Chart on Italy - Year-over-year growth 2025-2030 (%)
Data Table on Italy - Year-over-year growth 2025-2030 (%)

12.5.5 Spain - Market size and forecast 2025-2030

Chart on Spain - Market size and forecast 2025-2030 ($ million)
Data Table on Spain - Market size and forecast 2025-2030 ($ million)
Chart on Spain - Year-over-year growth 2025-2030 (%)
Data Table on Spain - Year-over-year growth 2025-2030 (%)

12.5.6 The Netherlands - Market size and forecast 2025-2030

Chart on The Netherlands - Market size and forecast 2025-2030 ($ million)
Data Table on The Netherlands - Market size and forecast 2025-2030 ($ million)
Chart on The Netherlands - Year-over-year growth 2025-2030 (%)
Data Table on The Netherlands - Year-over-year growth 2025-2030 (%)

12.6 Middle East and Africa - Market size and forecast 2025-2030

Chart on Middle East and Africa - Market size and forecast 2025-2030 ($ million)
Data Table on Middle East and Africa - Market size and forecast 2025-2030 ($ million)
Chart on Middle East and Africa - Year-over-year growth 2025-2030 (%)
Data Table on Middle East and Africa - Year-over-year growth 2025-2030 (%)
Chart on Regional Comparison - Middle East and Africa
Data Table on Regional Comparison - Middle East and Africa

12.6.1 UAE - Market size and forecast 2025-2030

Chart on UAE - Market size and forecast 2025-2030 ($ million)
Data Table on UAE - Market size and forecast 2025-2030 ($ million)
Chart on UAE - Year-over-year growth 2025-2030 (%)
Data Table on UAE - Year-over-year growth 2025-2030 (%)

12.6.2 Saudi Arabia - Market size and forecast 2025-2030

Chart on Saudi Arabia - Market size and forecast 2025-2030 ($ million)
Data Table on Saudi Arabia - Market size and forecast 2025-2030 ($ million)
Chart on Saudi Arabia - Year-over-year growth 2025-2030 (%)
Data Table on Saudi Arabia - Year-over-year growth 2025-2030 (%)

12.6.3 South Africa - Market size and forecast 2025-2030

Chart on South Africa - Market size and forecast 2025-2030 ($ million)
Data Table on South Africa - Market size and forecast 2025-2030 ($ million)
Chart on South Africa - Year-over-year growth 2025-2030 (%)
Data Table on South Africa - Year-over-year growth 2025-2030 (%)

12.6.4 Israel - Market size and forecast 2025-2030

Chart on Israel - Market size and forecast 2025-2030 ($ million)
Data Table on Israel - Market size and forecast 2025-2030 ($ million)
Chart on Israel - Year-over-year growth 2025-2030 (%)
Data Table on Israel - Year-over-year growth 2025-2030 (%)

12.6.5 Turkey - Market size and forecast 2025-2030

Chart on Turkey - Market size and forecast 2025-2030 ($ million)
Data Table on Turkey - Market size and forecast 2025-2030 ($ million)
Chart on Turkey - Year-over-year growth 2025-2030 (%)
Data Table on Turkey - Year-over-year growth 2025-2030 (%)

12.7 South America - Market size and forecast 2025-2030

Chart on South America - Market size and forecast 2025-2030 ($ million)
Data Table on South America - Market size and forecast 2025-2030 ($ million)
Chart on South America - Year-over-year growth 2025-2030 (%)
Data Table on South America - Year-over-year growth 2025-2030 (%)
Chart on Regional Comparison - South America
Data Table on Regional Comparison - South America

12.7.1 Brazil - Market size and forecast 2025-2030

Chart on Brazil - Market size and forecast 2025-2030 ($ million)
Data Table on Brazil - Market size and forecast 2025-2030 ($ million)
Chart on Brazil - Year-over-year growth 2025-2030 (%)
Data Table on Brazil - Year-over-year growth 2025-2030 (%)

12.7.2 Argentina - Market size and forecast 2025-2030

Chart on Argentina - Market size and forecast 2025-2030 ($ million)
Data Table on Argentina - Market size and forecast 2025-2030 ($ million)
Chart on Argentina - Year-over-year growth 2025-2030 (%)
Data Table on Argentina - Year-over-year growth 2025-2030 (%)

12.7.3 Chile - Market size and forecast 2025-2030

Chart on Chile - Market size and forecast 2025-2030 ($ million)
Data Table on Chile - Market size and forecast 2025-2030 ($ million)
Chart on Chile - Year-over-year growth 2025-2030 (%)
Data Table on Chile - Year-over-year growth 2025-2030 (%)

12.8 Market opportunity by geography

Market opportunity by geography ($ million)
Data Tables on Market opportunity by geography ($ million)

13. Drivers, Challenges, and Opportunity

13.1 Market drivers

Technological convergence and AI-driven automation
Accelerating urbanization and smart city digital twins
Autonomous mobility and next-generation navigation

13.2 Market challenges

High implementation costs and computational demands
Regulatory fragmentation and geopolitical trade restrictions
Cybersecurity risks and data integrity vulnerabilities

13.3 Impact of drivers and challenges

Impact of drivers and challenges in 2025 and 2030

13.4 Market opportunities

Operationalization of industrial metaverse through physics-based digital twins
Integration of AI and ML into 3D mapping
Expansion in aerospace and defense applications

14. Competitive Landscape

14.1 Overview

14.2

Overview on criticality of inputs and factors of differentiation

14.3 Landscape disruption

Overview on factors of disruption

14.4 Industry risks

Impact of key risks on business

15. Competitive Analysis

15.1 Companies profiled

Companies covered

15.2 Company ranking index

15.3 Market positioning of companies

Matrix on companies position and classification

15.4 Adobe Inc.

Adobe Inc. - Overview
Adobe Inc. - Business segments
Adobe Inc. - Key news
Adobe Inc. - Key offerings
Adobe Inc. - Segment focus
SWOT

15.5 Airbus SE

Airbus SE - Overview
Airbus SE - Business segments
Airbus SE - Key news
Airbus SE - Key offerings
Airbus SE - Segment focus
SWOT

15.6 Autodesk Inc.

Autodesk Inc. - Overview
Autodesk Inc. - Business segments
Autodesk Inc. - Key news
Autodesk Inc. - Key offerings
Autodesk Inc. - Segment focus
SWOT

15.7 Bentley Systems Inc.

Bentley Systems Inc. - Overview
Bentley Systems Inc. - Business segments
Bentley Systems Inc. - Key news
Bentley Systems Inc. - Key offerings
Bentley Systems Inc. - Segment focus
SWOT

15.8 Blue Marble Geographics

Blue Marble Geographics - Overview
Blue Marble Geographics - Product / Service
Blue Marble Geographics - Key offerings
SWOT

15.9 Cesium GS

Cesium GS - Overview
Cesium GS - Product / Service
Cesium GS - Key offerings
SWOT

15.10 CyberCity 3D Inc.

CyberCity 3D Inc. - Overview
CyberCity 3D Inc. - Product / Service
CyberCity 3D Inc. - Key offerings
SWOT

15.11 Dassault Systemes SE

Dassault Systemes SE - Overview
Dassault Systemes SE - Business segments
Dassault Systemes SE - Key news
Dassault Systemes SE - Key offerings
Dassault Systemes SE - Segment focus
SWOT

15.12 Esri Global Inc.

Esri Global Inc. - Overview
Esri Global Inc. - Product / Service
Esri Global Inc. - Key offerings
SWOT

15.13 Golden Software LLC

Golden Software LLC - Overview
Golden Software LLC - Product / Service
Golden Software LLC - Key offerings
SWOT

15.14 Intermap Technologies Corp.

Intermap Technologies Corp. - Overview
Intermap Technologies Corp. - Product / Service
Intermap Technologies Corp. - Key offerings
SWOT

15.15 Mapbox Inc.

Mapbox Inc. - Overview
Mapbox Inc. - Product / Service
Mapbox Inc. - Key offerings
SWOT

15.16 Matterport Inc.

Matterport Inc. - Overview
Matterport Inc. - Product / Service
Matterport Inc. - Key offerings
SWOT

15.17 Pix4D SA

Pix4D SA - Overview
Pix4D SA - Product / Service
Pix4D SA - Key offerings
SWOT

15.18 Trimble Inc.

Trimble Inc. - Overview
Trimble Inc. - Business segments
Trimble Inc. - Key news
Trimble Inc. - Key offerings
Trimble Inc. - Segment focus
SWOT

16. Appendix

16.1 Scope of the report

Market definition
Objectives
Notes and caveats

16.2 Inclusions and exclusions checklist

Inclusions checklist
Exclusions checklist

16.3 Currency conversion rates for US$

16.4 Research methodology

16.5 Data procurement

Information sources

16.6 Data validation

16.7 Validation techniques employed for market sizing

16.8 Data synthesis

16.9 360 degree market analysis

16.10 List of abbreviations

Research Methodology

Technavio presents a detailed picture of the market by way of study, synthesis, and summation of data from multiple sources. The analysts have presented the various facets of the market with a particular focus on identifying the key industry influencers. The data thus presented is comprehensive, reliable, and the result of extensive research, both primary and secondary.

INFORMATION SOURCES

Primary sources

  • Manufacturers and suppliers
  • Channel partners
  • Industry experts
  • Strategic decision makers

Secondary sources

  • Industry journals and periodicals
  • Government data
  • Financial reports of key industry players
  • Historical data
  • Press releases

DATA ANALYSIS

Data Synthesis

  • Collation of data
  • Estimation of key figures
  • Analysis of derived insights

Data Validation

  • Triangulation with data models
  • Reference against proprietary databases
  • Corroboration with industry experts

REPORT WRITING

Qualitative

  • Market drivers
  • Market challenges
  • Market trends
  • Five forces analysis

Quantitative

  • Market size and forecast
  • Market segmentation
  • Geographical insights
  • Competitive landscape

Interested in this report?

Get your sample now to see our research methodology and insights!

Download Now

Frequently Asked Questions

3D Mapping And Modeling market growth will increase by USD 2947.8 million during 2026-2030.

The 3D Mapping And Modeling market is expected to grow at a CAGR of 6.1% during 2026-2030.

3D Mapping And Modeling market is segmented by Product type (3D modeling, 3D mapping) Component (Software, Services) Technology (LiDAR, Photogrammetry, SLAM, Others)

Adobe Inc., Airbus SE, Autodesk Inc., Bentley Systems Inc., Blue Marble Geographics, Cesium GS, CyberCity 3D Inc., Dassault Systemes SE, Esri Global Inc., Golden Software LLC, Intermap Technologies Corp., Mapbox Inc., Matterport Inc., Maxon Computer GmbH, Pix4D SA, Saab AB, The Foundry Visionmongers Ltd., Topcon Positioning Systems Inc., Trimble Inc. are a few of the key vendors in the 3D Mapping And Modeling market.

North America will register the highest growth rate of 36% among the other regions. Therefore, the 3D Mapping And Modeling market in North America is expected to garner significant business opportunities for the vendors during the forecast period.

US, Canada, Mexico, China, Japan, India, South Korea, Australia, Indonesia, Germany, UK, France, Italy, Spain, The Netherlands, UAE, Saudi Arabia, South Africa, Israel, Turkey, Brazil, Argentina, Chile

  • Technological convergence and AI-driven automation is the driving factor this market.

The 3D Mapping And Modeling market vendors should focus on grabbing business opportunities from the Product type segment as it accounted for the largest market share in the base year.
RIA - Research AI Assistant
Ask RIA