
Acetaldehyde Market Size 2025-2029
The acetaldehyde market size is valued to increase by USD 357.3 million, at a CAGR of 3.3% from 2024 to 2029. Robust demand from agrochemical sector will drive the acetaldehyde market.
Major Market Trends & Insights
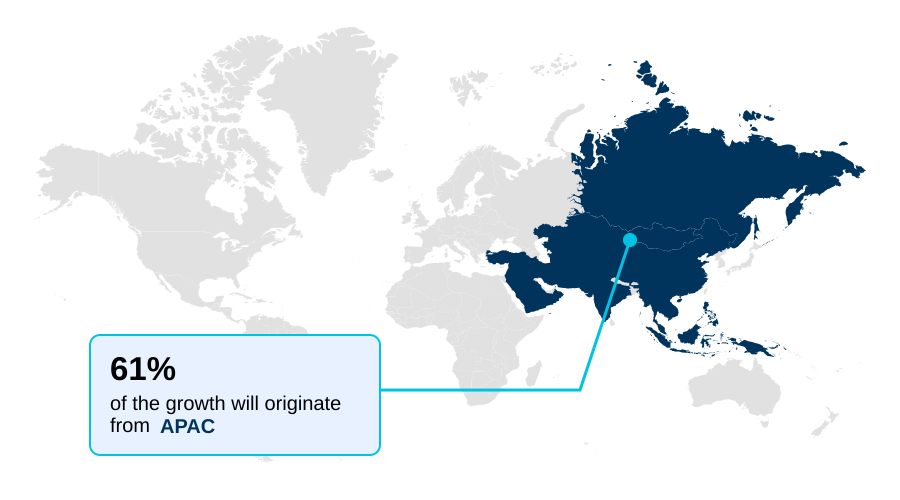
- APAC dominated the market and accounted for a 61.3% growth during the forecast period.
- By Type - Petrochemical based segment was valued at USD 1.34 billion in 2023
- By Application - Chemical synthesis segment accounted for the largest market revenue share in 2023
Market Size & Forecast
- Market Opportunities: USD 569.8 million
- Market Future Opportunities: USD 357.3 million
- CAGR from 2024 to 2029 : 3.3%
Market Summary
- The acetaldehyde market is shaped by its role as an indispensable chemical building block for diverse downstream sectors. Demand is fundamentally linked to the health of the agrochemical, paints and coatings, and specialty chemicals industries. The need for agrochemical intermediate chemicals to produce crop protection formulations remains a consistent driver, supporting agricultural productivity.
- Concurrently, growth in construction and automotive manufacturing fuels the consumption of derivatives like pentaerythritol production for alkyd resin formulation. A key market trend is the strategic shift toward green chemistry production, with companies exploring bioethanol renewable feedstock to reduce their environmental footprint and mitigate feedstock price volatility associated with petrochemicals.
- This transition toward sustainable chemical manufacturing aligns with tightening environmental and health regulations, such as REACH regulation compliance, which mandate significant investments in chemical plant emission control and process safety management.
- A typical business scenario involves a manufacturer re-evaluating its raw material procurement strategy, balancing the cost-efficiency of traditional Wacker process technology against the long-term benefits and market appeal of a circular economy model. This decision-making is complicated by the persistent threat of technological pathway disruption, where new synthesis routes could bypass acetaldehyde entirely, creating long-term uncertainty.
What will be the Size of the Acetaldehyde Market during the forecast period?

Get Key Insights on Market Forecast (PDF) Get Free Sample
How is the Acetaldehyde Market Segmented?
The acetaldehyde industry research report provides comprehensive data (region-wise segment analysis), with forecasts and estimates in "USD million" for the period 2025-2029, as well as historical data from 2019-2023 for the following segments.
- Type
- Petrochemical based
- Bio based
- Application
- Chemical synthesis
- Plastics and synthetic rubber
- Food and beverage
- Paints and coatings
- Others
- Distribution channel
- Indirect sale
- Direct sale
- Geography
- APAC
- China
- India
- Japan
- North America
- US
- Canada
- Mexico
- Europe
- Germany
- France
- UK
- South America
- Brazil
- Argentina
- Colombia
- Middle East and Africa
- Saudi Arabia
- UAE
- South Africa
- Rest of World (ROW)
- APAC
By Type Insights
The petrochemical based segment is estimated to witness significant growth during the forecast period.
The petrochemical segment, the market's traditional core, relies on petrochemical feedstock sourcing and the established Wacker process technology.
This production route, using an ethylene oxidation catalyst, defines the commodity chemical market through economies of scale but ties the chemical value chain directly to feedstock price volatility.
In response, firms are emphasizing production process efficiency and process intensification strategy to align with corporate sustainability goals (ESG). These efforts, which require significant capital expenditure planning, focus on catalyst selectivity improvement to achieve byproduct formation minimization.
For instance, select producers have cut waste streams by 8% through catalyst optimization, demonstrating a clear path to improving margins while navigating stringent REACH regulation compliance.
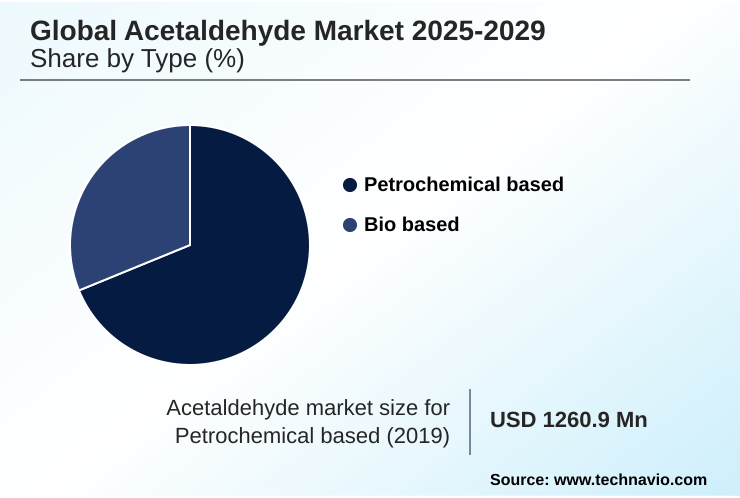
The Petrochemical based segment was valued at USD 1.34 billion in 2023 and showed a gradual increase during the forecast period.

Regional Analysis
APAC is estimated to contribute 61.3% to the growth of the global market during the forecast period.Technavio’s analysts have elaborately explained the regional trends and drivers that shape the market during the forecast period.
See How Acetaldehyde Market Demand is Rising in APAC Get Free Sample
The geographic landscape of the Acetaldehyde market is defined by distinct regional market dynamics. The APAC region leads, driven by industrial manufacturing that consumes vast quantities of this core chemical building block for applications like 1,3-butadiene monomer production.
In contrast, the European market is at the forefront of the circular economy model, with a strong push toward sustainable chemical manufacturing and water-borne coating technology to reduce reliance on products like ethyl acetate solvent.
This focus on sustainability influences the broader chemical industry.
For instance, European automakers now mandate that suppliers of components with polyacetal resin properties must demonstrate a 15% lower carbon footprint compared to five years ago, driving innovation across the specialty chemical synthesis supply chain.
Market Dynamics
Our researchers analyzed the data with 2024 as the base year, along with the key drivers, trends, and challenges. A holistic analysis of drivers will help companies refine their marketing strategies to gain a competitive advantage.
- Strategic decision-making in the acetaldehyde market requires a deep understanding of its complex value chain and technological landscape. The efficiency of ethanol dehydrogenation catalysts is a critical factor for producers pursuing greener alternatives, yet they must weigh the bio-based vs petrochemical production cost.
- For those using traditional methods, managing Wacker process catalyst deactivation issues and mitigating the environmental impact of the Wacker process are paramount. The synthesis of pyridine from ethanal remains a core application, highlighting why ethanal as a precursor for agrochemicals is a key demand driver. Similarly, the process for pentaerythritol production from formaldehyde underpins its use in coatings.
- However, firms face persistent market challenges from substitute technologies, including alternative technologies to ethanal intermediates that could disrupt demand. Navigating the regulatory environment is another critical function. The high REACH compliance costs for producers in certain regions necessitate continuous investment in process safety and emission controls.
- This is particularly relevant given the strict VOC regulations for paints and coatings, which influence the n-butanol synthesis from ethanal route. For instance, companies that proactively invest in advanced abatement technologies report up to 15% lower compliance-related operational disruptions compared to those with lagging infrastructure.
- Furthermore, managing feedstock volatility in production remains a constant operational challenge, directly influencing the impact of ethylene price on ethanal. The broad use of ethanal in food flavoring agents and its role in synthetic rubber production diversify its application base, while its function as an active pharmaceutical intermediate opens higher-value opportunities.
- Ultimately, understanding the growth drivers in the agrochemical sector and the potential for process intensification in ethanal manufacturing is essential for achieving long-term profitability.
What are the key market drivers leading to the rise in the adoption of Acetaldehyde Industry?
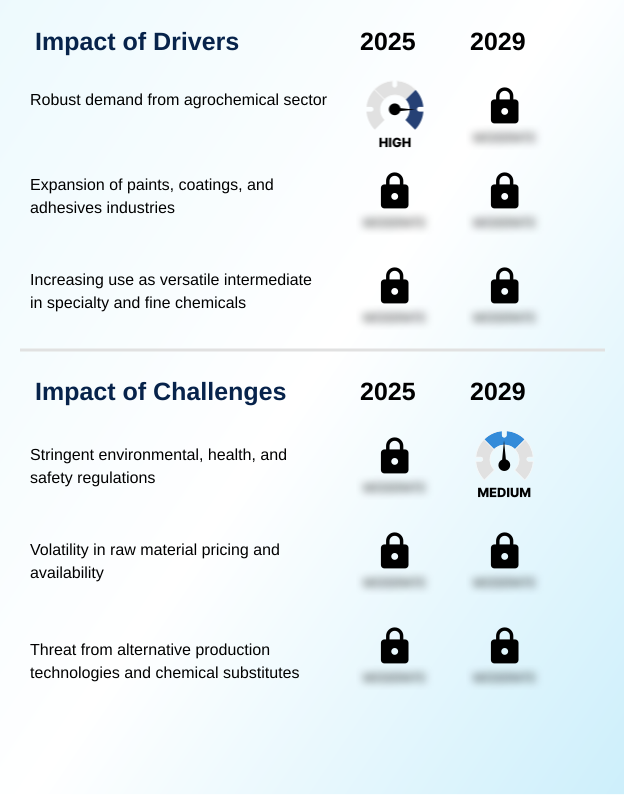
- Robust demand from the agrochemical sector, where acetaldehyde is a critical intermediate for producing essential crop protection chemicals, serves as a primary driver for market growth.
- Demand is fundamentally driven by its role as an agrochemical intermediate chemical for crop protection chemical formulation, linking its growth to the agricultural commodity market impact.
- Downstream chemical production for industrial applications, including pentaerythritol production and n-butanol chemical synthesis for alkyd resin formulation in coatings, provides steady volume. Moreover, chemical precursor diversification into specialty and fine chemicals represents a significant growth vector.
- This move into high-value chemical application areas, such as manufacturing an active pharmaceutical ingredient (API), offers higher margins and market stability.
- Firms employing backward integration for feedstocks can reduce production costs for this industrial intermediate chemical by up to 10%, strengthening their position in both commodity and specialty chemical synthesis application segments.
What are the market trends shaping the Acetaldehyde Industry?
- A defining trend influencing the market is the accelerated shift from petrochemical feedstocks toward sustainable, bio-based acetaldehyde production routes. This transition is driven by environmental regulations and corporate demand for greener chemical intermediates.
- A defining trend is the shift toward green chemistry production, with the bio-based chemical intermediate gaining traction. This involves using bioethanol renewable feedstock, often from cellulosic biomass conversion, via the ethanol dehydrogenation route. This aligns with sustainable manufacturing practice and bio-refinery concept integration.
- Companies pursuing this trend are improving their raw material procurement strategy and overall supply chain optimization, with some achieving a 15% improvement in feedstock traceability. Furthermore, vertical integration in chemicals, particularly a forward integration strategy, is being used to build a resilient business model.
- This approach enhances operational excellence in production and helps achieve economies of scale, making the bio-based pathway more competitive against traditional methods.
What challenges does the Acetaldehyde Industry face during its growth?
- The imposition of stringent environmental, health, and safety regulations presents a significant challenge, increasing compliance costs and operational complexities for acetaldehyde producers.
- Significant challenges stem from stringent environmental and health regulations, with acetaldehyde classified as a hazardous air pollutant (HAP). Compliance requires heavy investment in process safety management and chemical plant emission control to achieve toxic air pollution reduction.
- The historical market erosion from the methanol carbonylation process, which created an acetic acid production bypass, serves as a precedent for technological pathway disruption from innovations like syngas chemistry advancement. These pressures force producers using the palladium-copper chloride catalyst to focus on improving catalyst performance and lifespan.
- For example, failing to meet new volatile organic compound (VOC) limits can result in fines that increase operational costs by over 20%, impacting competitiveness even for high-purity chemical grades.
Exclusive Technavio Analysis on Customer Landscape
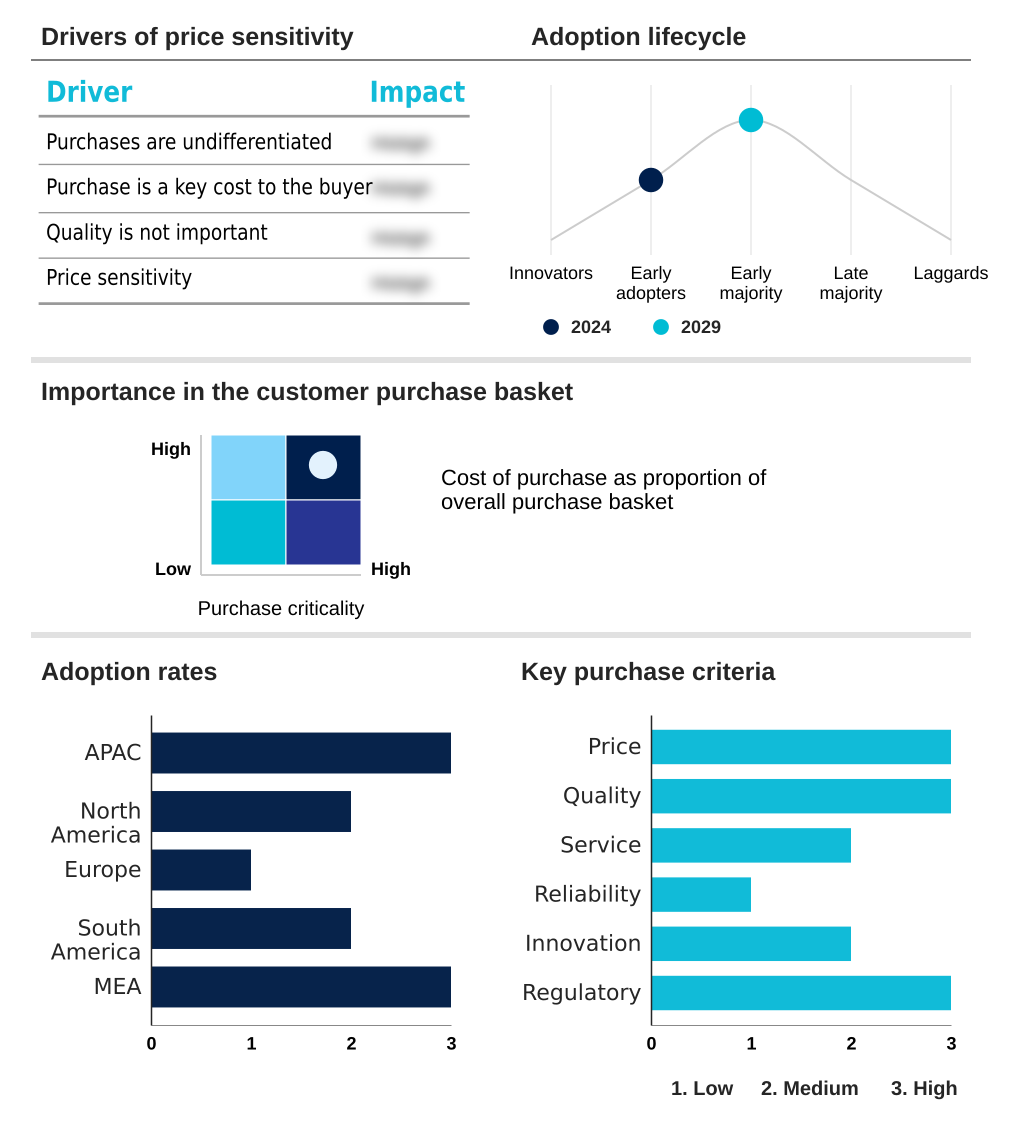
The acetaldehyde market forecasting report includes the adoption lifecycle of the market, covering from the innovator’s stage to the laggard’s stage. It focuses on adoption rates in different regions based on penetration. Furthermore, the acetaldehyde market report also includes key purchase criteria and drivers of price sensitivity to help companies evaluate and develop their market growth analysis strategies.
Customer Landscape of Acetaldehyde Industry
Competitive Landscape
Companies are implementing various strategies, such as strategic alliances, acetaldehyde market forecast, partnerships, mergers and acquisitions, geographical expansion, and product/service launches, to enhance their presence in the industry.
Arkema Group - Acetaldehyde is offered as a versatile chemical intermediate, pivotal for synthesizing derivatives used across coatings, agrochemicals, pharmaceuticals, and specialty polymers, driving value in diverse industrial applications.
The industry research and growth report includes detailed analyses of the competitive landscape of the market and information about key companies, including:
- Arkema Group
- Arxada AG
- Celanese Corp.
- China National Petroleum Corp.
- Daicel Corp.
- Eastman Chemical Co.
- GFS Chemicals Inc.
- Godavari Biorefineries Ltd.
- Jubilant Ingrevia Ltd.
- Laxmi Organic Industries Ltd.
- LCY Chemical Corp.
- Merck KGaA
- Naran Lala Pvt. Ltd.
- Resonac Holdings Corp.
- Sekab
- Solvay SA
- Sumitomo Chemical Co. Ltd.
- Vigon International Inc.
- Wacker Chemie AG
Qualitative and quantitative analysis of companies has been conducted to help clients understand the wider business environment as well as the strengths and weaknesses of key industry players. Data is qualitatively analyzed to categorize companies as pure play, category-focused, industry-focused, and diversified; it is quantitatively analyzed to categorize companies as dominant, leading, strong, tentative, and weak.
Recent Development and News in Acetaldehyde market
- In December 2024, Godavari Biorefineries Ltd. announced the commissioning of its expanded bio-refinery, increasing its bio-based acetaldehyde capacity by 40% to meet growing demand for sustainable chemical intermediates.
- In February 2025, Eastman Chemical Co. announced a strategic partnership with a leading catalyst technology firm to pilot a new, highly selective catalyst system for its Wacker process, aiming to reduce byproduct formation by 15%.
- In May 2025, Celanese Corp. completed the acquisition of a regional specialty chemicals producer, strengthening its vertical integration and expanding its portfolio of acetaldehyde derivatives for the agrochemical market.
- In November 2024, the European Chemicals Agency (ECHA) proposed stricter occupational exposure limits for acetaldehyde under REACH, prompting manufacturers to invest in advanced emission control technologies.
Dive into Technavio’s robust research methodology, blending expert interviews, extensive data synthesis, and validated models for unparalleled Acetaldehyde Market insights. See full methodology.
| Market Scope | |
|---|---|
| Page number | 300 |
| Base year | 2024 |
| Historic period | 2019-2023 |
| Forecast period | 2025-2029 |
| Growth momentum & CAGR | Accelerate at a CAGR of 3.3% |
| Market growth 2025-2029 | USD 357.3 million |
| Market structure | Fragmented |
| YoY growth 2024-2025(%) | 3.3% |
| Key countries | China, India, Japan, South Korea, Indonesia, Australia, US, Canada, Mexico, Germany, France, UK, Italy, Spain, The Netherlands, Brazil, Argentina, Colombia, Saudi Arabia, UAE, South Africa, Israel and Turkey |
| Competitive landscape | Leading Companies, Market Positioning of Companies, Competitive Strategies, and Industry Risks |
Research Analyst Overview
- The acetaldehyde market's trajectory is defined by its function as a specialty chemical synthesis component and an essential agrochemical intermediate chemical. Production is dominated by petrochemical feedstock sourcing via Wacker process technology, using an ethylene oxidation catalyst, but the industry is at a crossroads.
- The trend toward green chemistry production and a circular economy model, utilizing bioethanol renewable feedstock from cellulosic biomass conversion, presents a strategic choice for boardrooms. This decision weighs the established efficiency of petrochemical routes against the market advantages and regulatory alignment of sustainable chemical manufacturing.
- Firms implementing process intensification strategy, like using a reactive distillation unit, have reported a 10% reduction in energy consumption. This focus on efficiency is crucial for managing feedstock price volatility and complying with standards like REACH regulation compliance for volatile organic compound (VOC) emissions from products like ethyl acetate solvent.
- The threat from the methanol carbonylation process as an acetic acid production bypass serves as a constant reminder of risk, compelling innovation in catalyst selectivity improvement and diversification into applications like synthetic rubber monomer and polyacetal resin properties.
What are the Key Data Covered in this Acetaldehyde Market Research and Growth Report?
-
What is the expected growth of the Acetaldehyde Market between 2025 and 2029?
-
USD 357.3 million, at a CAGR of 3.3%
-
-
What segmentation does the market report cover?
-
The report is segmented by Type (Petrochemical based, Bio based), Application (Chemical synthesis, Plastics and synthetic rubber, Food and beverage, Paints and coatings, Others), Distribution Channel (Indirect sale, Direct sale) and Geography (APAC, North America, Europe, South America, Middle East and Africa)
-
-
Which regions are analyzed in the report?
-
APAC, North America, Europe, South America and Middle East and Africa
-
-
What are the key growth drivers and market challenges?
-
Robust demand from agrochemical sector , Stringent environmental, health, and safety regulations
-
-
Who are the major players in the Acetaldehyde Market?
-
Arkema Group, Arxada AG, Celanese Corp., China National Petroleum Corp., Daicel Corp., Eastman Chemical Co., GFS Chemicals Inc., Godavari Biorefineries Ltd., Jubilant Ingrevia Ltd., Laxmi Organic Industries Ltd., LCY Chemical Corp., Merck KGaA, Naran Lala Pvt. Ltd., Resonac Holdings Corp., Sekab, Solvay SA, Sumitomo Chemical Co. Ltd., Vigon International Inc. and Wacker Chemie AG
-
Market Research Insights
- The dynamics of the acetaldehyde market are shaped by the interplay between production process efficiency and evolving downstream chemical production needs. As a critical chemical building block, its supply chain optimization is a primary focus for producers. Companies leveraging backward integration for feedstocks report a 10-15% reduction in cost volatility compared to peers.
- The push for sustainable manufacturing practices has led to innovations in catalyst performance and lifespan, enabling some to achieve a 5% increase in yield, directly enhancing operational excellence in production. However, the commodity chemical market is sensitive to environmental and health regulations, which drive up process safety management costs.
- A forward integration strategy is being adopted by some players, securing captive demand and creating a more resilient business model that can better withstand market pressures.
We can help! Our analysts can customize this acetaldehyde market research report to meet your requirements.
 RIA -
RIA - 
