Molecular Sieves Market Analysis, Size, and Forecast 2026-2030: APAC (China, Japan, and India), Europe (Germany, UK, and France), North America (US, Canada, and Mexico), South America (Brazil, Argentina, and Colombia), Middle East and Africa (Saudi Arabia, UAE, and South Africa), and Rest of World (ROW)

Molecular Sieves Market Analysis, Size, and Forecast 2026-2030:
APAC (China, Japan, and India), Europe (Germany, UK, and France), North America (US, Canada, and Mexico), South America (Brazil, Argentina, and Colombia), Middle East and Africa (Saudi Arabia, UAE, and South Africa), and Rest of World (ROW)

Published: Mar 2026 304 Pages SKU: IRTNTR70123

Market Overview at a Glance

$2.40 B
Market Opportunity
8%
CAGR 2025 - 2030
45%
APAC Growth
$1.80 B
3A segment 2024

Molecular Sieves Market Size 2026-2030

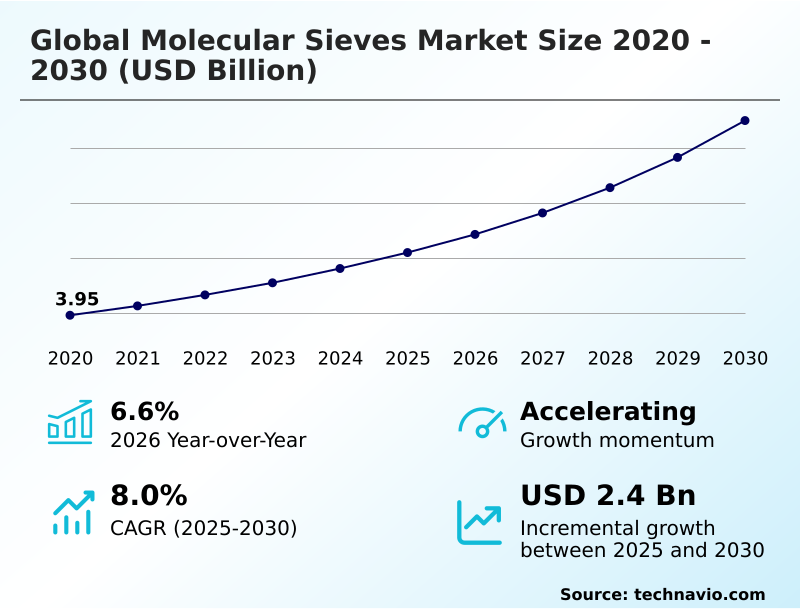
The molecular sieves market size is valued to increase by USD 2.40 billion, at a CAGR of 8% from 2025 to 2030. Expanding demand from oil and gas refining and petrochemical processing will drive the molecular sieves market.

Major Market Trends & Insights

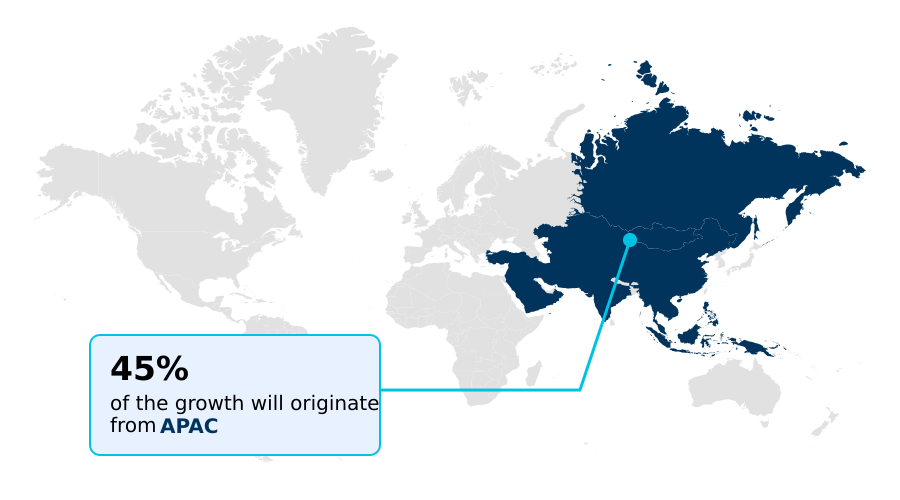
  • APAC dominated the market and accounted for a 45% growth during the forecast period.
  • By Grade Type - 3A segment was valued at USD 1.80 billion in 2024
  • By End-user - Oil and gas industry segment accounted for the largest market revenue share in 2024

Market Size & Forecast

  • Market Opportunities: USD 3.55 billion
  • Market Future Opportunities: USD 2.40 billion
  • CAGR from 2025 to 2030 : 8%

Market Summary

  • The Molecular Sieves Market is integral to modern industrial operations, driven by the relentless need for high-purity separation and purification. These materials, including various zeolite adsorbents, are fundamental in sectors like petrochemicals and natural gas, where contaminant removal ensures process efficiency and prevents equipment failure.
  • A key trend is the development of application-specific molecular sieves with tailored pore structures to meet specialized requirements in pharmaceuticals and electronics, where ultra-high purity is non-negotiable. For instance, a specialty chemical producer might leverage customized adsorption solutions to achieve a 99.99% purity level, a benchmark impossible with generic adsorbents.
  • However, the industry faces challenges from high production costs due to energy-intensive synthesis and activation processes. Another significant constraint is performance degradation in harsh operating conditions, which can shorten service life and increase operational expenses. The competitive landscape pushes for innovation in regeneration efficiency and thermal stability to maintain market relevance against alternative separation technologies.
  • Success hinges on balancing performance with cost-effectiveness to serve an increasingly diverse and demanding customer base.

What will be the Size of the Molecular Sieves Market during the forecast period?

Get Key Insights on Market Forecast (PDF) Request Free Sample

How is the Molecular Sieves Market Segmented?

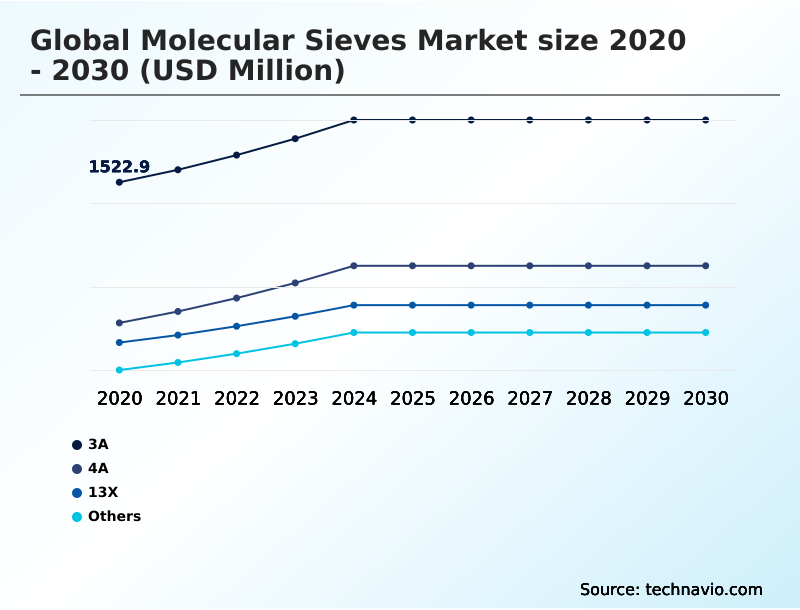
The molecular sieves industry research report provides comprehensive data (region-wise segment analysis), with forecasts and estimates in "USD million" for the period 2026-2030, as well as historical data from 2020-2024 for the following segments.

  • Grade type
    • 3A
    • 4A
    • 13X
    • Others
  • End-user
    • Oil and gas industry
    • Petrochemical industry
    • Process industries
    • Construction industry
    • Others
  • Type
    • Beads
    • Pellets
    • Powder
  • Geography
    • APAC
      • China
      • Japan
      • India
    • Europe
      • Germany
      • UK
      • France
    • North America
      • US
      • Canada
      • Mexico
    • South America
      • Brazil
      • Argentina
      • Colombia
    • Middle East and Africa
      • Saudi Arabia
      • UAE
      • South Africa
    • Rest of World (ROW)

By Grade Type Insights

The 3a segment is estimated to witness significant growth during the forecast period.

The 3A grade molecular sieve segment is critical for the dehydration of unsaturated hydrocarbons and polar liquids, valued for its precise three-angstrom pore size.

Its application in the ethanol industry is significant, where selective adsorption of water is essential for producing high-purity biofuels, minimizing product loss by over 98% while excluding ethanol molecules.

This grade is vital for cracked gas drying and natural gas treatment, preventing hydrate formation. Manufacturers are focused on improving the crush strength and thermal stability of these desiccant beads to extend service life in demanding industrial environments.

The selective adsorption process of this crystalline aluminosilicate supports applications like insulated glass desiccant, preventing moisture accumulation and ensuring the efficiency of modern building materials, reflecting the demand for high performance adsorbents and advanced separation materials.

Request Free Sample

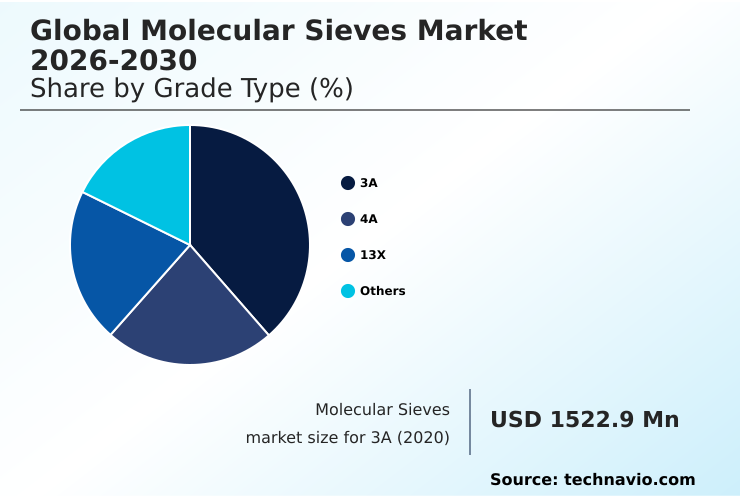
The 3A segment was valued at USD 1.80 billion in 2024 and showed a gradual increase during the forecast period.

Request Free Sample

Regional Analysis

APAC is estimated to contribute 45% to the growth of the global market during the forecast period.Technavio’s analysts have elaborately explained the regional trends and drivers that shape the market during the forecast period.

See How Molecular Sieves Market Demand is Rising in APAC Request Free Sample

The geographic landscape of the market is led by APAC, which accounts for approximately 45% of the market's incremental growth, driven by rapid industrialization in China and India.

This region's demand is fueled by expanding petrochemical and manufacturing sectors requiring effective paraffin refining and liquid hydrocarbon treatment.

In contrast, North America and Europe represent mature markets focused on high-purity processing and technological innovation, such as advanced catalyst shaping technology.

These regions prioritize adherence to stringent environmental regulations, driving the adoption of solutions for syngas purification and VOC abatement systems.

The use of adsorbents for petrochemical industry applications in the Middle East, particularly for natural gas sweetening and refinery gas sweetening, remains a cornerstone of regional demand, with new projects consistently achieving sub-PPM moisture levels.

Market Dynamics

Our researchers analyzed the data with 2025 as the base year, along with the key drivers, trends, and challenges. A holistic analysis of drivers will help companies refine their marketing strategies to gain a competitive advantage.

  • Strategic decision-making in the global molecular sieves market 2026-2030 requires a deep understanding of application-specific performance. For instance, the selection between molecular sieve vs activated alumina is critical in processes where selective water adsorption is paramount, as sieves offer superior efficiency in achieving low dew points.
  • The effectiveness of 3A molecular sieve ethanol drying processes is a benchmark for biofuel purity, while the choice of 4A molecular sieve in refrigerants directly impacts cooling system longevity by preventing ice formation. For more complex separations, 5A molecular sieve for n-paraffin separation is essential in the petrochemical industry for producing linear hydrocarbons.
  • In environmental and life-support applications, 13X molecular sieve for air purification is the standard for removing CO2 and other contaminants from breathable air streams. Facilities that optimize their molecular sieve regeneration temperature cycle report up to 15% lower energy consumption compared to those using default parameters, directly impacting operational expenditures.
  • Understanding the impact of contaminants on sieve life is another crucial factor, as it informs pre-treatment system design and maintenance schedules, ensuring long-term asset reliability.

What are the key market drivers leading to the rise in the adoption of Molecular Sieves Industry?

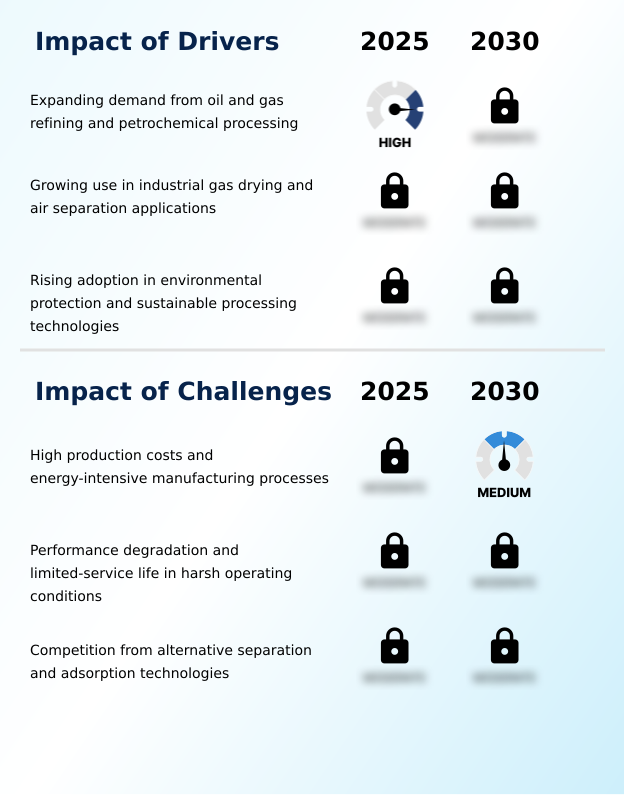
  • The market is primarily driven by expanding demand from oil and gas refining and petrochemical processing, where efficient purification is critical for operational integrity and product quality.

  • Market growth is fundamentally propelled by expanding demand from core industrial sectors.
  • The oil and gas industry's reliance on these materials for natural gas sweetening and dehydration remains a primary driver, with advanced adsorbents enabling a 99.9% sulfur removal rate to meet stringent fuel standards.
  • In petrochemicals, molecular sieves are indispensable for aromatics processing and hydrocarbon separation. Simultaneously, the rising need for high-purity industrial gases is boosting adoption in air separation units, where sieves protect cryogenic systems and ensure product quality.
  • The focus on sustainability is also creating new opportunities; solvent recovery systems using sieves can recapture over 95% of volatile organic compounds, aligning with tightening environmental regulations and circular economy principles.
  • This demand is reinforced by applications such as cracked gas drying and LNG dehydration process.

What are the market trends shaping the Molecular Sieves Industry?

  • A primary trend shaping the market is the increasing adoption of molecular sieves in high-purity and specialty applications. This shift is driven by stringent quality demands across advanced industries.

  • Key trends are centered on specialization and efficiency, with a growing demand for high-purity processing across industries. The development of application-specific molecular sieves is enabling breakthroughs in moisture control in pharmaceuticals and electronics, where sub-PPM purity levels are often required.
  • This drive for precision is pushing innovation in pore structure uniformity and adsorption kinetics, enhancing the performance of industrial gas purification systems. For instance, advanced materials can improve regeneration efficiency by up to 20%. The energy transition is also a significant factor, with increasing use of sieves in hydrogen purification technology and biogas upgrading technology.
  • These customized adsorption solutions, designed for specific contaminant removal, are essential for the viability of cleaner fuel production, demonstrating the market's alignment with global sustainability goals.

What challenges does the Molecular Sieves Industry face during its growth?

  • A key challenge affecting industry growth is the high production cost associated with energy-intensive manufacturing processes required for molecular sieves.

  • The market contends with significant operational and economic challenges that temper its growth trajectory. The high production cost, with energy-intensive manufacturing steps accounting for over 30% of total expenses, puts pressure on margins, especially when raw material prices fluctuate.
  • Performance degradation remains a key issue; under harsh operating conditions, adsorbents can lose up to 15% of their adsorption capacity over their service life, leading to higher replacement frequency. This is particularly challenging in processes like the temperature swing adsorption. Furthermore, robust competition from alternative technologies, such as advanced membrane separation systems, presents a persistent threat.
  • These alternatives may offer lower capital costs in certain applications, forcing molecular sieve producers to continuously innovate in areas like regeneration efficiency and thermal stability to prove their superior lifecycle value and defend their market position against powdered zeolite applications.

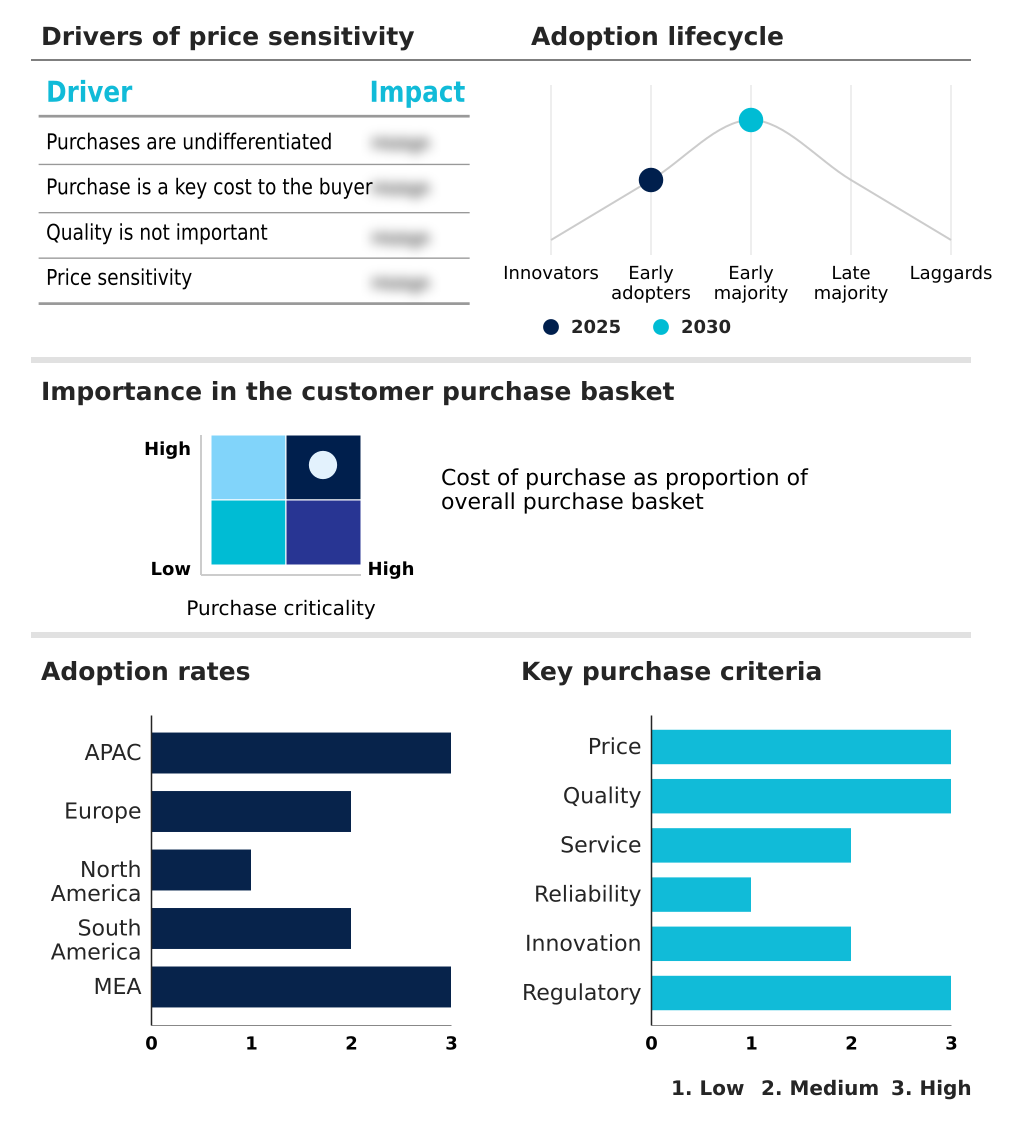
Exclusive Technavio Analysis on Customer Landscape

The molecular sieves market forecasting report includes the adoption lifecycle of the market, covering from the innovator’s stage to the laggard’s stage. It focuses on adoption rates in different regions based on penetration. Furthermore, the molecular sieves market report also includes key purchase criteria and drivers of price sensitivity to help companies evaluate and develop their market growth analysis strategies.

Customer Landscape of Molecular Sieves Industry

Competitive Landscape

Companies are implementing various strategies, such as strategic alliances, molecular sieves market forecast, partnerships, mergers and acquisitions, geographical expansion, and product/service launches, to enhance their presence in the industry.

Arkema Group - Offerings center on high-performance adsorbents and synthetic zeolite materials engineered for advanced purification, dehydration, and separation processes across critical industrial sectors.

The industry research and growth report includes detailed analyses of the competitive landscape of the market and information about key companies, including:

  • Arkema Group
  • Axens Group
  • BASF SE
  • Brownell Ltd.
  • CarboTech AC GmbH
  • FUJIFILM Holdings Corp.
  • HengYe Inc.
  • Honeywell International Inc.
  • KURARAY Co. Ltd.
  • Merck KGaA
  • Nanoshel LLC
  • Sorbchem India Pvt. Ltd.
  • Vizag Chemical International
  • W. R. Grace and Co.
  • Zeochem AG
  • ZR Catalyst Co. LTD.

Qualitative and quantitative analysis of companies has been conducted to help clients understand the wider business environment as well as the strengths and weaknesses of key industry players. Data is qualitatively analyzed to categorize companies as pure play, category-focused, industry-focused, and diversified; it is quantitatively analyzed to categorize companies as dominant, leading, strong, tentative, and weak.

Recent Development and News in Molecular sieves market

  • In November 2024, BASF SE announced a significant investment to expand its production capacity for X3D catalyst shaping technology at its Ludwigshafen, Germany site, utilizing additive manufacturing to create catalysts with optimized shapes that enhance reactor performance and reduce energy consumption.
  • In December 2024, China Petroleum and Chemical Corporation (Sinopec) announced the mechanical completion of its Zhenhai Refinery's second-phase expansion, transforming it into China's largest petrochemical industrial base with a refinery capacity of 40 million tons per year.
  • In March 2025, Gujarat Alkalies and Chemicals Limited (GACL) inaugurated India's largest Chlorotoluene plant at Dahej, with an annual production capacity of 30,000 tonnes, boosting the country's manufacturing capacity for high-value chlorine-based chemicals.
  • In October 2025, Honeywell International Inc. announced a breakthrough technology, Biocrude Upgrading, which converts agricultural and forestry biomass into low-cost renewable marine fuel, gasoline, and sustainable aviation fuel (SAF), addressing feedstock availability and production cost challenges.

Dive into Technavio’s robust research methodology, blending expert interviews, extensive data synthesis, and validated models for unparalleled Molecular Sieves Market insights. See full methodology.

Market Scope
Page number 304
Base year 2025
Historic period 2020-2024
Forecast period 2026-2030
Growth momentum & CAGR Accelerate at a CAGR of 8%
Market growth 2026-2030 USD 2403.3 million
Market structure Fragmented
YoY growth 2025-2026(%) 6.6%
Key countries China, Japan, India, South Korea, Australia, Indonesia, Germany, UK, France, Italy, Spain, The Netherlands, US, Canada, Mexico, Brazil, Argentina, Colombia, Saudi Arabia, UAE, South Africa, Israel and Turkey
Competitive landscape Leading Companies, Market Positioning of Companies, Competitive Strategies, and Industry Risks

Request Free Sample

Research Analyst Overview

  • The molecular sieves market is defined by its critical role in enabling high-purity industrial processes through advanced materials like crystalline aluminosilicate and other zeolite adsorbents. The demand for precise gas stream purification and static dehydration is expanding, pushing innovation in materials with optimized pore size distribution and superior adsorption capacity.
  • Key technologies such as pressure swing adsorption and temperature swing adsorption are being refined to enhance performance. Boardroom decisions are increasingly influenced by the need for enhanced thermal stability and crush strength in adsorbents to ensure reliability in harsh operational environments.
  • For instance, the adoption of adsorbents with improved pore structure uniformity has allowed some operators to achieve a 20% reduction in regeneration cycle times. The market is also seeing growth in specialized applications, including the use of desiccant beads and cylindrical extrudates for solvent dehydration, biofuel dehydration, and industrial gas drying.
  • Materials designed for specific tasks like mercaptan removal, aromatics processing, and managing volatile organic compounds are becoming standard. This focus on customized solutions extends to moisture scavenger applications, air separation units, and oxygen concentrators, where performance and longevity are paramount.

What are the Key Data Covered in this Molecular Sieves Market Research and Growth Report?

  • What is the expected growth of the Molecular Sieves Market between 2026 and 2030?

    • USD 2.40 billion, at a CAGR of 8%

  • What segmentation does the market report cover?

    • The report is segmented by Grade Type (3A, 4A, 13X, and Others), End-user (Oil and gas industry, Petrochemical industry, Process industries, Construction industry, and Others), Type (Beads, Pellets, and Powder) and Geography (APAC, Europe, North America, South America, Middle East and Africa)

  • Which regions are analyzed in the report?

    • APAC, Europe, North America, South America and Middle East and Africa

  • What are the key growth drivers and market challenges?

    • Expanding demand from oil and gas refining and petrochemical processing, High production costs and energy-intensive manufacturing processes

  • Who are the major players in the Molecular Sieves Market?

    • Arkema Group, Axens Group, BASF SE, Brownell Ltd., CarboTech AC GmbH, FUJIFILM Holdings Corp., HengYe Inc., Honeywell International Inc., KURARAY Co. Ltd., Merck KGaA, Nanoshel LLC, Sorbchem India Pvt. Ltd., Vizag Chemical International, W. R. Grace and Co., Zeochem AG and ZR Catalyst Co. LTD.

Market Research Insights

  • The market's momentum is sustained by the integration of customized adsorption solutions that deliver measurable performance gains. The use of advanced separation materials improves industrial gas purification systems, with some operators reporting a 15% increase in throughput.
  • Adsorbent for natural gas treatment is critical for preventing hydrate formation, and high performance adsorbents can reduce operational downtime by up to 20% compared to conventional desiccants. The strategic application of synthetic zeolite adsorbents in air separation unit design enhances efficiency, lowering energy consumption by 10%.
  • Furthermore, zeolite for oxygen generation in medical devices ensures reliability, while molecular sieve for ethanol dehydration achieves the purity required for biofuels, underscoring the technology's role in advancing both industrial and green energy objectives.

We can help! Our analysts can customize this molecular sieves market research report to meet your requirements.

Get in touch

1. Executive Summary

1.1 Market overview

Executive Summary - Chart on Market Overview
Executive Summary - Data Table on Market Overview
Executive Summary - Chart on Global Market Characteristics
Executive Summary - Chart on Market by Geography
Executive Summary - Chart on Market Segmentation by Grade Type
Executive Summary - Chart on Market Segmentation by End-user
Executive Summary - Chart on Market Segmentation by Type
Executive Summary - Chart on Incremental Growth
Executive Summary - Data Table on Incremental Growth
Executive Summary - Chart on Company Market Positioning

2. Technavio Analysis

2.1 Analysis of price sensitivity, lifecycle, customer purchase basket, adoption rates, and purchase criteria

2.2 Criticality of inputs and Factors of differentiation

Chart on Overview on criticality of inputs and factors of differentiation

2.3 Factors of disruption

Chart on Overview on factors of disruption

2.4 Impact of drivers and challenges

Chart on Impact of drivers and challenges in 2025 and 2030

3. Market Landscape

3.1 Market ecosystem

Chart on Parent Market
Data Table on - Parent Market

3.2 Market characteristics

Chart on Market characteristics analysis

3.3 Value chain analysis

Chart on Value chain analysis

4. Market Sizing

4.1 Market definition

Data Table on Offerings of companies included in the market definition

4.2 Market segment analysis

Market segments

4.3 Market size 2025

4.4 Market outlook: Forecast for 2025-2030

Chart on Global - Market size and forecast 2025-2030 ($ million)
Data Table on Global - Market size and forecast 2025-2030 ($ million)
Chart on Global Market: Year-over-year growth 2025-2030 (%)
Data Table on Global Market: Year-over-year growth 2025-2030 (%)

5. Historic Market Size

5.1 Global Molecular Sieves Market 2020 - 2024

Historic Market Size - Data Table on Global Molecular Sieves Market 2020 - 2024 ($ million)

5.2 Grade Type segment analysis 2020 - 2024

Historic Market Size - Grade Type Segment 2020 - 2024 ($ million)

5.3 End-user segment analysis 2020 - 2024

Historic Market Size - End-user Segment 2020 - 2024 ($ million)

5.4 Type segment analysis 2020 - 2024

Historic Market Size - Type Segment 2020 - 2024 ($ million)

5.5 Geography segment analysis 2020 - 2024

Historic Market Size - Geography Segment 2020 - 2024 ($ million)

5.6 Country segment analysis 2020 - 2024

Historic Market Size - Country Segment 2020 - 2024 ($ million)

6. Qualitative Analysis

6.1 The AI impact on Global Molecular Sieves Market

7. Five Forces Analysis

7.1 Five forces summary

Five forces analysis - Comparison between 2025 and 2030

7.2 Bargaining power of buyers

Bargaining power of buyers - Impact of key factors 2025 and 2030

7.3 Bargaining power of suppliers

Bargaining power of suppliers - Impact of key factors in 2025 and 2030

7.4 Threat of new entrants

Threat of new entrants - Impact of key factors in 2025 and 2030

7.5 Threat of substitutes

Threat of substitutes - Impact of key factors in 2025 and 2030

7.6 Threat of rivalry

Threat of rivalry - Impact of key factors in 2025 and 2030

7.7 Market condition

Chart on Market condition - Five forces 2025 and 2030

8. Market Segmentation by Grade Type

8.1 Market segments

Chart on Grade Type - Market share 2025-2030 (%)
Data Table on Grade Type - Market share 2025-2030 (%)

8.2 Comparison by Grade Type

Chart on Comparison by Grade Type
Data Table on Comparison by Grade Type

8.3 3A - Market size and forecast 2025-2030

Chart on 3A - Market size and forecast 2025-2030 ($ million)
Data Table on 3A - Market size and forecast 2025-2030 ($ million)
Chart on 3A - Year-over-year growth 2025-2030 (%)
Data Table on 3A - Year-over-year growth 2025-2030 (%)

8.4 4A - Market size and forecast 2025-2030

Chart on 4A - Market size and forecast 2025-2030 ($ million)
Data Table on 4A - Market size and forecast 2025-2030 ($ million)
Chart on 4A - Year-over-year growth 2025-2030 (%)
Data Table on 4A - Year-over-year growth 2025-2030 (%)

8.5 13X - Market size and forecast 2025-2030

Chart on 13X - Market size and forecast 2025-2030 ($ million)
Data Table on 13X - Market size and forecast 2025-2030 ($ million)
Chart on 13X - Year-over-year growth 2025-2030 (%)
Data Table on 13X - Year-over-year growth 2025-2030 (%)

8.6 Others - Market size and forecast 2025-2030

Chart on Others - Market size and forecast 2025-2030 ($ million)
Data Table on Others - Market size and forecast 2025-2030 ($ million)
Chart on Others - Year-over-year growth 2025-2030 (%)
Data Table on Others - Year-over-year growth 2025-2030 (%)

8.7 Market opportunity by Grade Type

Market opportunity by Grade Type ($ million)
Data Table on Market opportunity by Grade Type ($ million)

9. Market Segmentation by End-user

9.1 Market segments

Chart on End-user - Market share 2025-2030 (%)
Data Table on End-user - Market share 2025-2030 (%)

9.2 Comparison by End-user

Chart on Comparison by End-user
Data Table on Comparison by End-user

9.3 Oil and gas industry - Market size and forecast 2025-2030

Chart on Oil and gas industry - Market size and forecast 2025-2030 ($ million)
Data Table on Oil and gas industry - Market size and forecast 2025-2030 ($ million)
Chart on Oil and gas industry - Year-over-year growth 2025-2030 (%)
Data Table on Oil and gas industry - Year-over-year growth 2025-2030 (%)

9.4 Petrochemical industry - Market size and forecast 2025-2030

Chart on Petrochemical industry - Market size and forecast 2025-2030 ($ million)
Data Table on Petrochemical industry - Market size and forecast 2025-2030 ($ million)
Chart on Petrochemical industry - Year-over-year growth 2025-2030 (%)
Data Table on Petrochemical industry - Year-over-year growth 2025-2030 (%)

9.5 Process industries - Market size and forecast 2025-2030

Chart on Process industries - Market size and forecast 2025-2030 ($ million)
Data Table on Process industries - Market size and forecast 2025-2030 ($ million)
Chart on Process industries - Year-over-year growth 2025-2030 (%)
Data Table on Process industries - Year-over-year growth 2025-2030 (%)

9.6 Construction industry - Market size and forecast 2025-2030

Chart on Construction industry - Market size and forecast 2025-2030 ($ million)
Data Table on Construction industry - Market size and forecast 2025-2030 ($ million)
Chart on Construction industry - Year-over-year growth 2025-2030 (%)
Data Table on Construction industry - Year-over-year growth 2025-2030 (%)

9.7 Others - Market size and forecast 2025-2030

Chart on Others - Market size and forecast 2025-2030 ($ million)
Data Table on Others - Market size and forecast 2025-2030 ($ million)
Chart on Others - Year-over-year growth 2025-2030 (%)
Data Table on Others - Year-over-year growth 2025-2030 (%)

9.8 Market opportunity by End-user

Market opportunity by End-user ($ million)
Data Table on Market opportunity by End-user ($ million)

10. Market Segmentation by Type

10.1 Market segments

Chart on Type - Market share 2025-2030 (%)
Data Table on Type - Market share 2025-2030 (%)

10.2 Comparison by Type

Chart on Comparison by Type
Data Table on Comparison by Type

10.3 Beads - Market size and forecast 2025-2030

Chart on Beads - Market size and forecast 2025-2030 ($ million)
Data Table on Beads - Market size and forecast 2025-2030 ($ million)
Chart on Beads - Year-over-year growth 2025-2030 (%)
Data Table on Beads - Year-over-year growth 2025-2030 (%)

10.4 Pellets - Market size and forecast 2025-2030

Chart on Pellets - Market size and forecast 2025-2030 ($ million)
Data Table on Pellets - Market size and forecast 2025-2030 ($ million)
Chart on Pellets - Year-over-year growth 2025-2030 (%)
Data Table on Pellets - Year-over-year growth 2025-2030 (%)

10.5 Powder - Market size and forecast 2025-2030

Chart on Powder - Market size and forecast 2025-2030 ($ million)
Data Table on Powder - Market size and forecast 2025-2030 ($ million)
Chart on Powder - Year-over-year growth 2025-2030 (%)
Data Table on Powder - Year-over-year growth 2025-2030 (%)

10.6 Market opportunity by Type

Market opportunity by Type ($ million)
Data Table on Market opportunity by Type ($ million)

11. Customer Landscape

11.1 Customer landscape overview

Analysis of price sensitivity, lifecycle, customer purchase basket, adoption rates, and purchase criteria

12. Geographic Landscape

12.1 Geographic segmentation

Chart on Market share by geography 2025-2030 (%)
Data Table on Market share by geography 2025-2030 (%)

12.2 Geographic comparison

Chart on Geographic comparison
Data Table on Geographic comparison

12.3 APAC - Market size and forecast 2025-2030

Chart on APAC - Market size and forecast 2025-2030 ($ million)
Data Table on APAC - Market size and forecast 2025-2030 ($ million)
Chart on APAC - Year-over-year growth 2025-2030 (%)
Data Table on APAC - Year-over-year growth 2025-2030 (%)
Chart on Regional Comparison - APAC
Data Table on Regional Comparison - APAC

12.3.1 China - Market size and forecast 2025-2030

Chart on China - Market size and forecast 2025-2030 ($ million)
Data Table on China - Market size and forecast 2025-2030 ($ million)
Chart on China - Year-over-year growth 2025-2030 (%)
Data Table on China - Year-over-year growth 2025-2030 (%)

12.3.2 Japan - Market size and forecast 2025-2030

Chart on Japan - Market size and forecast 2025-2030 ($ million)
Data Table on Japan - Market size and forecast 2025-2030 ($ million)
Chart on Japan - Year-over-year growth 2025-2030 (%)
Data Table on Japan - Year-over-year growth 2025-2030 (%)

12.3.3 India - Market size and forecast 2025-2030

Chart on India - Market size and forecast 2025-2030 ($ million)
Data Table on India - Market size and forecast 2025-2030 ($ million)
Chart on India - Year-over-year growth 2025-2030 (%)
Data Table on India - Year-over-year growth 2025-2030 (%)

12.3.4 South Korea - Market size and forecast 2025-2030

Chart on South Korea - Market size and forecast 2025-2030 ($ million)
Data Table on South Korea - Market size and forecast 2025-2030 ($ million)
Chart on South Korea - Year-over-year growth 2025-2030 (%)
Data Table on South Korea - Year-over-year growth 2025-2030 (%)

12.3.5 Australia - Market size and forecast 2025-2030

Chart on Australia - Market size and forecast 2025-2030 ($ million)
Data Table on Australia - Market size and forecast 2025-2030 ($ million)
Chart on Australia - Year-over-year growth 2025-2030 (%)
Data Table on Australia - Year-over-year growth 2025-2030 (%)

12.3.6 Indonesia - Market size and forecast 2025-2030

Chart on Indonesia - Market size and forecast 2025-2030 ($ million)
Data Table on Indonesia - Market size and forecast 2025-2030 ($ million)
Chart on Indonesia - Year-over-year growth 2025-2030 (%)
Data Table on Indonesia - Year-over-year growth 2025-2030 (%)

12.4 Europe - Market size and forecast 2025-2030

Chart on Europe - Market size and forecast 2025-2030 ($ million)
Data Table on Europe - Market size and forecast 2025-2030 ($ million)
Chart on Europe - Year-over-year growth 2025-2030 (%)
Data Table on Europe - Year-over-year growth 2025-2030 (%)
Chart on Regional Comparison - Europe
Data Table on Regional Comparison - Europe

12.4.1 Germany - Market size and forecast 2025-2030

Chart on Germany - Market size and forecast 2025-2030 ($ million)
Data Table on Germany - Market size and forecast 2025-2030 ($ million)
Chart on Germany - Year-over-year growth 2025-2030 (%)
Data Table on Germany - Year-over-year growth 2025-2030 (%)

12.4.2 UK - Market size and forecast 2025-2030

Chart on UK - Market size and forecast 2025-2030 ($ million)
Data Table on UK - Market size and forecast 2025-2030 ($ million)
Chart on UK - Year-over-year growth 2025-2030 (%)
Data Table on UK - Year-over-year growth 2025-2030 (%)

12.4.3 France - Market size and forecast 2025-2030

Chart on France - Market size and forecast 2025-2030 ($ million)
Data Table on France - Market size and forecast 2025-2030 ($ million)
Chart on France - Year-over-year growth 2025-2030 (%)
Data Table on France - Year-over-year growth 2025-2030 (%)

12.4.4 Italy - Market size and forecast 2025-2030

Chart on Italy - Market size and forecast 2025-2030 ($ million)
Data Table on Italy - Market size and forecast 2025-2030 ($ million)
Chart on Italy - Year-over-year growth 2025-2030 (%)
Data Table on Italy - Year-over-year growth 2025-2030 (%)

12.4.5 Spain - Market size and forecast 2025-2030

Chart on Spain - Market size and forecast 2025-2030 ($ million)
Data Table on Spain - Market size and forecast 2025-2030 ($ million)
Chart on Spain - Year-over-year growth 2025-2030 (%)
Data Table on Spain - Year-over-year growth 2025-2030 (%)

12.4.6 The Netherlands - Market size and forecast 2025-2030

Chart on The Netherlands - Market size and forecast 2025-2030 ($ million)
Data Table on The Netherlands - Market size and forecast 2025-2030 ($ million)
Chart on The Netherlands - Year-over-year growth 2025-2030 (%)
Data Table on The Netherlands - Year-over-year growth 2025-2030 (%)

12.5 North America - Market size and forecast 2025-2030

Chart on North America - Market size and forecast 2025-2030 ($ million)
Data Table on North America - Market size and forecast 2025-2030 ($ million)
Chart on North America - Year-over-year growth 2025-2030 (%)
Data Table on North America - Year-over-year growth 2025-2030 (%)
Chart on Regional Comparison - North America
Data Table on Regional Comparison - North America

12.5.1 US - Market size and forecast 2025-2030

Chart on US - Market size and forecast 2025-2030 ($ million)
Data Table on US - Market size and forecast 2025-2030 ($ million)
Chart on US - Year-over-year growth 2025-2030 (%)
Data Table on US - Year-over-year growth 2025-2030 (%)

12.5.2 Canada - Market size and forecast 2025-2030

Chart on Canada - Market size and forecast 2025-2030 ($ million)
Data Table on Canada - Market size and forecast 2025-2030 ($ million)
Chart on Canada - Year-over-year growth 2025-2030 (%)
Data Table on Canada - Year-over-year growth 2025-2030 (%)

12.5.3 Mexico - Market size and forecast 2025-2030

Chart on Mexico - Market size and forecast 2025-2030 ($ million)
Data Table on Mexico - Market size and forecast 2025-2030 ($ million)
Chart on Mexico - Year-over-year growth 2025-2030 (%)
Data Table on Mexico - Year-over-year growth 2025-2030 (%)

12.6 South America - Market size and forecast 2025-2030

Chart on South America - Market size and forecast 2025-2030 ($ million)
Data Table on South America - Market size and forecast 2025-2030 ($ million)
Chart on South America - Year-over-year growth 2025-2030 (%)
Data Table on South America - Year-over-year growth 2025-2030 (%)
Chart on Regional Comparison - South America
Data Table on Regional Comparison - South America

12.6.1 Brazil - Market size and forecast 2025-2030

Chart on Brazil - Market size and forecast 2025-2030 ($ million)
Data Table on Brazil - Market size and forecast 2025-2030 ($ million)
Chart on Brazil - Year-over-year growth 2025-2030 (%)
Data Table on Brazil - Year-over-year growth 2025-2030 (%)

12.6.2 Argentina - Market size and forecast 2025-2030

Chart on Argentina - Market size and forecast 2025-2030 ($ million)
Data Table on Argentina - Market size and forecast 2025-2030 ($ million)
Chart on Argentina - Year-over-year growth 2025-2030 (%)
Data Table on Argentina - Year-over-year growth 2025-2030 (%)

12.6.3 Colombia - Market size and forecast 2025-2030

Chart on Colombia - Market size and forecast 2025-2030 ($ million)
Data Table on Colombia - Market size and forecast 2025-2030 ($ million)
Chart on Colombia - Year-over-year growth 2025-2030 (%)
Data Table on Colombia - Year-over-year growth 2025-2030 (%)

12.7 Middle East and Africa - Market size and forecast 2025-2030

Chart on Middle East and Africa - Market size and forecast 2025-2030 ($ million)
Data Table on Middle East and Africa - Market size and forecast 2025-2030 ($ million)
Chart on Middle East and Africa - Year-over-year growth 2025-2030 (%)
Data Table on Middle East and Africa - Year-over-year growth 2025-2030 (%)
Chart on Regional Comparison - Middle East and Africa
Data Table on Regional Comparison - Middle East and Africa

12.7.1 Saudi Arabia - Market size and forecast 2025-2030

Chart on Saudi Arabia - Market size and forecast 2025-2030 ($ million)
Data Table on Saudi Arabia - Market size and forecast 2025-2030 ($ million)
Chart on Saudi Arabia - Year-over-year growth 2025-2030 (%)
Data Table on Saudi Arabia - Year-over-year growth 2025-2030 (%)

12.7.2 UAE - Market size and forecast 2025-2030

Chart on UAE - Market size and forecast 2025-2030 ($ million)
Data Table on UAE - Market size and forecast 2025-2030 ($ million)
Chart on UAE - Year-over-year growth 2025-2030 (%)
Data Table on UAE - Year-over-year growth 2025-2030 (%)

12.7.3 South Africa - Market size and forecast 2025-2030

Chart on South Africa - Market size and forecast 2025-2030 ($ million)
Data Table on South Africa - Market size and forecast 2025-2030 ($ million)
Chart on South Africa - Year-over-year growth 2025-2030 (%)
Data Table on South Africa - Year-over-year growth 2025-2030 (%)

12.7.4 Israel - Market size and forecast 2025-2030

Chart on Israel - Market size and forecast 2025-2030 ($ million)
Data Table on Israel - Market size and forecast 2025-2030 ($ million)
Chart on Israel - Year-over-year growth 2025-2030 (%)
Data Table on Israel - Year-over-year growth 2025-2030 (%)

12.7.5 Turkey - Market size and forecast 2025-2030

Chart on Turkey - Market size and forecast 2025-2030 ($ million)
Data Table on Turkey - Market size and forecast 2025-2030 ($ million)
Chart on Turkey - Year-over-year growth 2025-2030 (%)
Data Table on Turkey - Year-over-year growth 2025-2030 (%)

12.8 Market opportunity by geography

Market opportunity by geography ($ million)
Data Tables on Market opportunity by geography ($ million)

13. Drivers, Challenges, and Opportunity

13.1 Market drivers

Expanding demand from oil and gas refining and petrochemical processing
Growing use in industrial gas drying and air separation applications
Rising adoption in environmental protection and sustainable processing technologies

13.2 Market challenges

High production costs and energy-intensive manufacturing processes
Performance degradation and limited-service life in harsh operating conditions
Competition from alternative separation and adsorption technologies

13.3 Impact of drivers and challenges

Impact of drivers and challenges in 2025 and 2030

13.4 Market opportunities

Increasing adoption of molecular sieves in high-purity and specialty applications
Growing integration of molecular sieves in energy transition and clean fuel technologies
Technological advancements in customized and application specific molecular sieves

14. Competitive Landscape

14.1 Overview

14.2

Overview on criticality of inputs and factors of differentiation

14.3 Landscape disruption

Overview on factors of disruption

14.4 Industry risks

Impact of key risks on business

15. Competitive Analysis

15.1 Companies profiled

Companies covered

15.2 Company ranking index

15.3 Market positioning of companies

Matrix on companies position and classification

15.4 Arkema Group

Arkema Group - Overview
Arkema Group - Business segments
Arkema Group - Key news
Arkema Group - Key offerings
Arkema Group - Segment focus
SWOT

15.5 Axens Group

Axens Group - Overview
Axens Group - Product / Service
Axens Group - Key offerings
SWOT

15.6 BASF SE

BASF SE - Overview
BASF SE - Business segments
BASF SE - Key news
BASF SE - Key offerings
BASF SE - Segment focus
SWOT

15.7 Brownell Ltd.

Brownell Ltd. - Overview
Brownell Ltd. - Product / Service
Brownell Ltd. - Key offerings
SWOT

15.8 CarboTech AC GmbH

CarboTech AC GmbH - Overview
CarboTech AC GmbH - Product / Service
CarboTech AC GmbH - Key offerings
SWOT

15.9 FUJIFILM Holdings Corp.

FUJIFILM Holdings Corp. - Overview
FUJIFILM Holdings Corp. - Business segments
FUJIFILM Holdings Corp. - Key news
FUJIFILM Holdings Corp. - Key offerings
FUJIFILM Holdings Corp. - Segment focus
SWOT

15.10 HengYe Inc.

HengYe Inc. - Overview
HengYe Inc. - Product / Service
HengYe Inc. - Key offerings
SWOT

15.11 Honeywell International Inc.

Honeywell International Inc. - Overview
Honeywell International Inc. - Business segments
Honeywell International Inc. - Key news
Honeywell International Inc. - Key offerings
Honeywell International Inc. - Segment focus
SWOT

15.12 KURARAY Co. Ltd.

KURARAY Co. Ltd. - Overview
KURARAY Co. Ltd. - Business segments
KURARAY Co. Ltd. - Key news
KURARAY Co. Ltd. - Key offerings
KURARAY Co. Ltd. - Segment focus
SWOT

15.13 Merck KGaA

Merck KGaA - Overview
Merck KGaA - Business segments
Merck KGaA - Key news
Merck KGaA - Key offerings
Merck KGaA - Segment focus
SWOT

15.14 Sorbchem India Pvt. Ltd.

Sorbchem India Pvt. Ltd. - Overview
Sorbchem India Pvt. Ltd. - Product / Service
Sorbchem India Pvt. Ltd. - Key offerings
SWOT

15.15 Vizag Chemical International

Vizag Chemical International - Overview
Vizag Chemical International - Product / Service
Vizag Chemical International - Key offerings
SWOT

15.16 W. R. Grace and Co.

W. R. Grace and Co. - Overview
W. R. Grace and Co. - Product / Service
W. R. Grace and Co. - Key offerings
SWOT

15.17 Zeochem AG

Zeochem AG - Overview
Zeochem AG - Product / Service
Zeochem AG - Key offerings
SWOT

15.18 ZR Catalyst Co. LTD.

ZR Catalyst Co. LTD. - Overview
ZR Catalyst Co. LTD. - Product / Service
ZR Catalyst Co. LTD. - Key offerings
SWOT

16. Appendix

16.1 Scope of the report

Market definition
Objectives
Notes and caveats

16.2 Inclusions and exclusions checklist

Inclusions checklist
Exclusions checklist

16.3 Currency conversion rates for US$

16.4 Research methodology

16.5 Data procurement

Information sources

16.6 Data validation

16.7 Validation techniques employed for market sizing

16.8 Data synthesis

16.9 360 degree market analysis

16.10 List of abbreviations

Research Methodology

Technavio presents a detailed picture of the market by way of study, synthesis, and summation of data from multiple sources. The analysts have presented the various facets of the market with a particular focus on identifying the key industry influencers. The data thus presented is comprehensive, reliable, and the result of extensive research, both primary and secondary.

INFORMATION SOURCES

Primary sources

  • Manufacturers and suppliers
  • Channel partners
  • Industry experts
  • Strategic decision makers

Secondary sources

  • Industry journals and periodicals
  • Government data
  • Financial reports of key industry players
  • Historical data
  • Press releases

DATA ANALYSIS

Data Synthesis

  • Collation of data
  • Estimation of key figures
  • Analysis of derived insights

Data Validation

  • Triangulation with data models
  • Reference against proprietary databases
  • Corroboration with industry experts

REPORT WRITING

Qualitative

  • Market drivers
  • Market challenges
  • Market trends
  • Five forces analysis

Quantitative

  • Market size and forecast
  • Market segmentation
  • Geographical insights
  • Competitive landscape

Interested in this report?

Get your sample now to see our research methodology and insights!

Download Now

Frequently Asked Questions

Molecular Sieves market growth will increase by USD 2403.3 million during 2026-2030.

The Molecular Sieves market is expected to grow at a CAGR of 8% during 2026-2030.

Molecular Sieves market is segmented by Grade type (3A, 4A, 13X, Others) End-user (Oil and gas industry, Petrochemical industry, Process industries, Construction industry, Others) Type (Beads, Pellets, Powder)

Arkema Group, Axens Group, BASF SE, Brownell Ltd., CarboTech AC GmbH, FUJIFILM Holdings Corp., HengYe Inc., Honeywell International Inc., KURARAY Co. Ltd., Merck KGaA, Nanoshel LLC, Sorbchem India Pvt. Ltd., Vizag Chemical International, W. R. Grace and Co., Zeochem AG, ZR Catalyst Co. LTD. are a few of the key vendors in the Molecular Sieves market.

APAC will register the highest growth rate of 45% among the other regions. Therefore, the Molecular Sieves market in APAC is expected to garner significant business opportunities for the vendors during the forecast period.

China, Japan, India, South Korea, Australia, Indonesia, Germany, UK, France, Italy, Spain, The Netherlands, US, Canada, Mexico, Brazil, Argentina, Colombia, Saudi Arabia, UAE, South Africa, Israel, Turkey

  • Expanding demand from oil and gas refining and petrochemical processing is the driving factor this market.

The Molecular Sieves market vendors should focus on grabbing business opportunities from the Grade type segment as it accounted for the largest market share in the base year.
RIA - Research AI Assistant
Ask RIA