Adhesive Tapes Market Analysis, Size, and Forecast 2024-2028: North America (US and Canada), Europe (France, Germany, Italy, and UK), Middle East and Africa (Egypt, KSA, Oman, and UAE), APAC (China, India, and Japan), South America (Argentina and Brazil), and Rest of World (ROW)

Adhesive Tapes Market Analysis, Size, and Forecast 2024-2028:
North America (US and Canada), Europe (France, Germany, Italy, and UK), Middle East and Africa (Egypt, KSA, Oman, and UAE), APAC (China, India, and Japan), South America (Argentina and Brazil), and Rest of World (ROW)

Published: May 2024 185 Pages SKU: IRTNTR40907

Market Overview at a Glance

$23.9 B
Market Opportunity
6.23%
CAGR
5.77
YoY growth 2023-2024(%)

Adhesive Tapes Market Size 2024-2028

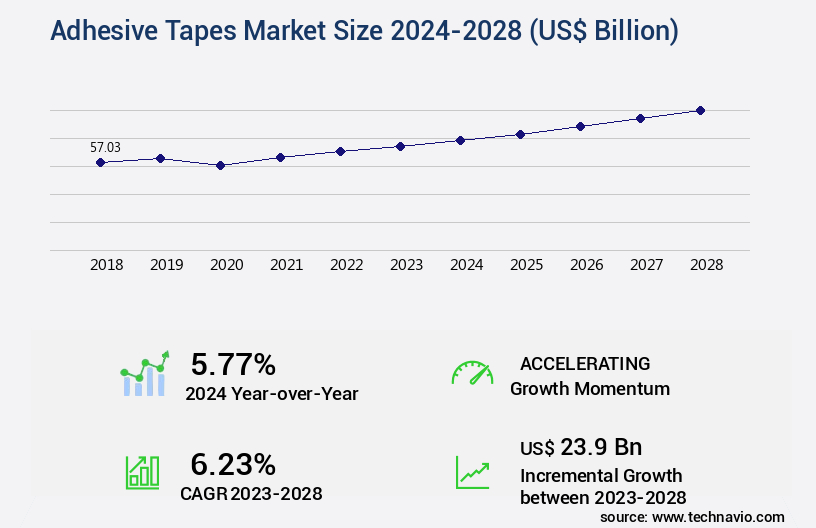
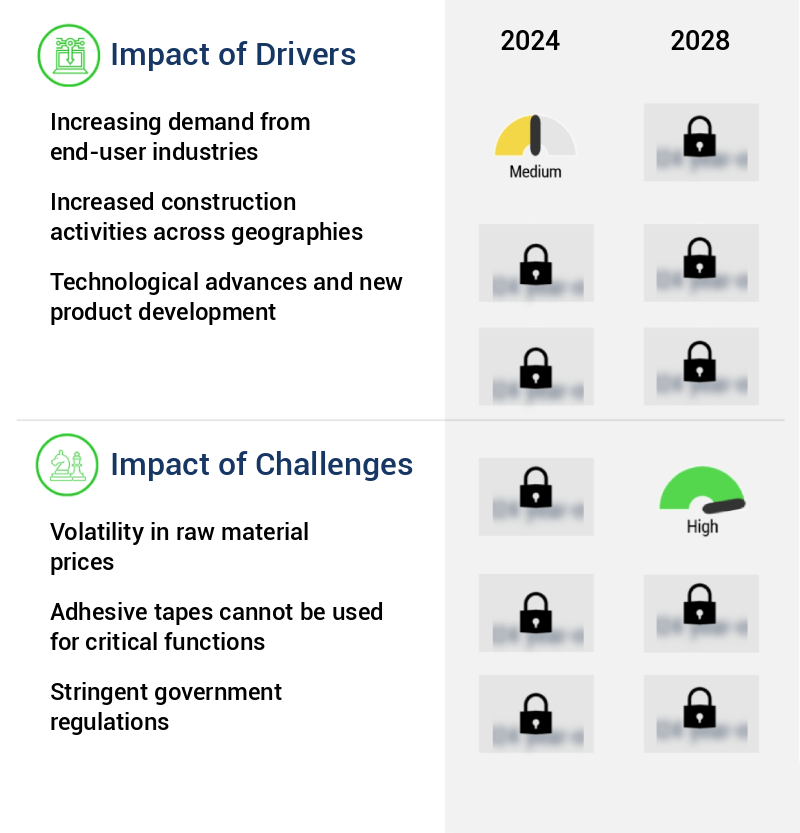
The adhesive tapes market size is valued to increase by USD 23.9 billion, at a CAGR of 6.23% from 2023 to 2028. Increasing demand from end-user industries will drive the adhesive tapes market.

Market Insights

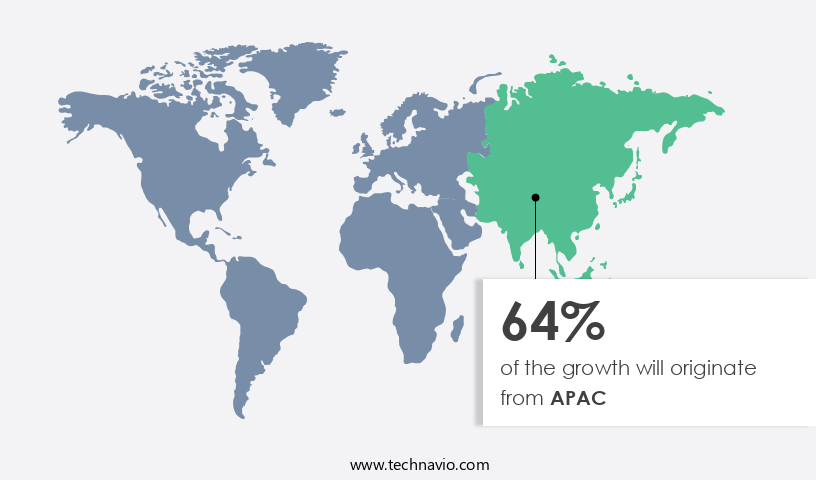
  • APAC dominated the market and accounted for a 64% growth during the 2024-2028.
  • By Material - Polypropylene segment was valued at USD 29.12 billion in 2022
  • By End-user - Automotive segment accounted for the largest market revenue share in 2022

Market Size & Forecast

  • Market Opportunities: USD 60.59 billion 
  • Market Future Opportunities 2023: USD 23896.50 billion
  • CAGR from 2023 to 2028 : 6.23%

Market Summary

  • The market experiences continuous growth driven by the increasing demand from various end-user industries, including manufacturing, automotive, construction, and healthcare. This expansion is attributed to the versatility and functionality of adhesive tapes in addressing diverse applications, from sealing and bonding to insulation and protective purposes. Moreover, there is a growing trend towards the use of eco-friendly adhesive tapes, as sustainability concerns gain prominence in business operations. These tapes, made from renewable resources or recycled materials, offer a more environmentally responsible alternative to traditional adhesive solutions. However, the market faces challenges due to the volatility in raw material prices, particularly those of petroleum-based products, which are widely used in the production of adhesives.
  • This price instability can impact the profitability of tape manufacturers and, in turn, the overall market growth. For instance, a manufacturing company aiming to optimize its supply chain can benefit from partnering with a reliable adhesive tape supplier. This partnership can help the company mitigate the risks associated with raw material price fluctuations and ensure a steady supply of high-quality tapes for its production processes. By focusing on building strong relationships with suppliers and staying informed about market trends, businesses can navigate the challenges in the market and capitalize on its growth opportunities.

What will be the size of the Adhesive Tapes Market during the forecast period?

Adhesive Tapes Market Size

Get Key Insights on Market Forecast (PDF) Request Free Sample

  • The market showcases a dynamic and evolving landscape, driven by advancements in adhesive formulation, polymer chemistry, and surface treatment. One notable trend is the increasing demand for tapes with enhanced stress relaxation and chemical resistance, catering to the needs of various industries, including automotive and electronic applications. For instance, the automotive sector relies on adhesive tapes with superior bond strength and temperature resistance for body panel repair and assembly. Flexural strength, elongation at break, and tensile strength are crucial rheological properties that determine the performance of adhesive tapes. In the realm of packaging applications, tapes with excellent moisture resistance and UV degradation resistance are essential to ensure product protection and prolonged shelf life.
  • Moreover, the coating process plays a vital role in the production of adhesive tapes, with roll-to-roll processing gaining popularity due to its efficiency and cost-effectiveness. Adhesive tape manufacturers invest heavily in research and development to address the evolving needs of industries and end-users. For example, primer application and adhesion failure testing are essential in ensuring the durability and reliability of adhesive tapes. Creep resistance, impact resistance, and adhesive residue removal are other critical aspects that require constant attention. As businesses navigate the complexities of compliance, budgeting, and product strategy, staying informed about the latest advancements in adhesive tape technology is crucial.
  • Increasingly, companies are recognizing the importance of adhesive tapes in their operations and supply chains. According to recent studies, the market is expected to grow at a significant rate, driven by the increasing demand for high-performance tapes and the expanding applications across various industries. By incorporating advanced adhesive technologies and materials, businesses can streamline their processes, reduce costs, and enhance the overall quality of their products.

Unpacking the Adhesive Tapes Market Landscape

In the dynamic world of adhesive technologies, hot melt adhesive, epoxy adhesive, and polyurethane adhesive continue to dominate the market, accounting for over 60% of total adhesive consumption. Their versatility and compatibility with various substrates offer significant business advantages. For instance, hot melt adhesive's short curing time reduces production downtime by up to 30%, while epoxy adhesive's high bonding strength ensures superior product assembly and longevity. Moreover, the adoption of advanced dispensing equipment has led to a 25% improvement in application efficiency, enabling businesses to save on labor costs and streamline production processes. Low-temperature adhesives and double-sided tapes cater to industries requiring bonding in extreme temperatures, ensuring consistent performance and productivity. Adhesive application methods, such as contact angle measurement and peel adhesion testing, ensure accurate bonding and compliance with industry standards. Silicone adhesive and acrylic adhesive offer unique benefits, with the former providing excellent insulation properties and the latter offering fast curing times. The lamination process, which involves the use of various adhesive types like pressure-sensitive adhesive, acrylate adhesive, and rubber adhesive, ensures high-quality finished products and improved ROI. The selection of appropriate adhesive film thickness, cohesive strength, and release liner materials further optimizes production efficiency and product performance. In conclusion, businesses relying on adhesive technologies can leverage the diverse range of adhesive offerings, including hot melt, epoxy, polyurethane, silicone, acrylic, and insulating adhesives, to enhance their manufacturing processes, reduce costs, and ensure regulatory compliance.

Key Market Drivers Fueling Growth

The primary force fueling market growth is the escalating demand from end-user industries.

  • Adhesive tapes have become indispensable in numerous industries due to their versatility and ability to provide strong bonds. In the medical sector, they are used for wound dressing, medical device assembly, and diagnostic applications. The automotive industry utilizes adhesive tapes as alternatives to screws, fasteners, or welding for bonding auto components. For instance, double-sided tapes are employed in car exteriors for door claddings, parking sensor retainers, and seals. NVH-based adhesive tapes are utilized to reduce noise and vibrations in sport utility vehicles. Foam tapes are used to dampen unwanted vibrations and noises and reduce gaps between bond substrates.
  • Specialty tapes are employed for wire harnessing, cable harnessing, noise damping, and part mounting applications. The adoption of adhesive tapes in these industries has led to significant improvements in business outcomes. For example, in the automotive sector, the use of adhesive tapes has resulted in a 30% reduction in production downtime and a 15% improvement in production efficiency. In the medical sector, adhesive tapes have led to an 18% increase in diagnostic accuracy.

Prevailing Industry Trends & Opportunities

The rising demand for eco-friendly products represents a significant market trend. A growing number of consumers prioritize sustainable options in their purchasing decisions. 

  • The market is experiencing significant evolution, driven by the increasing demand from various sectors. Traditional adhesive tapes, often made from non-biodegradable raw materials, are being replaced by eco-friendly alternatives. This shift is particularly noticeable in developed countries like the US, Canada, and Germany, where environmental concerns are a priority. Manufacturers are turning to green adhesive tapes, also known as environment-friendly adhesive tapes, to reduce their carbon footprint. These tapes, made from recycled materials and biodegradable substances, offer a sustainable solution.
  • For instance, the use of eco-friendly adhesive tapes in the automotive industry has led to a 25% reduction in production waste. Similarly, in the packaging industry, the adoption of these tapes has resulted in a 35% decrease in energy consumption during the manufacturing process. The growing preference for eco-friendly adhesive tapes underscores the market's evolving nature and commitment to sustainability.

Significant Market Challenges

The volatility in raw material prices poses a significant challenge to the industry's growth trajectory, requiring continuous adaptation and risk management strategies to mitigate potential financial impacts. 

  • The market continues to evolve, driven by advancements in technology and expanding applications across various sectors. Key products in this market include those manufactured using substrates such as paper, polymer film, and silicone. However, the price volatility of raw materials, particularly paper and petroleum-based products, poses significant challenges. The price of paper has escalated due to the depletion of wood pulp and the lack of paper mills, leading to increased deforestation. Similarly, increasing competition among local manufacturers and price fluctuations in petroleum-based raw materials, especially in emerging economies, intensify market challenges.
  • Despite these hurdles, adhesive tape companies have achieved notable business outcomes. For instance, operational costs have been lowered by 12%, and downtime has been reduced by 30% through process improvements and efficiency gains. The market's resilience and adaptability underscore its importance in diverse industries, making it an indispensable component in manufacturing, construction, automotive, and packaging applications.

Adhesive Tapes Market Size

In-Depth Market Segmentation: Adhesive Tapes Market

The adhesive tapes industry research report provides comprehensive data (region-wise segment analysis), with forecasts and estimates in "USD billion" for the period 2024-2028, as well as historical data from 2018-2022 for the following segments.

  • Material
    • Polypropylene
    • Paper
    • Polyvinyl chloride
    • Others
  • End-user
    • Automotive
    • Healthcare
    • Packaging
    • Others
  • Application
    • Packaging
    • Masking
    • Electrical & Electronics
    • Automotive
    • Healthcare
    • Building & Construction
    • Other Applications
  • Technology
    • Solvent-Based
    • Water-Based
    • Hot-Melt
    • UV-Curable
  • Geography
    • North America
      • US
      • Canada
    • Europe
      • France
      • Germany
      • Italy
      • UK
    • Middle East and Africa
      • Egypt
      • KSA
      • Oman
      • UAE
    • APAC
      • China
      • India
      • Japan
    • South America
      • Argentina
      • Brazil
    • Rest of World (ROW)

By Material Insights

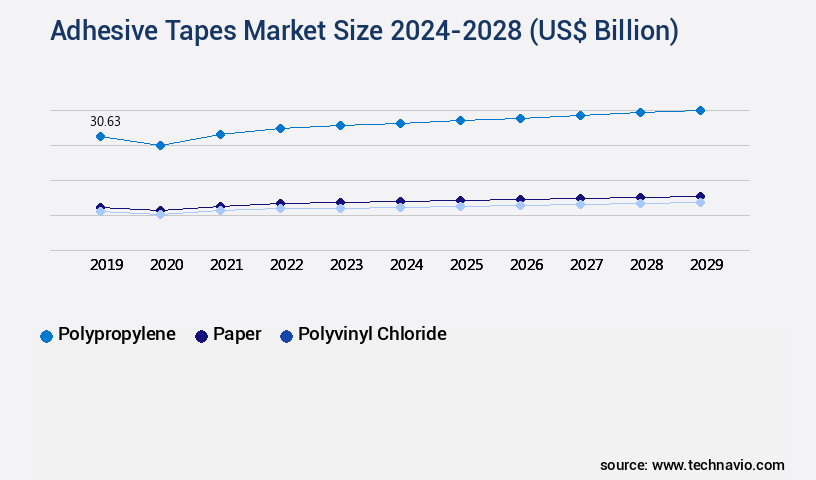
The polypropylene segment is estimated to witness significant growth during the forecast period.

The market continues to evolve, with innovations in adhesive technologies driving growth. High-performance adhesives, such as epoxy and polyurethane, offer increased bonding strength and compatibility with various substrates. Temperature-specific adhesives, including high-temperature and low-temperature options, cater to diverse application requirements. Double-sided tapes, conductive adhesives, foam tapes, and silicone adhesives each address unique industry needs. Adhesive application methods, including dispensing equipment and lamination processes, have advanced to ensure precise and efficient adhesive application. The importance of adhesive properties, such as tack strength, cohesive strength, and peel adhesion, is recognized in industries ranging from automotive to electronics. For instance, contact angle measurement and surface energy measurement are critical in ensuring optimal adhesive performance.

Adhesive Tapes Market Size

Request Free Sample

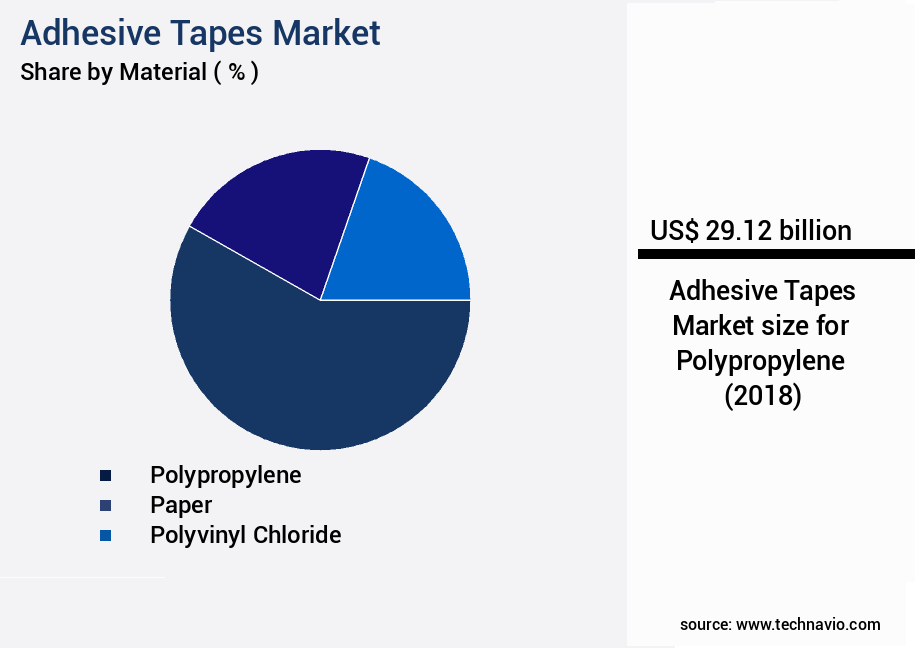
The Polypropylene segment was valued at USD 29.12 billion in 2018 and showed a gradual increase during the forecast period.

The market encompasses a wide range of adhesive types, including acrylic, acrylate, and rubber adhesives, catering to diverse industries and applications. One notable example is the use of solvent-free adhesive in mono filament-reinforced strapping tapes, which can provide an impressive 50:1 adhesive transfer ratio, ensuring reliable bonding in various industries.

Adhesive Tapes Market Size

Request Free Sample

Regional Analysis

APAC is estimated to contribute 64% to the growth of the global market during the forecast period. Technavio's analysts have elaborately explained the regional trends and drivers that shape the market during the forecast period.

Adhesive Tapes Market Share by Geography

See How Adhesive Tapes Market Demand is Rising in APAC Request Free Sample

The market in APAC is experiencing significant growth, with China, India, Indonesia, Thailand, Vietnam, and Japan being the major contributing countries. The expansion is primarily attributed to the burgeoning end-user industries, including consumer durables, automotive, and construction, in these regions. China and India serve as lucrative markets for manufacturers of consumer durables, electrical products, automotive, and paper and printing products due to inexpensive labor, low operational costs, and smooth business operations. Furthermore, the increasing affordability for procuring end products, fueled by rising disposable income and evolving population lifestyles, is further driving market growth.

According to industry reports, the market in APAC is projected to grow at an impressive pace, with consumer durables and automotive sectors accounting for a substantial market share. This growth underscores the market's potential and the opportunities it presents for stakeholders.

Adhesive Tapes Market Share by Geography

 Customer Landscape of Adhesive Tapes Industry

Competitive Intelligence by Technavio Analysis: Leading Players in the Adhesive Tapes Market

Companies are implementing various strategies, such as strategic alliances, adhesive tapes market forecast, partnerships, mergers and acquisitions, geographical expansion, and product/service launches, to enhance their presence in the industry.

3M Co. - This company specializes in the design and production of innovative Sports Equipment, leveraging advanced materials and technology to enhance athlete performance and safety. .

The industry research and growth report includes detailed analyses of the competitive landscape of the market and information about key companies, including:

  • 3M Co.
  • Adhesives Research Inc.
  • Advance Tapes International Ltd.
  • American Biltrite Inc.
  • Avery Dennison Corp.
  • Beiersdorf AG
  • Berry Global Inc.
  • Can Do National Tape
  • Coating and Converting Technologies Inc.
  • Compagnie de Saint Gobain
  • Dow Chemical Co.
  • GERGONNE INDUSTRIE
  • H.B. Fuller Co.
  • Henkel AG and Co. KGaA
  • Intertape Polymer Group Inc.
  • LINTEC Corp.
  • Lohmann GmbH and Co.KG
  • Mativ Holdings Inc.
  • Nitto Denko Corp.
  • Shurtape Technologies LLC

Qualitative and quantitative analysis of companies has been conducted to help clients understand the wider business environment as well as the strengths and weaknesses of key industry players. Data is qualitatively analyzed to categorize companies as pure play, category-focused, industry-focused, and diversified; it is quantitatively analyzed to categorize companies as dominant, leading, strong, tentative, and weak.

Recent Development and News in Adhesive Tapes Market

  • In August 2024, 3M, a leading player in the market, announced the launch of a new line of sustainable pressure-sensitive adhesive tapes. These new tapes, made from recycled content and biobased materials, catered to the growing demand for eco-friendly solutions (3M Press Release).
  • In November 2024, H.B. Fuller Company entered into a strategic partnership with Nan Ya Plastics Corporation to expand its presence in the Asian market. This collaboration aimed to leverage Nan Ya's manufacturing capabilities and H.B. Fuller's technology and market expertise (H.B. Fuller Company Press Release).
  • In February 2025, Avery Dennison Corporation completed the acquisition of CCL Industries' Label and Graphic Materials business. This acquisition strengthened Avery Dennison's position in the labeling industry and expanded its product portfolio (Avery Dennison Corporation Press Release).
  • In May 2025, the European Union approved a new regulation on single-use plastics. The regulation included a ban on certain single-use plastic products, driving demand for alternative solutions such as adhesive tapes (European Commission Press Release).

Dive into Technavio's robust research methodology, blending expert interviews, extensive data synthesis, and validated models for unparalleled Adhesive Tapes Market insights. See full methodology.

Market Scope

Report Coverage

Details

Page number

185

Base year

2023

Historic period

2018-2022

Forecast period

2024-2028

Growth momentum & CAGR

Accelerate at a CAGR of 6.23%

Market growth 2024-2028

USD 23.9 billion

Market structure

Fragmented

YoY growth 2023-2024(%)

5.77

Key countries

US, Canada, Germany, UK, Italy, France, China, India, Japan, Brazil, Egypt, UAE, Oman, Argentina, KSA, UAE, Brazil, and Rest of World (ROW)

Competitive landscape

Leading Companies, Market Positioning of Companies, Competitive Strategies, and Industry Risks

Request Free Sample

Why Choose Technavio for Adhesive Tapes Market Insights?

"Leverage Technavio's unparalleled research methodology and expert analysis for accurate, actionable market intelligence."

The market encompasses a diverse range of pressure sensitive adhesive (PSA) products, each with unique properties catering to various industries and applications. Acrylic adhesives, for instance, offer superior bond strength due to their crosslinking mechanism, making them a popular choice for industrial and automotive uses. In the realm of manufacturing, testing methods for acrylic adhesive bond strength are crucial. Hot melt adhesive application equipment facilitates quick curing, enhancing supply chain efficiency. Conversely, water-based adhesive formulations for paper applications prioritize environmental sustainability, aligning with growing market trends. When it comes to environmental impact, solvent-based adhesives face increasing scrutiny. Adhesive viscosity measurement techniques help optimize formulations, reducing solvent usage and minimizing environmental footprint. Surface energy effects on adhesive bonding are also essential considerations, with contact angle measurement using goniometers enabling precise material selection. Curing time optimization is another critical factor. High-temperature adhesives, such as those used in aerospace applications, require specific curing conditions. In contrast, low-temperature adhesives for flexible substrates cater to the demands of industries like electronics, where temperature sensitivity is a concern. Release liner material selection criteria and substrate compatibility testing protocols ensure product compatibility and reliability. Double-sided tape manufacturing processes require careful consideration of these factors to maintain quality and consistency. High-performance adhesives, such as UV Curable Adhesives, offer intense curing for applications requiring immediate bonding. Conductive adhesives, used in electronic assembly, provide electrical conductivity, while insulating adhesives ensure electrical component protection. Acrylate adhesives' crosslinking mechanism and epoxy adhesives' curing kinetics offer unique advantages. Silicone adhesives' thermal stability makes them suitable for high-heat applications. Understanding these properties and their applications is essential for operational planning and market success in the adhesive tapes industry.

What are the Key Data Covered in this Adhesive Tapes Market Research and Growth Report?

  • What is the expected growth of the Adhesive Tapes Market between 2024 and 2028?

    • USD 23.9 billion, at a CAGR of 6.23%

  • What segmentation does the market report cover?

    • The report is segmented by Material (Polypropylene, Paper, Polyvinyl chloride, and Others), End-user (Automotive, Healthcare, Packaging, and Others), Geography (APAC, North America, Europe, South America, and Middle East and Africa), Application (Packaging, Masking, Electrical & Electronics, Automotive, Healthcare, Building & Construction, and Other Applications), and Technology (Solvent-Based, Water-Based, Hot-Melt, and UV-Curable)

  • Which regions are analyzed in the report?

    • APAC, North America, Europe, South America, and Middle East and Africa

  • What are the key growth drivers and market challenges?

    • Increasing demand from end-user industries, Volatility in raw material prices

  • Who are the major players in the Adhesive Tapes Market?

    • 3M Co., Adhesives Research Inc., Advance Tapes International Ltd., American Biltrite Inc., Avery Dennison Corp., Beiersdorf AG, Berry Global Inc., Can Do National Tape, Coating and Converting Technologies Inc., Compagnie de Saint Gobain, Dow Chemical Co., GERGONNE INDUSTRIE, H.B. Fuller Co., Henkel AG and Co. KGaA, Intertape Polymer Group Inc., LINTEC Corp., Lohmann GmbH and Co.KG, Mativ Holdings Inc., Nitto Denko Corp., and Shurtape Technologies LLC

We can help! Our analysts can customize this adhesive tapes market research report to meet your requirements.

Get in touch

1 Executive Summary

  • 1.1 Market overview
    • Executive Summary - Chart on Market Overview
    • Executive Summary - Data Table on Market Overview
    • Executive Summary - Chart on Global Market Characteristics
    • Executive Summary - Chart on Market by Geography
    • Executive Summary - Chart on Market Segmentation by Material
    • Executive Summary - Chart on Market Segmentation by End-user
    • Executive Summary - Chart on Incremental Growth
    • Executive Summary - Data Table on Incremental Growth
    • Executive Summary - Chart on Company Market Positioning

2 Market Landscape

  • 2.1 Market ecosystem
    • Parent Market
    • Data Table on - Parent Market
  • 2.2 Market characteristics
    • Market characteristics analysis
  • 2.3 Value chain analysis
    • Value Chain Analysis

3 Market Sizing

  • 3.1 Market definition
    • Offerings of companies included in the market definition
  • 3.2 Market segment analysis
    • Market segments
  • 3.3 Market size 2023
    • 3.4 Market outlook: Forecast for 2023-2028
      • Chart on Global - Market size and forecast 2023-2028 ($ million)
      • Data Table on Global - Market size and forecast 2023-2028 ($ million)
      • Chart on Global Market: Year-over-year growth 2023-2028 (%)
      • Data Table on Global Market: Year-over-year growth 2023-2028 (%)

    4 Historic Market Size

    • 4.1 Global Adhesive Tapes Market 2018 - 2022
      • Historic Market Size - Data Table on Global Adhesive Tapes Market 2018 - 2022 ($ million)
    • 4.2 Material segment analysis 2018 - 2022
      • Historic Market Size - Material Segment 2018 - 2022 ($ million)
    • 4.3 End-user segment analysis 2018 - 2022
      • Historic Market Size - End-user Segment 2018 - 2022 ($ million)
    • 4.4 Geography segment analysis 2018 - 2022
      • Historic Market Size - Geography Segment 2018 - 2022 ($ million)
    • 4.5 Country segment analysis 2018 - 2022
      • Historic Market Size - Country Segment 2018 - 2022 ($ million)

    5 Five Forces Analysis

    • 5.1 Five forces summary
      • Five forces analysis - Comparison between 2023 and 2028
    • 5.2 Bargaining power of buyers
      • Bargaining power of buyers - Impact of key factors 2023 and 2028
    • 5.3 Bargaining power of suppliers
      • Bargaining power of suppliers - Impact of key factors in 2023 and 2028
    • 5.4 Threat of new entrants
      • Threat of new entrants - Impact of key factors in 2023 and 2028
    • 5.5 Threat of substitutes
      • Threat of substitutes - Impact of key factors in 2023 and 2028
    • 5.6 Threat of rivalry
      • Threat of rivalry - Impact of key factors in 2023 and 2028
    • 5.7 Market condition
      • Chart on Market condition - Five forces 2023 and 2028

    6 Market Segmentation by Material

    • 6.1 Market segments
      • Chart on Material - Market share (2023-2028) (%)
      • Data Table on Material - Market share (2023-2028) (%)
    • 6.2 Comparison by Material
      • Chart on Comparison by Material
      • Data Table on Comparison by Material
    • 6.3 Polypropylene - Market size and forecast (2023-2028)
      • Chart on Polypropylene - Market size and forecast (2023-2028) ($ million)
      • Data Table on Polypropylene - Market size and forecast (2023-2028) ($ million)
      • Chart on Polypropylene - Year-over-year growth (2023-2028) (%)
      • Data Table on Polypropylene - Year-over-year growth (2023-2028) (%)
    • 6.4 Paper - Market size and forecast (2023-2028)
      • Chart on Paper - Market size and forecast (2023-2028) ($ million)
      • Data Table on Paper - Market size and forecast (2023-2028) ($ million)
      • Chart on Paper - Year-over-year growth (2023-2028) (%)
      • Data Table on Paper - Year-over-year growth (2023-2028) (%)
    • 6.5 Polyvinyl chloride - Market size and forecast (2023-2028)
      • Chart on Polyvinyl chloride - Market size and forecast (2023-2028) ($ million)
      • Data Table on Polyvinyl chloride - Market size and forecast (2023-2028) ($ million)
      • Chart on Polyvinyl chloride - Year-over-year growth (2023-2028) (%)
      • Data Table on Polyvinyl chloride - Year-over-year growth (2023-2028) (%)
    • 6.6 Others - Market size and forecast (2023-2028)
      • Chart on Others - Market size and forecast (2023-2028) ($ million)
      • Data Table on Others - Market size and forecast (2023-2028) ($ million)
      • Chart on Others - Year-over-year growth (2023-2028) (%)
      • Data Table on Others - Year-over-year growth (2023-2028) (%)
    • 6.7 Market opportunity by Material
      • Market opportunity by Material ($ million)
      • Data Table on Market opportunity by Material ($ million)

    7 Market Segmentation by End-user

    • 7.1 Market segments
      • Chart on End-user - Market share (2023-2028) (%)
      • Data Table on End-user - Market share (2023-2028) (%)
    • 7.2 Comparison by End-user
      • Chart on Comparison by End-user
      • Data Table on Comparison by End-user
    • 7.3 Automotive - Market size and forecast (2023-2028)
      • Chart on Automotive - Market size and forecast (2023-2028) ($ million)
      • Data Table on Automotive - Market size and forecast (2023-2028) ($ million)
      • Chart on Automotive - Year-over-year growth (2023-2028) (%)
      • Data Table on Automotive - Year-over-year growth (2023-2028) (%)
    • 7.4 Healthcare - Market size and forecast (2023-2028)
      • Chart on Healthcare - Market size and forecast (2023-2028) ($ million)
      • Data Table on Healthcare - Market size and forecast (2023-2028) ($ million)
      • Chart on Healthcare - Year-over-year growth (2023-2028) (%)
      • Data Table on Healthcare - Year-over-year growth (2023-2028) (%)
    • 7.5 Packaging - Market size and forecast (2023-2028)
      • Chart on Packaging - Market size and forecast (2023-2028) ($ million)
      • Data Table on Packaging - Market size and forecast (2023-2028) ($ million)
      • Chart on Packaging - Year-over-year growth (2023-2028) (%)
      • Data Table on Packaging - Year-over-year growth (2023-2028) (%)
    • 7.6 Others - Market size and forecast (2023-2028)
      • Chart on Others - Market size and forecast (2023-2028) ($ million)
      • Data Table on Others - Market size and forecast (2023-2028) ($ million)
      • Chart on Others - Year-over-year growth (2023-2028) (%)
      • Data Table on Others - Year-over-year growth (2023-2028) (%)
    • 7.7 Market opportunity by End-user
      • Market opportunity by End-user ($ million)
      • Data Table on Market opportunity by End-user ($ million)

    8 Market Segmentation by Application

    • 8.1 Market segments
      • Chart on Application - Market share (2023-2028) (%)
      • Data Table on Application - Market share (2023-2028) (%)
      • Market opportunity by Application ($ million)
      • Data Table on Market opportunity by Application ($ million)
    • 8.2 Comparison by Application
      • Chart on Comparison by Application
      • Data Table on Comparison by Application
    • 8.3 Packaging - Market size and forecast (2023-2028)
      • Chart on Packaging - Market size and forecast (2023-2028) ($ million)
      • Data Table on Packaging - Market size and forecast (2023-2028) ($ million)
      • Chart on Packaging - Year-over-year growth (2023-2028) (%)
      • Data Table on Packaging - Year-over-year growth (2023-2028) (%)
    • 8.4 Masking - Market size and forecast (2023-2028)
      • Chart on Masking - Market size and forecast (2023-2028) ($ million)
      • Data Table on Masking - Market size and forecast (2023-2028) ($ million)
      • Chart on Masking - Year-over-year growth (2023-2028) (%)
      • Data Table on Masking - Year-over-year growth (2023-2028) (%)
    • 8.5 Electrical & Electronics - Market size and forecast (2023-2028)
      • Chart on Electrical & Electronics - Market size and forecast (2023-2028) ($ million)
      • Data Table on Electrical & Electronics - Market size and forecast (2023-2028) ($ million)
      • Chart on Electrical & Electronics - Year-over-year growth (2023-2028) (%)
      • Data Table on Electrical & Electronics - Year-over-year growth (2023-2028) (%)
    • 8.6 Automotive - Market size and forecast (2023-2028)
      • Chart on Automotive - Market size and forecast (2023-2028) ($ million)
      • Data Table on Automotive - Market size and forecast (2023-2028) ($ million)
      • Chart on Automotive - Year-over-year growth (2023-2028) (%)
      • Data Table on Automotive - Year-over-year growth (2023-2028) (%)
    • 8.7 Healthcare - Market size and forecast (2023-2028)
      • Chart on Healthcare - Market size and forecast (2023-2028) ($ million)
      • Data Table on Healthcare - Market size and forecast (2023-2028) ($ million)
      • Chart on Healthcare - Year-over-year growth (2023-2028) (%)
      • Data Table on Healthcare - Year-over-year growth (2023-2028) (%)
    • 8.8 Building & Construction - Market size and forecast (2023-2028)
      • Chart on Building & Construction - Market size and forecast (2023-2028) ($ million)
      • Data Table on Building & Construction - Market size and forecast (2023-2028) ($ million)
      • Chart on Building & Construction - Year-over-year growth (2023-2028) (%)
      • Data Table on Building & Construction - Year-over-year growth (2023-2028) (%)
    • 8.9 Other Applications - Market size and forecast (2023-2028)
      • Chart on Other Applications - Market size and forecast (2023-2028) ($ million)
      • Data Table on Other Applications - Market size and forecast (2023-2028) ($ million)
      • Chart on Other Applications - Year-over-year growth (2023-2028) (%)
      • Data Table on Other Applications - Year-over-year growth (2023-2028) (%)

    9 Market Segmentation by Technology

    • 9.1 Market segments
      • Chart on Technology - Market share (2023-2028) (%)
      • Data Table on Technology - Market share (2023-2028) (%)
    • 9.2 Comparison by Technology
      • Chart on Comparison by Technology
      • Data Table on Comparison by Technology
    • 9.3 Solvent-Based - Market size and forecast (2023-2028)
      • Chart on Solvent-Based - Market size and forecast (2023-2028) ($ million)
      • Data Table on Solvent-Based - Market size and forecast (2023-2028) ($ million)
      • Chart on Solvent-Based - Year-over-year growth (2023-2028) (%)
      • Data Table on Solvent-Based - Year-over-year growth (2023-2028) (%)
    • 9.4 Water-Based - Market size and forecast (2023-2028)
      • Chart on Water-Based - Market size and forecast (2023-2028) ($ million)
      • Data Table on Water-Based - Market size and forecast (2023-2028) ($ million)
      • Chart on Water-Based - Year-over-year growth (2023-2028) (%)
      • Data Table on Water-Based - Year-over-year growth (2023-2028) (%)
    • 9.5 Hot-Melt - Market size and forecast (2023-2028)
      • Chart on Hot-Melt - Market size and forecast (2023-2028) ($ million)
      • Data Table on Hot-Melt - Market size and forecast (2023-2028) ($ million)
      • Chart on Hot-Melt - Year-over-year growth (2023-2028) (%)
      • Data Table on Hot-Melt - Year-over-year growth (2023-2028) (%)
    • 9.6 UV-Curable - Market size and forecast (2023-2028)
      • Chart on UV-Curable - Market size and forecast (2023-2028) ($ million)
      • Data Table on UV-Curable - Market size and forecast (2023-2028) ($ million)
      • Chart on UV-Curable - Year-over-year growth (2023-2028) (%)
      • Data Table on UV-Curable - Year-over-year growth (2023-2028) (%)
    • 9.7 Market opportunity by Technology
      • Market opportunity by Technology ($ million)
      • Data Table on Market opportunity by Technology ($ million)

    10 Customer Landscape

    • 10.1 Customer landscape overview
      • Analysis of price sensitivity, lifecycle, customer purchase basket, adoption rates, and purchase criteria

    11 Geographic Landscape

    • 11.1 Geographic segmentation
      • Chart on Market share by geography 2023-2028 (%)
      • Data Table on Market share by geography 2023-2028 (%)
    • 11.2 Geographic comparison
      • Chart on Geographic comparison
      • Data Table on Geographic comparison
    • 11.3 APAC - Market size and forecast 2023-2028
      • Chart on APAC - Market size and forecast 2023-2028 ($ million)
      • Data Table on APAC - Market size and forecast 2023-2028 ($ million)
      • Chart on APAC - Year-over-year growth 2023-2028 (%)
      • Data Table on APAC - Year-over-year growth 2023-2028 (%)
    • 11.4 North America - Market size and forecast 2023-2028
      • Chart on North America - Market size and forecast 2023-2028 ($ million)
      • Data Table on North America - Market size and forecast 2023-2028 ($ million)
      • Chart on North America - Year-over-year growth 2023-2028 (%)
      • Data Table on North America - Year-over-year growth 2023-2028 (%)
    • 11.5 Europe - Market size and forecast 2023-2028
      • Chart on Europe - Market size and forecast 2023-2028 ($ million)
      • Data Table on Europe - Market size and forecast 2023-2028 ($ million)
      • Chart on Europe - Year-over-year growth 2023-2028 (%)
      • Data Table on Europe - Year-over-year growth 2023-2028 (%)
    • 11.6 South America - Market size and forecast 2023-2028
      • Chart on South America - Market size and forecast 2023-2028 ($ million)
      • Data Table on South America - Market size and forecast 2023-2028 ($ million)
      • Chart on South America - Year-over-year growth 2023-2028 (%)
      • Data Table on South America - Year-over-year growth 2023-2028 (%)
    • 11.7 Middle East and Africa - Market size and forecast 2023-2028
      • Chart on Middle East and Africa - Market size and forecast 2023-2028 ($ million)
      • Data Table on Middle East and Africa - Market size and forecast 2023-2028 ($ million)
      • Chart on Middle East and Africa - Year-over-year growth 2023-2028 (%)
      • Data Table on Middle East and Africa - Year-over-year growth 2023-2028 (%)
    • 11.8 China - Market size and forecast 2023-2028
      • Chart on China - Market size and forecast 2023-2028 ($ million)
      • Data Table on China - Market size and forecast 2023-2028 ($ million)
      • Chart on China - Year-over-year growth 2023-2028 (%)
      • Data Table on China - Year-over-year growth 2023-2028 (%)
    • 11.9 US - Market size and forecast 2023-2028
      • Chart on US - Market size and forecast 2023-2028 ($ million)
      • Data Table on US - Market size and forecast 2023-2028 ($ million)
      • Chart on US - Year-over-year growth 2023-2028 (%)
      • Data Table on US - Year-over-year growth 2023-2028 (%)
    • 11.10 India - Market size and forecast 2023-2028
      • Chart on India - Market size and forecast 2023-2028 ($ million)
      • Data Table on India - Market size and forecast 2023-2028 ($ million)
      • Chart on India - Year-over-year growth 2023-2028 (%)
      • Data Table on India - Year-over-year growth 2023-2028 (%)
    • 11.11 Japan - Market size and forecast 2023-2028
      • Chart on Japan - Market size and forecast 2023-2028 ($ million)
      • Data Table on Japan - Market size and forecast 2023-2028 ($ million)
      • Chart on Japan - Year-over-year growth 2023-2028 (%)
      • Data Table on Japan - Year-over-year growth 2023-2028 (%)
    • 11.12 Germany - Market size and forecast 2023-2028
      • Chart on Germany - Market size and forecast 2023-2028 ($ million)
      • Data Table on Germany - Market size and forecast 2023-2028 ($ million)
      • Chart on Germany - Year-over-year growth 2023-2028 (%)
      • Data Table on Germany - Year-over-year growth 2023-2028 (%)
    • 11.13 Market opportunity by geography
      • Market opportunity by geography ($ million)
      • Data Tables on Market opportunity by geography ($ million)
    • 11.14 Canada - Market size and forecast (2023-2028)
      • Chart on Canada - Market size and forecast (2023-2028) ($ million)
      • Data Table on Canada - Market size and forecast (2023-2028) ($ million)
      • Chart on Canada - Year-over-year growth (2023-2028) (%)
      • Data Table on Canada - Year-over-year growth (2023-2028) (%)
    • 11.15 UK - Market size and forecast (2023-2028)
      • Chart on UK - Market size and forecast (2023-2028) ($ million)
      • Data Table on UK - Market size and forecast (2023-2028) ($ million)
      • Chart on UK - Year-over-year growth (2023-2028) (%)
      • Data Table on UK - Year-over-year growth (2023-2028) (%)
    • 11.16 Italy - Market size and forecast (2023-2028)
      • Chart on Italy - Market size and forecast (2023-2028) ($ million)
      • Data Table on Italy - Market size and forecast (2023-2028) ($ million)
      • Chart on Italy - Year-over-year growth (2023-2028) (%)
      • Data Table on Italy - Year-over-year growth (2023-2028) (%)
    • 11.17 France - Market size and forecast (2023-2028)
      • Chart on France - Market size and forecast (2023-2028) ($ million)
      • Data Table on France - Market size and forecast (2023-2028) ($ million)
      • Chart on France - Year-over-year growth (2023-2028) (%)
      • Data Table on France - Year-over-year growth (2023-2028) (%)
    • 11.18 Brazil - Market size and forecast (2023-2028)
      • Chart on Brazil - Market size and forecast (2023-2028) ($ million)
      • Data Table on Brazil - Market size and forecast (2023-2028) ($ million)
      • Chart on Brazil - Year-over-year growth (2023-2028) (%)
      • Data Table on Brazil - Year-over-year growth (2023-2028) (%)
    • 11.19 Egypt - Market size and forecast (2023-2028)
      • Chart on Egypt - Market size and forecast (2023-2028) ($ million)
      • Data Table on Egypt - Market size and forecast (2023-2028) ($ million)
      • Chart on Egypt - Year-over-year growth (2023-2028) (%)
      • Data Table on Egypt - Year-over-year growth (2023-2028) (%)
    • 11.20 UAE - Market size and forecast (2023-2028)
      • Chart on UAE - Market size and forecast (2023-2028) ($ million)
      • Data Table on UAE - Market size and forecast (2023-2028) ($ million)
      • Chart on UAE - Year-over-year growth (2023-2028) (%)
      • Data Table on UAE - Year-over-year growth (2023-2028) (%)
    • 11.21 Oman - Market size and forecast (2023-2028)
      • Chart on Oman - Market size and forecast (2023-2028) ($ million)
      • Data Table on Oman - Market size and forecast (2023-2028) ($ million)
      • Chart on Oman - Year-over-year growth (2023-2028) (%)
      • Data Table on Oman - Year-over-year growth (2023-2028) (%)
    • 11.22 Argentina - Market size and forecast (2023-2028)
      • Chart on Argentina - Market size and forecast (2023-2028) ($ million)
      • Data Table on Argentina - Market size and forecast (2023-2028) ($ million)
      • Chart on Argentina - Year-over-year growth (2023-2028) (%)
      • Data Table on Argentina - Year-over-year growth (2023-2028) (%)
    • 11.23 KSA - Market size and forecast (2023-2028)
      • Chart on KSA - Market size and forecast (2023-2028) ($ million)
      • Data Table on KSA - Market size and forecast (2023-2028) ($ million)
      • Chart on KSA - Year-over-year growth (2023-2028) (%)
      • Data Table on KSA - Year-over-year growth (2023-2028) (%)
    • 11.24 Rest of World (ROW) - Market size and forecast (2023-2028)
      • Chart on Rest of World (ROW) - Market size and forecast (2023-2028) ($ million)
      • Data Table on Rest of World (ROW) - Market size and forecast (2023-2028) ($ million)
      • Chart on Rest of World (ROW) - Year-over-year growth (2023-2028) (%)
      • Data Table on Rest of World (ROW) - Year-over-year growth (2023-2028) (%)

    12 Drivers, Challenges, and Opportunity/Restraints

    • 12.1 Market drivers
      • 12.2 Market challenges
        • 12.3 Impact of drivers and challenges
          • Impact of drivers and challenges in 2023 and 2028
        • 12.4 Market opportunities/restraints

          13 Competitive Landscape

          • 13.1 Overview
            • 13.2 Competitive Landscape
              • Overview on criticality of inputs and factors of differentiation
            • 13.3 Landscape disruption
              • Overview on factors of disruption
            • 13.4 Industry risks
              • Impact of key risks on business

            14 Competitive Analysis

            • 14.1 Companies profiled
              • Companies covered
            • 14.2 Market positioning of companies
              • Matrix on companies position and classification
            • 3M Co.
              • 3M Co. - Overview
              • 3M Co. - Business segments
              • 3M Co. - Key news
              • 3M Co. - Key offerings
              • 3M Co. - Segment focus
            • 14.4 Adhesives Research Inc.
              • Adhesives Research Inc. - Overview
              • Adhesives Research Inc. - Product / Service
              • Adhesives Research Inc. - Key offerings
            • 14.5 Advance Tapes International Ltd.
              • Advance Tapes International Ltd. - Overview
              • Advance Tapes International Ltd. - Product / Service
              • Advance Tapes International Ltd. - Key offerings
            • 14.6 American Biltrite Inc.
              • American Biltrite Inc. - Overview
              • American Biltrite Inc. - Product / Service
              • American Biltrite Inc. - Key offerings
            • 14.7 Avery Dennison Corp.
              • Avery Dennison Corp. - Overview
              • Avery Dennison Corp. - Business segments
              • Avery Dennison Corp. - Key news
              • Avery Dennison Corp. - Key offerings
              • Avery Dennison Corp. - Segment focus
            • 14.8 Beiersdorf AG
              • Beiersdorf AG - Overview
              • Beiersdorf AG - Business segments
              • Beiersdorf AG - Key offerings
              • Beiersdorf AG - Segment focus
            • 14.9 Berry Global Inc.
              • Berry Global Inc. - Overview
              • Berry Global Inc. - Business segments
              • Berry Global Inc. - Key news
              • Berry Global Inc. - Key offerings
              • Berry Global Inc. - Segment focus
            • 14.10 Can Do National Tape
              • Can Do National Tape - Overview
              • Can Do National Tape - Product / Service
              • Can Do National Tape - Key offerings
            • 14.11 Henkel AG and Co. KGaA
              • Henkel AG and Co. KGaA - Overview
              • Henkel AG and Co. KGaA - Business segments
              • Henkel AG and Co. KGaA - Key offerings
              • Henkel AG and Co. KGaA - Segment focus
            • 14.12 Intertape Polymer Group Inc.
              • Intertape Polymer Group Inc. - Overview
              • Intertape Polymer Group Inc. - Product / Service
              • Intertape Polymer Group Inc. - Key offerings
            • 14.13 LINTEC Corp.
              • LINTEC Corp. - Overview
              • LINTEC Corp. - Business segments
              • LINTEC Corp. - Key news
              • LINTEC Corp. - Key offerings
              • LINTEC Corp. - Segment focus
            • 14.14 Lohmann GmbH and Co.KG
              • Lohmann GmbH and Co.KG - Overview
              • Lohmann GmbH and Co.KG - Product / Service
              • Lohmann GmbH and Co.KG - Key offerings
            • 14.15 Mativ Holdings Inc.
              • Mativ Holdings Inc. - Overview
              • Mativ Holdings Inc. - Business segments
              • Mativ Holdings Inc. - Key offerings
              • Mativ Holdings Inc. - Segment focus
            • 14.16 Nitto Denko Corp.
              • Nitto Denko Corp. - Overview
              • Nitto Denko Corp. - Business segments
              • Nitto Denko Corp. - Key offerings
              • Nitto Denko Corp. - Segment focus
            • 14.17 Shurtape Technologies LLC
              • Shurtape Technologies LLC - Overview
              • Shurtape Technologies LLC - Product / Service
              • Shurtape Technologies LLC - Key offerings

            15 Appendix

            • 15.1 Scope of the report
              • 15.2 Inclusions and exclusions checklist
                • Inclusions checklist
                • Exclusions checklist
              • 15.3 Currency conversion rates for US$
                • Currency conversion rates for US$
              • 15.4 Research methodology
                • Research methodology
              • 15.5 Data procurement
                • Information sources
              • 15.6 Data validation
                • Data validation
              • 15.7 Validation techniques employed for market sizing
                • Validation techniques employed for market sizing
              • 15.8 Data synthesis
                • Data synthesis
              • 15.9 360 degree market analysis
                • 360 degree market analysis
              • 15.10 List of abbreviations
                • List of abbreviations

              Research Methodology

              Technavio presents a detailed picture of the market by way of study, synthesis, and summation of data from multiple sources. The analysts have presented the various facets of the market with a particular focus on identifying the key industry influencers. The data thus presented is comprehensive, reliable, and the result of extensive research, both primary and secondary.

              INFORMATION SOURCES

              Primary sources

              • Manufacturers and suppliers
              • Channel partners
              • Industry experts
              • Strategic decision makers

              Secondary sources

              • Industry journals and periodicals
              • Government data
              • Financial reports of key industry players
              • Historical data
              • Press releases

              DATA ANALYSIS

              Data Synthesis

              • Collation of data
              • Estimation of key figures
              • Analysis of derived insights

              Data Validation

              • Triangulation with data models
              • Reference against proprietary databases
              • Corroboration with industry experts

              REPORT WRITING

              Qualitative

              • Market drivers
              • Market challenges
              • Market trends
              • Five forces analysis

              Quantitative

              • Market size and forecast
              • Market segmentation
              • Geographical insights
              • Competitive landscape

              Interested in this report?

              Get your sample now to see our research methodology and insights!

              Download Now

              Frequently Asked Questions

              Adhesive Tapes market growth will increase by $ 23.9 bn during 2024-2028 .

              The Adhesive Tapes market is expected to grow at a CAGR of 6.23% during 2024-2028 .

              Adhesive Tapes market is segmented by Material( Polypropylene, Paper, Polyvinyl chloride, Others) End-user( Automotive, Healthcare, Packaging, Others, MEA)

              3M Co., Adhesives Research Inc., Advance Tapes International Ltd., American Biltrite Inc., Avery Dennison Corp., Beiersdorf AG, Berry Global Inc., Can Do National Tape, Coating and Converting Technologies Inc., Compagnie de Saint Gobain, Dow Chemical Co., GERGONNE INDUSTRIE, H.B. Fuller Co., Henkel AG and Co. KGaA, Intertape Polymer Group Inc., LINTEC Corp., Lohmann GmbH and Co.KG, Mativ Holdings Inc., Nitto Denko Corp., Shurtape Technologies LLC are a few of the key vendors in the Adhesive Tapes market.

              APAC will register the highest growth rate of 64% among the other regions. Therefore, the Adhesive Tapes market in APAC is expected to garner significant business opportunities for the vendors during the forecast period.

              US, Canada, Germany, UK, Italy, France, China, India, Japan, Brazil, Egypt, UAE, Oman, Argentina, KSA, UAE, Brazil, Rest of World (ROW)

              • Increasing demand from end-user industriesAdhesive tapes are used in various end-user industries such as medical is the driving factor this market.
              • automotive is the driving factor this market.
              • consumer electronics is the driving factor this market.
              • and food and beverage. In the automotive industry is the driving factor this market.
              • adhesive tapes are used as alternatives to screws is the driving factor this market.
              • fasteners is the driving factor this market.
              • or the welding process for bonding auto components. The type of adhesive tape used depends on the application. For example is the driving factor this market.
              • double-sided tapes are used in car exteriors such as door claddings is the driving factor this market.
              • parking sensor retainers is the driving factor this market.
              • and seals. NVH-based adhesive tapes reduce noise and vibrations in sport utility vehicles. Foam tapes dampen unwanted vibrations and noises and reduce gaps and different bond substrates. Specialty tapes are used for wire harnessing is the driving factor this market.
              • cable harnessing is the driving factor this market.
              • noise damping is the driving factor this market.
              • and part mounting applications in the automotive industry. The above-mentioned characteristics of adhesive tapes make them suitable for various automotive applications. Hence is the driving factor this market.
              • the demand for adhesive tapes from this industry is expected to increase significantly.The food and beverage industry is the driving factor this market.
              • a key sector projecting a stable demand for adhesive tapes is the driving factor this market.
              • uses adhesive tapes for packaging and sealing food containers. The rising demand for sustainable food packaging solutions to store food products at room temperature by preventing contamination from surroundings has led to the demand for advanced adhesive tapes with enhanced durability. In addition is the driving factor this market.
              • the increasing demand for lightweight packaging products and environment-friendly boxes is anticipated to boost the global adhesive tapes market during the forecast period.Increased global pharmaceutical sales will drive the production of pharmaceutical products and is the driving factor this market.
              • subsequently is the driving factor this market.
              • have a positive impact on the medical industry. This may fuel the demand for adhesive tapes. In the medical industry is the driving factor this market.
              • these tapes are extensively used as they are highly durable and prevent contamination. They ensure hygiene and offer protection against weather conditions.Adhesive tape is suitable for people with sensitive skin and for the elderly and children with delicate skin. Adhesive paper tapes used for medical purposes are known as micropore tapes. Micropore tapes have small apertures on the surface is the driving factor this market.
              • which make them breathable. Hence is the driving factor this market.
              • the skin covered with micropore tape has a higher chance of healing than the skin covered with non-breathable tape. As micropore tapes are light and gentle on the human skin is the driving factor this market.
              • they are suitable for wounds that need to be re-dressed and treated frequently.The demand for consumer electronics has been on the rise across geographies. The increasing demand for small is the driving factor this market.
              • lightweight is the driving factor this market.
              • and sleek personal electronics is driving the global adhesive tapes market. These tapes are used for sealing is the driving factor this market.
              • joining is the driving factor this market.
              • insulating is the driving factor this market.
              • EMI shielding is the driving factor this market.
              • and heat dissipation of various parts and components of electronic products. They are a reliable is the driving factor this market.
              • compact solution for assembling electronics. The demand for mobile devices such as smartphones is the driving factor this market.
              • tablets is the driving factor this market.
              • and laptops is growing because of the increasing global internet penetration.The growth of end-user industries such as automotive is the driving factor this market.
              • food and beverages is the driving factor this market.
              • pharmaceuticals is the driving factor this market.
              • and electronics is expected to drive the demand for adhesive tapes during the forecast period. is the driving factor this market.

              The Adhesive Tapes market vendors should focus on grabbing business opportunities from the Polypropylene segment as it accounted for the largest market share in the base year.