Aerostructures Market Size 2025-2029
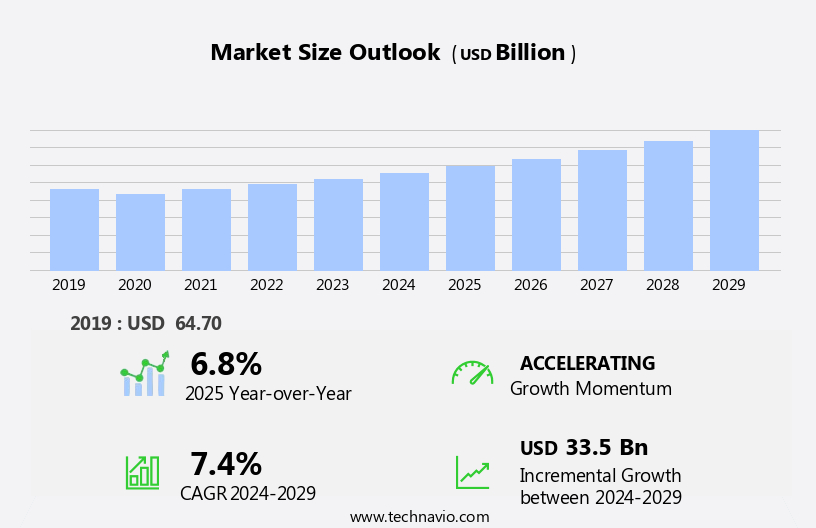
The aerostructures market size is forecast to increase by USD 33.5 billion at a CAGR of 7.4% between 2024 and 2029.
- The market is experiencing significant growth, driven by aviation-friendly government initiatives in the Asia-Pacific region and the emergence of 3D printing technology. The Asian market's expansion is fueled by increasing air traffic and growing demand for modern aircraft, leading to substantial investments in new production facilities and infrastructure. This trend is further bolstered by government support for the aviation industry, with initiatives such as tax incentives and subsidies designed to attract foreign investment and stimulate domestic production. However, the market is not without challenges. Delays in aircraft delivery pose a significant obstacle for aerostructures manufacturers. These delays can result in increased production costs, strained supplier relationships, and missed revenue opportunities.
- To mitigate these risks, companies must implement robust supply chain management strategies, including effective communication with OEMs and suppliers, and maintaining a flexible production schedule to accommodate potential delays. By staying agile and responsive to market dynamics, aerostructures manufacturers can capitalize on the opportunities presented by the growing demand for aircraft and navigate the challenges of an increasingly competitive landscape.
What will be the Size of the Aerostructures Market during the forecast period?
- The market continues to evolve, driven by the relentless pursuit of efficiency, safety, and sustainability in the aerospace industry. Aerostructures encompass various components, from business jet tail sections to military aircraft engine nacelles, all requiring high-performance materials and advanced manufacturing techniques. composite materials, such as Carbon Fiber and metal alloys, are at the forefront of this evolution. Their lightweight properties contribute to fuel efficiency and aerodynamic efficiency, while their corrosion resistance ensures structural integrity. Tier 1 and tier 2 suppliers collaborate closely with aerospace OEMs to optimize design, manufacturing, and assembly processes. Non-destructive testing (NDT) plays a crucial role in ensuring quality control and safety standards.
- Smart manufacturing, digital twin, and predictive maintenance technologies enable real-time monitoring and analysis, enhancing the overall performance of aerostructures. The integration of advanced manufacturing technologies, like 3D printing and additive manufacturing, is revolutionizing the production of complex geometries and reducing lead times. The digital transformation in the aerospace sector is further driving the need for technology integration and lifecycle analysis. Emissions reduction and environmental regulations are key market dynamics shaping the future of aerostructures. Thermal management systems and structural analysis are essential components in the development of more efficient and eco-friendly aircraft designs. Aftermarket services and supply chain management are also critical aspects of the market, ensuring optimal performance throughout the entire lifecycle of aerostructures.
How is this Aerostructures Industry segmented?
The aerostructures industry research report provides comprehensive data (region-wise segment analysis), with forecasts and estimates in "USD billion" for the period 2025-2029, as well as historical data from 2019-2023 for the following segments.
- End-user
- OEM
- Aftermarket
- Platform
- Fixed wing aircraft
- Rotary wing aircraft
- Component
- Fuselages
- Wings
- Empennages
- Flight control surfaces
- Others
- Material
- Alloys and superalloys
- Composites
- Metals
- Aircraft Type
- Commercial
- Military
- General Aviation
- Geography
- North America
- US
- Canada
- Europe
- France
- Germany
- Italy
- The Netherlands
- UK
- APAC
- China
- India
- Japan
- Rest of World (ROW)
- North America
By End-user Insights
The oem segment is estimated to witness significant growth during the forecast period.
The market encompasses the design, manufacturing, and sale of aerostructure components for various aircraft models. Original equipment manufacturers (OEMs) are a significant segment of this market, supplying aerostructures directly to airline operators, government agencies, and other end-users. OEMs, such as Collins Aerospace and other major aerospace companies, collaborate closely with these entities to integrate aerostructure components into aircraft designs, ensuring compliance with safety and performance standards. Advancements in technology play a crucial role in the market. Big Data analytics is used to optimize fuel efficiency and enhance structural analysis, leading to lighter, stronger, and more aerodynamically efficient components.
Carbon fiber, metal alloys, and composite materials are increasingly adopted for their corrosion resistance and fatigue resistance properties. Advanced manufacturing techniques, including 3D printing and additive manufacturing, enable the production of complex shapes and structures. Environmental regulations and safety standards continue to shape the market. Tier 1 and tier 2 suppliers work together to develop innovative solutions for reducing emissions, improving thermal management, and increasing structural integrity. Digital twin technology allows for predictive maintenance and lifecycle analysis, ensuring optimal performance and minimizing downtime. In the military aircraft sector, technology integration and structural analysis are essential for maintaining safety and efficiency.
Aerospace testing and non-destructive testing are critical components of the manufacturing process, ensuring the highest quality and safety standards. Aftermarket services, including repair and maintenance, are a growing area of focus for OEMs, providing ongoing support to customers and maximizing the value of their investments. The digital transformation of the aerospace industry is driving innovation in aerostructures, with artificial intelligence and smart manufacturing playing increasingly important roles. Commercial aircraft manufacturers are adopting these technologies to streamline assembly processes, improve quality control, and enhance the overall customer experience. In summary, The market is characterized by continuous innovation and collaboration between OEMs, suppliers, and end-users.
The integration of advanced technologies, such as big data analytics, carbon fiber, and digital twin technology, is driving improvements in fuel efficiency, aerodynamic efficiency, and structural integrity, while ensuring compliance with safety and environmental regulations.
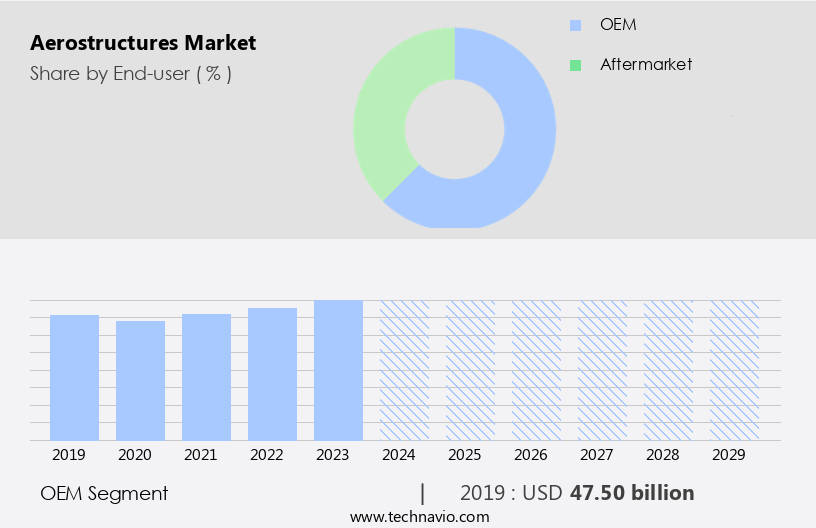
The OEM segment was valued at USD 47.50 billion in 2019 and showed a gradual increase during the forecast period.
Regional Analysis
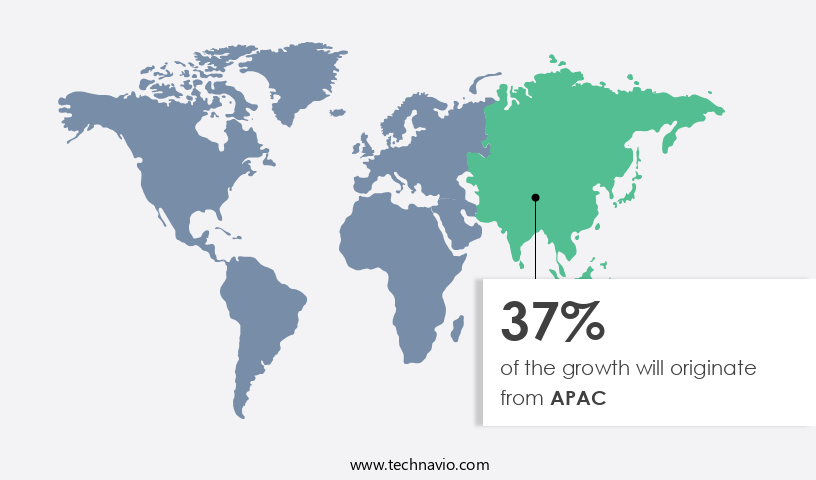
APAC is estimated to contribute 37% to the growth of the global market during the forecast period.Technavio's analysts have elaborately explained the regional trends and drivers that shape the market during the forecast period.
The market in North America is experiencing significant growth due to the increasing demand from aircraft Original Equipment Manufacturers (OEMs), including Boeing, Embraer, and Bombardier. This trend is driven by the production of new commercial aircraft orders, such as United Airlines' procurement of 110 aircraft from Boeing and Airbus in October 2023. The demand for aerostructures is further fueled by the need for fuel efficiency, environmental regulations, and safety standards. Advanced manufacturing technologies, such as 3D printing, digital twin, and artificial intelligence, are being integrated into the production process to enhance structural analysis, quality control, and predictive maintenance.
Lightweight materials, including carbon fiber and metal alloys, are also being utilized to improve aerodynamic efficiency and reduce emissions. Additionally, the use of composite materials, additive manufacturing, and non-destructive testing ensures structural integrity and fatigue resistance. The market is also focusing on technology integration, lifecycle analysis, and supply chain management to optimize assembly processes and aftermarket services. Military aircraft and business jets are also contributing to the market's growth, with a demand for advanced features such as thermal management and corrosion resistance. Overall, the market in North America is undergoing a digital transformation, with a focus on smart manufacturing and structural analysis to meet the evolving needs of the aerospace industry.
Market Dynamics
The Aerostructures Market is advancing with innovations like lightweight composite aerostructures and sustainable aerostructure materials, driving fuel efficiency in commercial aviation. 3D-printed aircraft components and AI-optimized aerostructure production enhance precision, while smart aerostructures with sensors and integrated health monitoring systems ensure safety. Eco-friendly manufacturing processes, zero-waste manufacturing, and recyclable aerostructures support sustainability. Modular aerostructure designs and morphing wing technology enable flexibility for eVTOL and next-generation UAV airframes. High-temperature composites cater to hypersonic vehicles, and low-drag aerodynamic designs optimize performance for business jets. Automated assembly lines and robotics in aerostructure assembly streamline production, while non-destructive testing ensures reliability, positioning best aerostructure manufacturers at the forefront of sustainable aviation.
Our researchers analyzed the data with 2024 as the base year, along with the key drivers, trends, and challenges. A holistic analysis of drivers will help companies refine their marketing strategies to gain a competitive advantage.
What are the key market drivers leading to the rise in the adoption of Aerostructures Industry?
- In the Asia-Pacific region, government initiatives favorable to aviation serve as the primary catalyst for market growth.
- The market is experiencing significant growth due to advancements in technology integration, particularly in the areas of thermal management, artificial intelligence (AI), and 3D printing. These innovations are enabling the production of lightweight and aerodynamically efficient components from advanced materials such as metal alloys. This results in improved fuel efficiency and reduced emissions, making it an attractive proposition for aerospace companies. Quality control is a critical aspect of the market, with stringent aerospace regulations requiring high standards. Technology integration, including AI and predictive maintenance, is helping to streamline production processes and ensure consistent quality.
- Lifecycle analysis is also becoming increasingly important, with companies focusing on maximizing the value of their assets through efficient maintenance and repair. Advanced manufacturing techniques, such as 3D printing, are revolutionizing the production of complex aerostructures. These methods enable the creation of intricate designs and customized components, reducing the need for costly and time-consuming tooling. The integration of technology and advanced manufacturing is enabling aerostructure companies to stay competitive and meet the evolving demands of the aerospace industry.
What are the market trends shaping the Aerostructures Industry?
- The emergence of 3D printing technology is currently shaping market trends. This innovative technology allows for the creation of three-dimensional objects from digital files, offering significant advantages in terms of production speed, cost efficiency, and design flexibility.
- Additive manufacturing (AM), also known as 3D printing, plays a significant role in the aerospace industry by enabling the production of complex and lightweight aircraft structures. This technology builds up a solid object in a series of layers, using digital model data from CAD models or AMF files. In contrast to traditional manufacturing methods, which involve removing material from a stock, AM adds layers of material to create intricate structures. Military aircraft and engine components, such as tail sections and engine nacelles, are prime applications for AM. The technology's ability to produce structures with high structural integrity and complex geometries makes it an attractive alternative to traditional manufacturing methods.
- Furthermore, the digital nature of AM allows for easier design iterations and faster prototyping, contributing to the digital transformation of the aerospace industry. AM also offers potential for emissions reduction in the aerospace sector. By producing lighter structures, fuel consumption can be minimized, leading to reduced carbon emissions. Aftermarket services, such as on-demand production of replacement parts, can also benefit from AM's capabilities. In conclusion, additive manufacturing is a game-changer in the aerospace industry, offering benefits in terms of structural integrity, lightweight materials, and digital transformation. Its potential for emissions reduction and aftermarket services further highlights its importance in the sector.
What challenges does the Aerostructures Industry face during its growth?
- Delays in aircraft delivery represent a significant challenge to the industry's growth trajectory. This issue can impede the expansion and profitability of airlines, as well as impact the supply chain and investor confidence. Consequently, addressing this challenge through improved manufacturing processes, better communication, and collaborative problem-solving is crucial for the continued success of the aviation sector.
- The aerospace industry is experiencing significant growth due to increasing passenger traffic and expanding economies, leading to a surge in demand for new and refurbished commercial aircraft. This trend puts pressure on aerospace Original Equipment Manufacturers (OEMs) and their tier 2 suppliers to deliver high-quality components, while also managing budgets and meeting tight delivery schedules. To address these challenges, manufacturers are focusing on advanced technologies such as composite materials, fatigue resistance, and smart manufacturing. Composite materials offer superior strength and durability, making them ideal for aircraft components. Fatigue resistance ensures that components can withstand the rigors of frequent use and harsh environmental conditions.
- Smart manufacturing, which includes automation and data-driven processes, streamlines assembly and reduces the risk of errors. Moreover, non-destructive testing (NDT) plays a crucial role in ensuring the quality and safety of aircraft components. NDT techniques, such as ultrasonic testing and radiographic testing, can detect defects that are not visible to the naked eye, ensuring that components meet the highest standards. In conclusion, the aerospace industry is undergoing a transformation, driven by increasing demand and technological advancements. Manufacturers must adapt to these changes by focusing on quality, innovation, and efficiency to meet the needs of their customers and stay competitive in the market.
Exclusive Customer Landscape
The aerostructures market forecasting report includes the adoption lifecycle of the market, covering from the innovator's stage to the laggard's stage. It focuses on adoption rates in different regions based on penetration. Furthermore, the aerostructures market report also includes key purchase criteria and drivers of price sensitivity to help companies evaluate and develop their market growth analysis strategies.

Customer Landscape
Key Companies & Market Insights
Companies are implementing various strategies, such as strategic alliances, aerostructures market forecast, partnerships, mergers and acquisitions, geographical expansion, and product/service launches, to enhance their presence in the industry.
Airbus SE - The company specializes in manufacturing aerostructure components for Embraer's wings and vertical and horizontal stabilizers for various aircraft programs.
The industry research and growth report includes detailed analyses of the competitive landscape of the market and information about key companies, including:
- Airbus SE
- AVIC
- AAR Corp.
- Boeing Co.
- Bombardier Inc.
- Collins Aerospace
- Daher
- Embraer SA
- GKN Aerospace
- Kawasaki Heavy Industries Ltd.
- Leonardo SpA
- Lockheed Martin Corp.
- Mitsubishi Heavy Industries Ltd.
- Northrop Grumman Corp.
- Raytheon Technologies Corp.
- Safran SA
- Spirit AeroSystems Inc.
- STELIA Aerospace
- Textron Inc.
- Triumph Group Inc.
Qualitative and quantitative analysis of companies has been conducted to help clients understand the wider business environment as well as the strengths and weaknesses of key industry players. Data is qualitatively analyzed to categorize companies as pure play, category-focused, industry-focused, and diversified; it is quantitatively analyzed to categorize companies as dominant, leading, strong, tentative, and weak.
Recent Development and News in Aerostructures Market
- In January 2024, Spirit AeroSystems, a leading aerostructures provider, announced the launch of its new state-of-the-art composite wing for the Airbus A320neo family, which is expected to reduce fuel consumption and emissions by up to 15% (Spirit AeroSystems Press Release, 2024). This innovation underscores the company's commitment to sustainable aviation and technological advancement.
- In July 2024, Boeing and Safran announced a strategic partnership to collaborate on the production and development of aerostructures for commercial airplanes. This collaboration aims to improve efficiency, reduce costs, and enhance competitiveness in the market (Boeing Press Release, 2025).
- In October 2024, Hexcel Corporation, a global composite materials provider, completed the acquisition of Structural Composites Inc. (SCI), a leading aerostructures manufacturer. This acquisition significantly expanded Hexcel's aerostructures capabilities and market share in the commercial and military aerospace sectors (Hexcel Corporation Press Release, 2024).
- In March 2025, the European Union Aviation Safety Agency (EASA) approved the use of 3D-printed aerostructures in commercial aircraft. This approval marks a significant milestone in the adoption of additive manufacturing technology in the aerospace industry, potentially reducing production costs and lead times (EASA Press Release, 2025).
Research Analyst Overview
The global aerospace market is experiencing significant advancements in various sectors, driven by manufacturing automation and the integration of high-performance materials such as advanced composites. Sustainable aviation is a growing trend, with a focus on lightweight design and the adoption of green technologies. The aerospace workforce is evolving to meet these demands, with a heightened emphasis on skills development and digital engineering. Aerospace software solutions are increasingly utilized for structural health monitoring and composite repair, ensuring supply chain resilience and industry partnerships. Research and development in aerodynamic optimization and virtual prototyping are providing competitive advantages for manufacturers.
Moreover, investments in integrated systems and next-generation aircraft are shaping the future of the industry. Emerging markets are also playing a crucial role in the market's expansion, with a focus on data-driven insights and innovative research. The use of advanced materials, such as high-performance composites, is revolutionizing the design and manufacturing process, enabling the production of lighter, stronger, and more fuel-efficient aircraft. This, in turn, is contributing to the growth of the global aerospace market. The integration of digital engineering and industry partnerships is also driving innovation in the aerospace sector, allowing for the development of more efficient and cost-effective manufacturing processes.
Additionally, the adoption of sustainable practices and green technologies is becoming increasingly important, as the industry seeks to reduce its carbon footprint and meet evolving regulatory requirements. In conclusion, the global aerospace market is undergoing significant changes, driven by advancements in manufacturing automation, the use of advanced composites, and a focus on sustainability and innovation. These trends are shaping the future of the industry and providing new opportunities for growth and competitive advantage.
Dive into Technavio's robust research methodology, blending expert interviews, extensive data synthesis, and validated models for unparalleled Aerostructures Market insights. See full methodology.
|
Market Scope |
|
|
Report Coverage |
Details |
|
Page number |
0 |
|
Base year |
2024 |
|
Historic period |
2019-2023 |
|
Forecast period |
2025-2029 |
|
Growth momentum & CAGR |
Accelerate at a CAGR of 7.4% |
|
Market growth 2025-2029 |
USD 33.5 billion |
|
Market structure |
Fragmented |
|
YoY growth 2024-2025(%) |
6.8 |
|
Key countries |
US, Canada, UK, China, Germany, Japan, Italy, India, The Netherlands, and France |
|
Competitive landscape |
Leading Companies, Market Positioning of Companies, Competitive Strategies, and Industry Risks |
What are the Key Data Covered in this Aerostructures Market Research and Growth Report?
- CAGR of the Aerostructures industry during the forecast period
- Detailed information on factors that will drive the growth and forecasting between 2025 and 2029
- Precise estimation of the size of the market and its contribution of the industry in focus to the parent market
- Accurate predictions about upcoming growth and trends and changes in consumer behaviour
- Growth of the market across North America, Europe, APAC, South America, and Middle East and Africa
- Thorough analysis of the market's competitive landscape and detailed information about companies
- Comprehensive analysis of factors that will challenge the aerostructures market growth of industry companies
We can help! Our analysts can customize this aerostructures market research report to meet your requirements.
 RIA -
RIA - 
