
Canada Agrochemicals Market Size and Trends
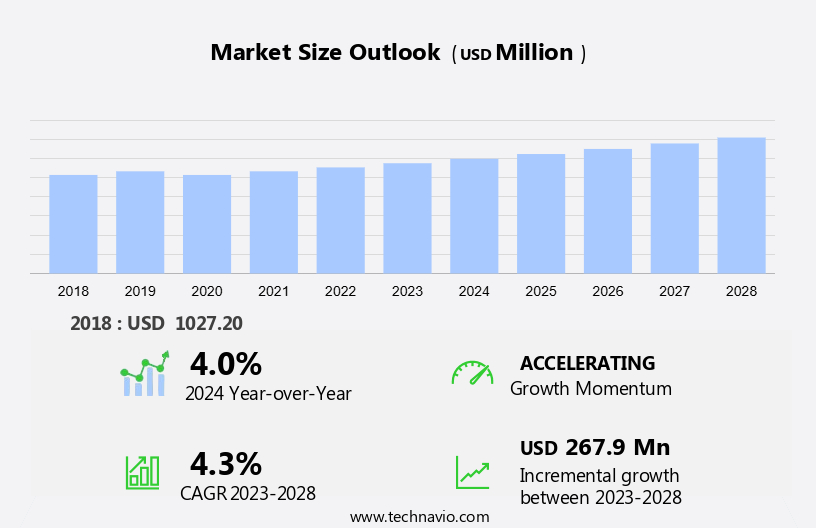
The Canada agrochemicals market size is forecast to increase by USD 267.9 million at a CAGR of 4.3% between 2023 and 2028. The market is experiencing significant growth due to the increasing demand for effective solutions to address challenges such as weed infestations, viruses, rodents, and fungi in oilseeds and other crops. Herbicides continue to be a popular choice for farmers to manage weeds, while the implementation of integrated pest management (IPM) as a new method of crop protection is gaining traction. Regulatory scrutiny is a key factor driving market growth, with authorization and evaluation processes for new agrochemicals becoming increasingly stringent. Organo-modified siloxanes and plant growth promoters are emerging as promising alternatives to traditional nitrogenous fertilizers, offering improved crop yield and reduced environmental impact. Crop loss due to pests and diseases remains a significant concern, and the development of effective and sustainable agrochemical solutions remains a priority for the industry. Regulatory compliance and the ongoing evaluation of new technologies will continue to shape the agrochemicals market in the coming years.
Market Analysis
The agrochemicals industry plays a vital role in enhancing agricultural productivity and ensuring food security in North America. Agrochemicals, including fertilizers and pesticides, are essential inputs for modern farming practices, contributing significantly to the agricultural sector's economic growth. Fertilizers, such as phosphatic and potassic, are crucial for enhancing soil health and crop yield. The increasing demand for food due to population growth and urbanization necessitates the use of efficient and effective agricultural practices. Furthermore, the adoption of sustainable farming methods, like precision agriculture and regenerative agriculture, has led to a growing interest in using agrochemicals to optimize crop production. Pest control is another critical application of agrochemicals. Integrated pest management practices, which combine the use of agrochemicals with other methods like crop rotation and biological control, help minimize the environmental impact while ensuring effective pest management. Weed control is another essential application, as weeds can significantly reduce crop yields and increase production costs. The agricultural sector's environmental sustainability is a growing concern, with an increasing focus on reducing greenhouse gas emissions, water conservation, and biodiversity conservation. Agrochemicals play a role in addressing these concerns, with the development of biofertilizers, biopesticides, and other eco-friendly alternatives gaining popularity. Farm management practices, such as no-till farming and cover cropping, are becoming increasingly common in North America. These practices help improve soil health, reduce water usage, and enhance overall agricultural sustainability. Furthermore, agricultural innovation and biotechnology continue to play a significant role in improving agrochemical efficiency and reducing their environmental impact.
Furthermore, the agricultural policy landscape in North America is evolving, with a growing focus on sustainable agriculture and environmental stewardship. Agricultural subsidies and rural development programs are being restructured to encourage the adoption of sustainable farming practices and reduce the environmental impact of agrochemicals. The agrochemicals industry is subject to rigorous regulatory oversight to ensure the safety and efficacy of its products. The environmental impact of agrochemicals is a critical consideration, with ongoing research focused on minimizing their negative effects on soil health, water quality, and biodiversity. In conclusion, the agrochemicals industry is a vital component of modern agriculture in North America, contributing significantly to food production and economic growth. The industry is evolving to meet the challenges of sustainability, environmental stewardship, and regulatory compliance, with a focus on developing eco-friendly alternatives and improving the efficiency of agrochemical use.
Market Segmentation
The market research report provides comprehensive data (region-wise segment analysis), with forecasts and estimates in "USD million" for 2024-2028, as well as historical data from 2018 - 2022 for the following segments.
- Product
- Fertilizers
- Pesticides
- Application
- Crop based
- Others
- Geography
- Canada
By Product Insights
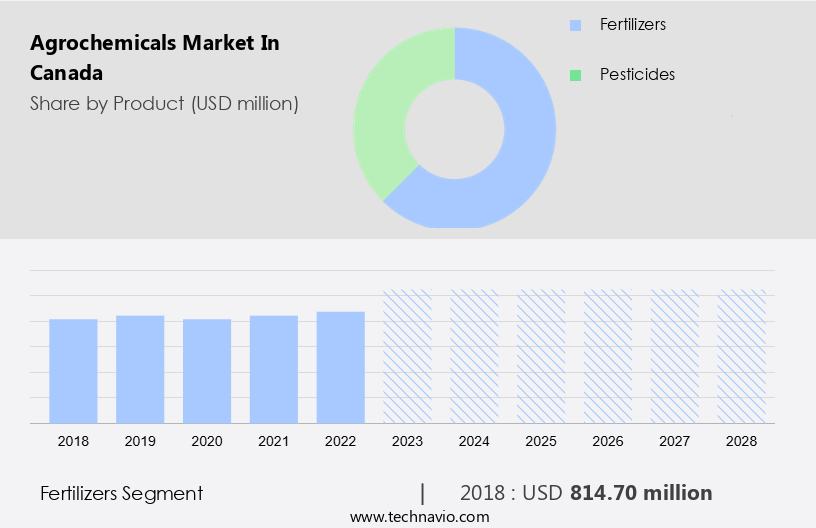
The Fertilizers segment is estimated to witness significant growth during the forecast period. The market plays a significant role in the US agricultural industry, enhancing productivity and ensuring food security through the use of various types of agrochemicals. Fertilizers, a key segment of this industry, provide essential nutrients for crops, particularly nitrogenous fertilizers which supply nitrogen, a nutrient vital for plant growth.
Get a glance at the market share of various segments Download the PDF Sample
The Fertilizers segment accounted for USD 814.70 million in 2018. Nitrogen promotes the production of chlorophyll and amino acids, leading to accelerated plant growth and improved crop quality. Urea, ammonia, and ammonium nitrate are popular nitrogenous fertilizers due to their high nitrogen content, cost-effectiveness, and availability. Weeds, viruses, rodents, and fungi pose significant challenges to crop production, necessitating the use of agrochemicals such as herbicides, fungicides, and pesticides. Herbicides control unwanted plant growth, while fungicides protect crops from fungal infections, and pesticides manage pests and diseases. Organo-modified siloxanes, a type of pesticide, offer advantages such as low toxicity and long residual effect. Regulatory scrutiny plays a crucial role in the agrochemicals market, ensuring the safety and efficacy of these products. Authorization and evaluation processes are in place to ensure that agrochemicals meet the necessary safety and efficacy standards before they can be used in the agricultural sector. Plant growth promoters, another segment of the agrochemicals market, enhance crop growth through the use of naturally occurring substances or microorganisms. These include nitrogen-fixing bacteria, phytohormones, and biofertilizers. Nitrogen-fixing bacteria convert atmospheric nitrogen into a form usable by plants, while phytohormones regulate plant growth and development. Biofertilizers, made from organic matter, provide essential nutrients to crops and improve soil health. In conclusion, the agrochemicals market plays a vital role in the US agricultural sector, providing essential nutrients through fertilizers and protecting crops from various threats through the use of herbicides, fungicides, pesticides, and plant growth promoters. Regulatory oversight ensures the safety and efficacy of these products, contributing to the overall success of the agricultural industry.
Market Dynamics
Our researchers analyzed the data with 2023 as the base year, along with the key drivers, trends, and challenges. A holistic analysis of drivers will help companies refine their marketing strategies to gain a competitive advantage.
Canada Agrochemicals Market Driver
The increasing use of herbicides is notably driving market growth. The agricultural industry invests significantly in the research and development of advanced herbicides to enhance crop productivity and protect horticulture crops from pest attacks. These herbicides are designed to decompose quickly after application, minimizing their impact on the environment. The agricultural landscape encompasses a wide range of crops, including cereals, grains, fruits, vegetables, oilseeds, and pulses.
Furthermore, the growing preference for healthier food options, driven by consumer awareness, increases the demand for herbicides in farming. EcoGuard effectively controls persistent weeds like cleavers, hemp-nettle, and dandelion, thereby delaying herbicide resistance. The agricultural intensification and the shift towards more complex cropping systems necessitate the use of herbicides to ensure optimal crop yield quality and meet the escalating food demand. Amino acids play a crucial role in enhancing herbicide efficacy and improving overall crop health. Thus, such factors are driving the growth of the market during the forecast period.
Canada Agrochemicals Market Trends
Implementation of integrated pest management (IPM) as a new method of crop protection is the key trend in the market. In the agricultural sector, pest control accounts for approximately 35% of farmers' production expenses, with pests causing losses ranging from 11% to 32%. Traditional pesticides have long been a crucial tool in managing these pests. However, the emergence of pesticide resistance and growing concerns over environmental and health implications have led to a decrease in their usage. Integrated Pest Management (IPM) is an effective alternative strategy that focuses on preventing pests in an agricultural setting. This methodology combines various control techniques, including inspection, monitoring, and reporting, to create an unfavorable environment for pests. IPM employs systemic resistance and proper operational designs to minimize the need for pesticide applications.
Furthermore, these applications are only implemented when deemed most effective during a pest's life cycle. The Environmental Protection Agency (EPA) encourages the use of IPM to promote health and wellness while reducing the reliance on inorganic fertilizers and methylated seed oils. Organic alternatives, such as manure and crop rotation, are also integral components of IPM. By adhering to IPM practices, farmers can maintain optimal crop yield while minimizing the risks associated with pesticide use. Cereal and grain production, as well as crop protection products, can significantly benefit from IPM strategies. Insects, a common pest in agriculture, can be effectively managed through IPM, ensuring the long-term health and sustainability of crops. Thus, such trends will shape the growth of the market during the forecast period.
Canada Agrochemicals Market Challenge
Regulatory laws and obligations is the major challenge that affects the growth of the market. Agrochemicals play a crucial role in safeguarding the food supply by protecting crops from disease-causing pathogens and pests. The use of agrochemicals, including pesticides and fertilizers, is essential in managing temperature and rainfall patterns to ensure optimal plant growth. In Canada, companies operating in the agrochemicals market are subject to specific laws and regulations, serving as governance codes.
Furthermore, the Food and Agriculture Organization of the United Nations (FAO) is an international association responsible for these policies, with the International Code of Conduct on the Distribution and Use of Pesticides being one such code. Adherence to these codes ensures the safety of consumers and the environment. For instance, soybean plants can be protected from aphids and other pests using approved agrochemicals, thereby maintaining crop health and productivity. Effective pest management is essential to ensure food security and mitigate potential health risks associated with disease-carrying organisms. Hence, the above factors will impede the growth of the market during the forecast period
Exclusive Customer Landscape
The market forecasting report includes the adoption lifecycle of the market, covering from the innovator's stage to the laggard's stage. It focuses on adoption rates in different regions based on penetration. Furthermore, the report also includes key purchase criteria and drivers of price sensitivity to help companies evaluate and develop their market growth analysis strategies.
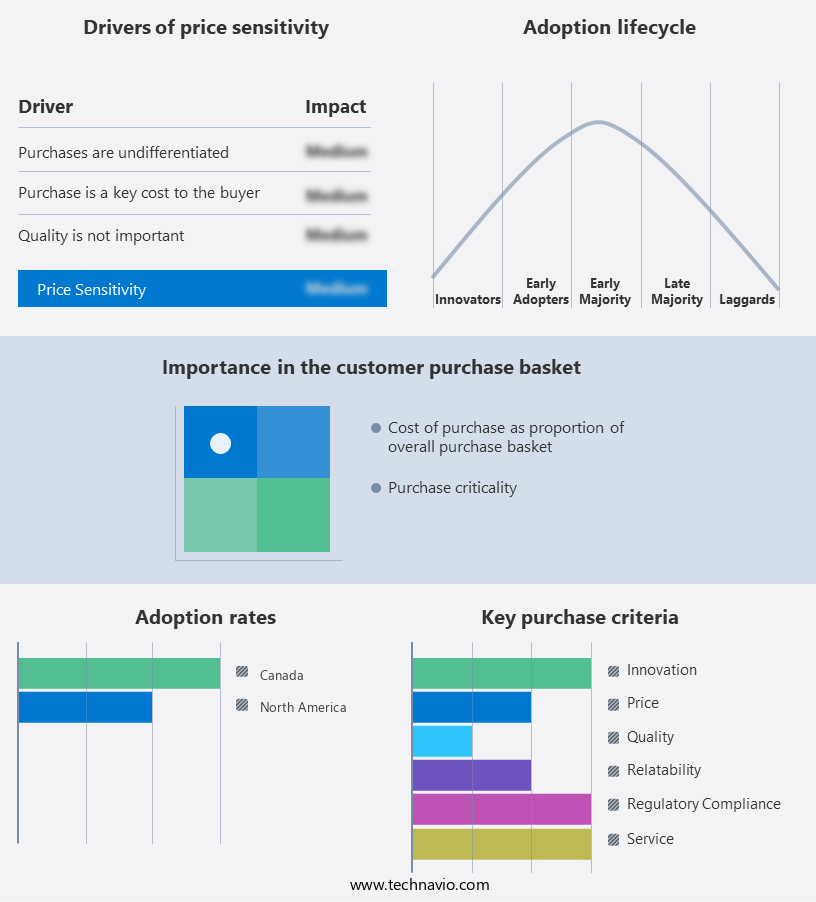
Customer Landscape
Key Companies & Market Insights
Companies are implementing various strategies, such as strategic alliances, partnerships, mergers and acquisitions, geographical expansion, and product/service launches, to enhance their presence in the market.
Bayer AG - The company offers Agrochemicals that focus on sustainable agriculture and regenerative farming practices.
The market research and growth report also includes detailed analyses of the competitive landscape of the market and information about key companies, including:
- AEF Global Inc.
- BASF SE
- Bio-Ferm GmbH
- BRENNTAG SE
- CF Industries Holdings Inc.
- Douglas Agricultural Services Inc.
- Dow Inc.
- DuPont de Nemours Inc.
- Engage Agro Corp.
- Gowan Co.
- Growmark Inc.
- The Mosaic Co.
- Nippon Soda Co. Ltd.
- Nutrien Ltd.
- Pacific Biocontrol Corp.
- The Scotts Co. LLC
- Syngenta Crop Protection AG
- UPL Ltd.
- Yara International ASA
Qualitative and quantitative analysis of companies has been conducted to help clients understand the wider business environment as well as the strengths and weaknesses of key market players. Data is qualitatively analyzed to categorize companies as pure play, category-focused, industry-focused, and diversified; it is quantitatively analyzed to categorize companies as dominant, leading, strong, tentative, and weak.
Market Analyst Overview
The market plays a significant role in the agricultural sector, providing essential crop protection products and fertilizers for optimal crop production. The use of agrochemicals, including pesticides, herbicides, fungicides, and inorganic fertilizers, helps farmers combat various threats to their crops, such as insects, weeds, diseases, and viruses. However, the use of synthetic agrochemicals has faced regulatory scrutiny due to environmental concerns and potential health risks. The Environmental Protection Agency (EPA) and other regulatory bodies have imposed restrictions on the use of certain chemicals, leading to the adoption of organic alternatives and non-ionic surfactants as adjuvants. Organic fertilizers, such as manure and fish meal, have gained popularity as sustainable options for nitrogenous fertilizers like urea.
Furthermore, the agricultural supply chain, from farming to food grains, is undergoing intensification due to population growth and climate change, increasing the demand for crop protection products and fertilizers. The crop lifecycle, from planting to harvest, is critical for farmer welfare and food supply, making the use of agrochemicals an essential part of modern farming practices. Crop production for cash crops, such as cereals & grains, oilseeds, and horticulture crops, requires effective pest management and optimal nutrient supply. Crop loss due to pest attacks, diseases, and unfavorable weather conditions can significantly impact agricultural productivity and wealth. The regulatory framework for agrochemicals is constantly evolving, with rigorous authorization and evaluation processes in place to ensure safety and effectiveness. The agricultural sector's future relies on the development of innovative crop protection solutions, including plant growth promoters, organo-modified siloxanes, and seed treatments, to address the challenges of crop production sustainably and efficiently.
|
Market Scope |
|
|
Report Coverage |
Details |
|
Page number |
133 |
|
Base year |
2023 |
|
Historic period |
2018 - 2022 |
|
Forecast period |
2024-2028 |
|
Growth momentum & CAGR |
Accelerate at a CAGR of 4.3% |
|
Market Growth 2024-2028 |
USD 267.9 million |
|
Market structure |
Fragmented |
|
YoY growth 2023-2024(%) |
4.0 |
|
Competitive landscape |
Leading Companies, Market Positioning of Companies, Competitive Strategies, and Industry Risks |
|
Key companies profiled |
AEF Global Inc., BASF SE, Bayer AG, Bio-Ferm GmbH, BRENNTAG SE, CF Industries Holdings Inc., Douglas Agricultural Services Inc., Dow Inc., DuPont de Nemours Inc., Engage Agro Corp., Gowan Co., Growmark Inc., The Mosaic Co., Nippon Soda Co. Ltd., Nutrien Ltd., Pacific Biocontrol Corp., The Scotts Co. LLC, Syngenta Crop Protection AG, UPL Ltd., and Yara International ASA |
|
Market dynamics |
Parent market analysis, Market growth inducers and obstacles, Fast-growing and slow-growing segment analysis, COVID-19 impact and recovery analysis and future consumer dynamics, Market condition analysis for market forecast period |
|
Customization purview |
If our report has not included the data that you are looking for, you can reach out to our analysts and get segments customized. |
What are the Key Data Covered in this Market Report?
- CAGR of the market during the forecast period
- Detailed information on factors that will drive the market growth and forecasting between 2024 and 2028
- Precise estimation of the size of the market and its contribution of the market in focus to the parent market
- Accurate predictions about upcoming market growth and trends and changes in consumer behaviour
- Growth of the market across Canada
- Thorough analysis of the market's competitive landscape and detailed information about companies
- Comprehensive analysis of factors that will challenge the growth of market companies
We can help! Our analysts can customize this market research report to meet your requirements. Get in touch
 RIA -
RIA - 
