AI And Robotics In Aerospace And Defense Market Analysis, Size, and Forecast 2025-2029: North America (US, Canada, and Mexico), APAC (China, India, and Japan), Europe (UK, Germany, and France), Middle East and Africa (Israel, UAE, and Saudi Arabia), South America (Brazil, Argentina, and Colombia), and Rest of World (ROW)

AI And Robotics In Aerospace And Defense Market Analysis, Size, and Forecast 2025-2029:
North America (US, Canada, and Mexico), APAC (China, India, and Japan), Europe (UK, Germany, and France), Middle East and Africa (Israel, UAE, and Saudi Arabia), South America (Brazil, Argentina, and Colombia), and Rest of World (ROW)

Published: Dec 2025 306 Pages SKU: IRTNTR81060

Market Overview at a Glance

$77.33 B
Market Opportunity
24.5%
CAGR 2024 - 2029
45.7%
North America Growth
$15.30 B
Hardware segment 2023

AI And Robotics In Aerospace And Defense Market Size 2025-2029

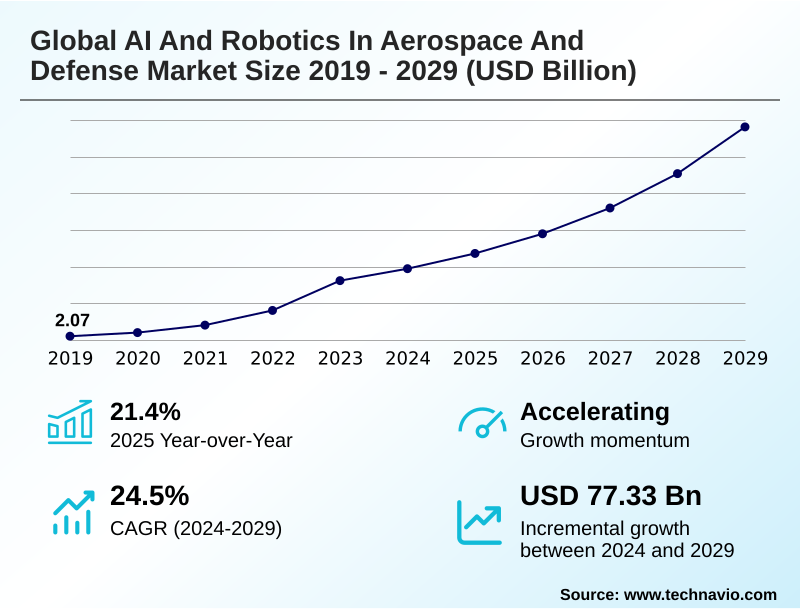
The ai and robotics in aerospace and defense market size is valued to increase by USD 77.33 billion, at a CAGR of 24.5% from 2024 to 2029. Enhanced autonomous capabilities for mission critical operations will drive the ai and robotics in aerospace and defense market.

Major Market Trends & Insights

  • North America dominated the market and accounted for a 45.7% growth during the forecast period.
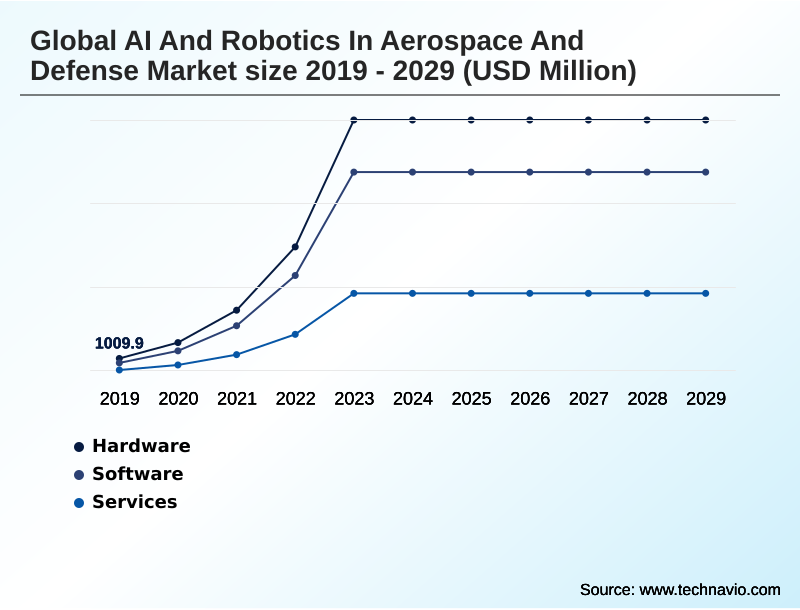
  • By Component - Hardware segment was valued at USD 15.30 billion in 2023
  • By Deployment - On premises segment accounted for the largest market revenue share in 2023

Market Size & Forecast

  • Market Opportunities: USD 114.16 billion
  • Market Future Opportunities: USD 77.33 billion
  • CAGR from 2024 to 2029 : 24.5%

Market Summary

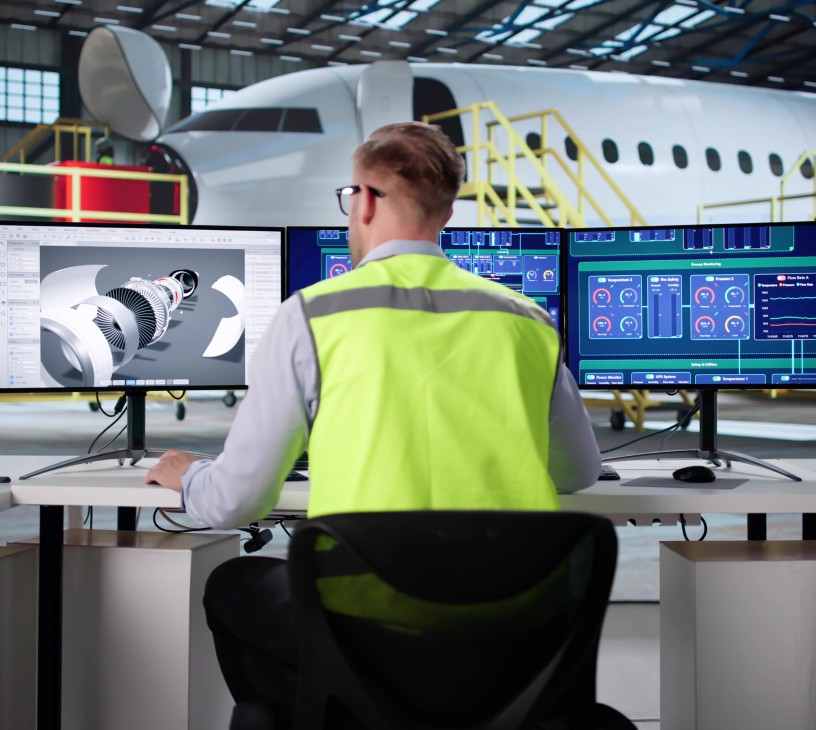
  • The AI And Robotics In Aerospace And Defense Market is undergoing a significant transformation, driven by the strategic imperative to achieve decision superiority and operational efficiency. Enhanced autonomous capabilities are propelling the adoption of intelligent systems for mission-critical operations, ranging from unmanned aerial vehicles executing complex reconnaissance to robotic platforms providing logistical support in hazardous environments.
  • This evolution is underscored by rapid advancements in AI and robotic technologies, enabling new levels of performance and precision. A key application involves the use of AI-driven predictive maintenance platforms, which analyze real-time asset data to forecast component failures, thereby increasing fleet readiness and significantly reducing operational costs.
  • However, the market's trajectory is tempered by considerable challenges, including the high development and integration costs associated with sophisticated systems, persistent cybersecurity vulnerabilities, and the complex ethical questions surrounding the deployment of autonomous weaponry. These factors create a dynamic landscape where innovation must be balanced with rigorous security and regulatory oversight.

What will be the Size of the AI And Robotics In Aerospace And Defense Market during the forecast period?

Get Key Insights on Market Forecast (PDF) Request Free Sample

How is the AI And Robotics In Aerospace And Defense Market Segmented?

The ai and robotics in aerospace and defense industry research report provides comprehensive data (region-wise segment analysis), with forecasts and estimates in "USD million" for the period 2025-2029, as well as historical data from 2019-2023 for the following segments.

  • Component
    • Hardware
    • Software
    • Services
  • Deployment
    • On premises
    • Cloud based
  • Platform
    • Airborne platforms
    • Ground platforms
    • Naval platforms
    • Space platforms
  • Geography
    • North America
      • US
      • Canada
      • Mexico
    • APAC
      • China
      • India
      • Japan
    • Europe
      • UK
      • Germany
      • France
    • Middle East and Africa
      • Israel
      • UAE
      • Saudi Arabia
    • South America
      • Brazil
      • Argentina
      • Colombia
    • Rest of World (ROW)

By Component Insights

The hardware segment is estimated to witness significant growth during the forecast period.

The hardware segment is foundational to the AI and robotics in aerospace and defense market, encompassing the physical components that enable advanced autonomous systems and AI for battlespace awareness.

This includes specialized processors for machine learning, sophisticated sensors for real-time threat detection, and robust robotic platforms like unmanned ground vehicles (UGVs) and collaborative combat aircraft (CCAs).

Innovations in edge AI are driving the development of hardware capable of on-device processing, which is critical for autonomous navigation systems in contested environments.

The integration of AI-driven quality control and digital twins into manufacturing hardware is also enhancing production efficiency and reliability.

The development of high assurance AI necessitates hardware that supports secure and resilient cognitive algorithm deployment, with some platforms improving data processing speeds by over 40% for mission-critical tasks.

Request Free Sample

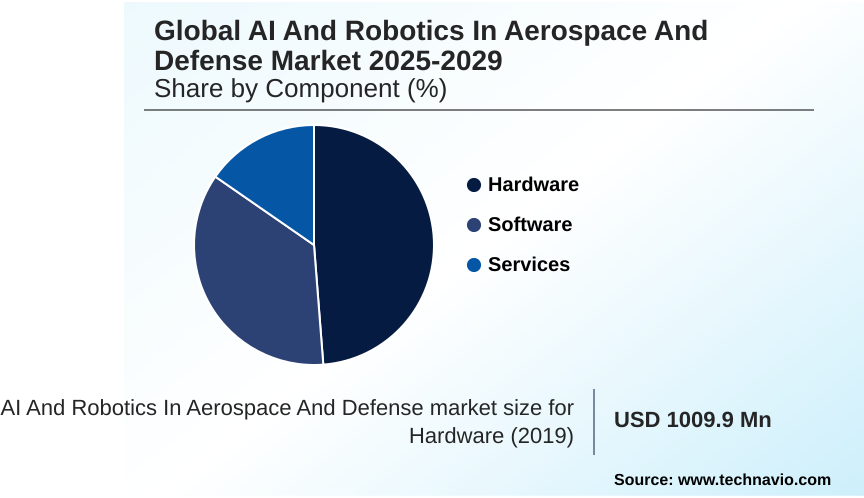
The Hardware segment was valued at USD 15.30 billion in 2023 and showed a gradual increase during the forecast period.

Request Free Sample

Regional Analysis

North America is estimated to contribute 45.7% to the growth of the global market during the forecast period.Technavio’s analysts have elaborately explained the regional trends and drivers that shape the market during the forecast period.

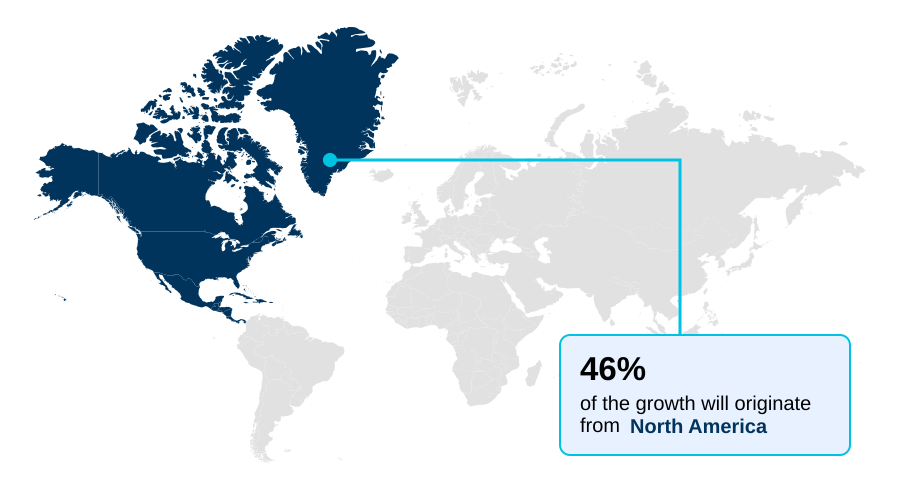
See How AI And Robotics In Aerospace And Defense Market Demand is Rising in North America Request Free Sample

The geographic landscape of the AI and robotics market is led by North America, which accounts for over 45% of the market's incremental growth, primarily due to substantial defense investments in the United States in areas like AI-powered target recognition and autonomous flight technologies.

Meanwhile, the APAC region is projected to witness the fastest growth, with a CAGR of 25%, significantly outpacing Europe's 23.5% growth rate.

This expansion is driven by military modernization programs in countries like China and India, which are heavily investing in AI-enabled command and control and autonomous intelligence surveillance reconnaissance (ISR).

The Middle East and Africa is also an emerging hotspot, demonstrating the highest regional CAGR of 26.2%, as nations focus on adopting AI for national security and AI in combat support to bolster their capabilities.

Market Dynamics

Our researchers analyzed the data with 2024 as the base year, along with the key drivers, trends, and challenges. A holistic analysis of drivers will help companies refine their marketing strategies to gain a competitive advantage.

  • The strategic integration of AI and robotics in aerospace and defense is increasingly focused on complex, long-term objectives that extend beyond simple automation. A primary focus is on integrating AI into legacy defense platforms, a task that presents significant technical hurdles but promises to unlock new capabilities from existing assets.
  • The success of this hinges on addressing the cybersecurity challenges for autonomous defense systems, as supply chain vulnerabilities for AI hardware and the risk of data poisoning remain critical concerns. The impact of AI on modern air combat is another key area, with extensive research dedicated to training AI pilots for collaborative combat.
  • This involves advancing human-machine teaming in combat scenarios, where AI assists human operators rather than replacing them. Furthermore, the industry is grappling with the ethical considerations for developing military AI, particularly in regulating autonomous weapons in international law to prevent uncontrolled escalation.
  • The benefits of robotics in defense manufacturing are more immediate, with some automated processes being twice as efficient as manual methods. In the field, AI's role in space situational awareness and for predictive maintenance in aircraft fleets is revolutionizing operational readiness.
  • Efforts to validate AI systems for mission-critical use are ongoing, addressing issues like challenges of AI data fusion from sensors and the extensive data labeling requirements for defense AI. As the technology matures, generative AI applications in military planning and optimizing logistics with autonomous robots are set to redefine strategic operations.

What are the key market drivers leading to the rise in the adoption of AI And Robotics In Aerospace And Defense Industry?

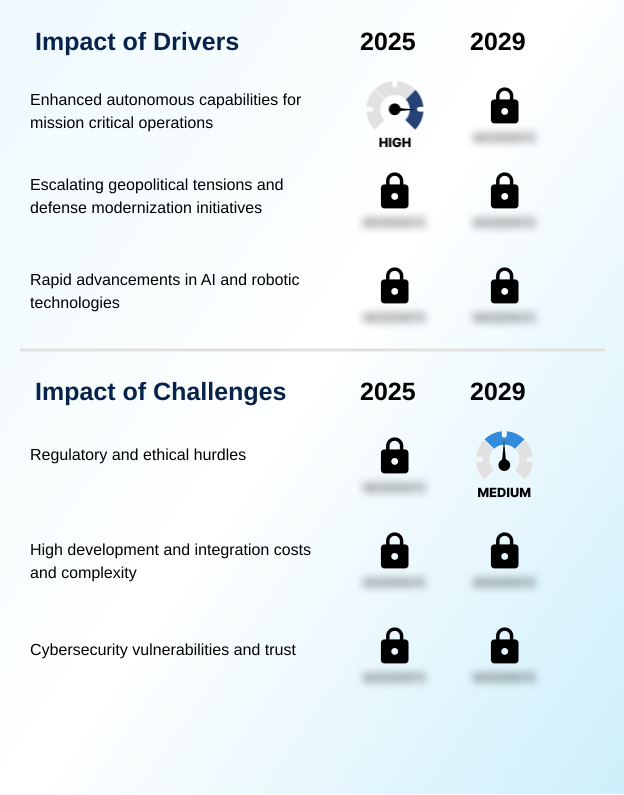
  • The expansion of enhanced autonomous capabilities for mission-critical operations serves as a key driver for market growth.

  • Market growth is primarily driven by escalating defense modernization initiatives and rapid advancements in core technologies like natural language processing.
  • The strategic need for enhanced autonomous capabilities for mission-critical operations is compelling nations to invest heavily in AI and robotics, with some government defense budgets for AI seeing increases of over 30% year-over-year.
  • The development of sophisticated data fusion algorithms and predictive analytics is enabling superior battlespace awareness and AI in electronic warfare.
  • The push for human-in-the-loop control systems ensures that even as platforms like loitering munitions and robotic combat vehicles become more autonomous, critical decision-making remains under human oversight.
  • These advancements in human-machine teaming and AI in military logistics are fundamentally reshaping operational paradigms and enhancing force effectiveness.

What are the market trends shaping the AI And Robotics In Aerospace And Defense Industry?

  • A primary trend shaping the market is the escalating adoption of artificial intelligence. This integration is pivotal for enhancing situational awareness and accelerating decision-making processes.

  • Key trends shaping the market include the increased use of AI for situational awareness and the proliferation of robotics in maintenance. This is evident in the development of AI-driven data analysis tools that process vast sensor inputs to provide a clearer operational picture, improving threat detection accuracy by over 20%.
  • The adoption of swarm technology and autonomous mission planning is transforming strategic capabilities, allowing for more complex and coordinated operations with reduced human oversight. Concurrently, the use of robotics in aircraft manufacturing is optimizing production lines and improving precision.
  • The integration of autonomy software development for attritable autonomous systems is also gaining momentum, with some unmanned platforms now able to conduct missions for over 50 consecutive days, showcasing a significant leap in endurance and operational efficiency for multi-domain operations.

What challenges does the AI And Robotics In Aerospace And Defense Industry face during its growth?

  • The presence of significant regulatory and ethical hurdles presents a key challenge affecting industry growth.

  • Significant challenges constrain the market, led by stringent regulatory frameworks and profound ethical considerations surrounding LAWS. The high development and integration costs, coupled with the complexity of AI integration into legacy systems, present formidable barriers. For example, development cycles for secure autonomous systems can be two to three times longer than for commercial software.
  • Furthermore, persistent cybersecurity vulnerabilities and the need to build trust in AI systems are critical concerns. The threat of adversarial AI attacks and AI model data poisoning necessitates robust, resilient architectures.
  • The reliance on specialized talent and the extensive testing required for systems like AI-defined ground stations and UUVs add to the overall complexity and expense of responsible AI deployment, making it a capital-intensive endeavor.

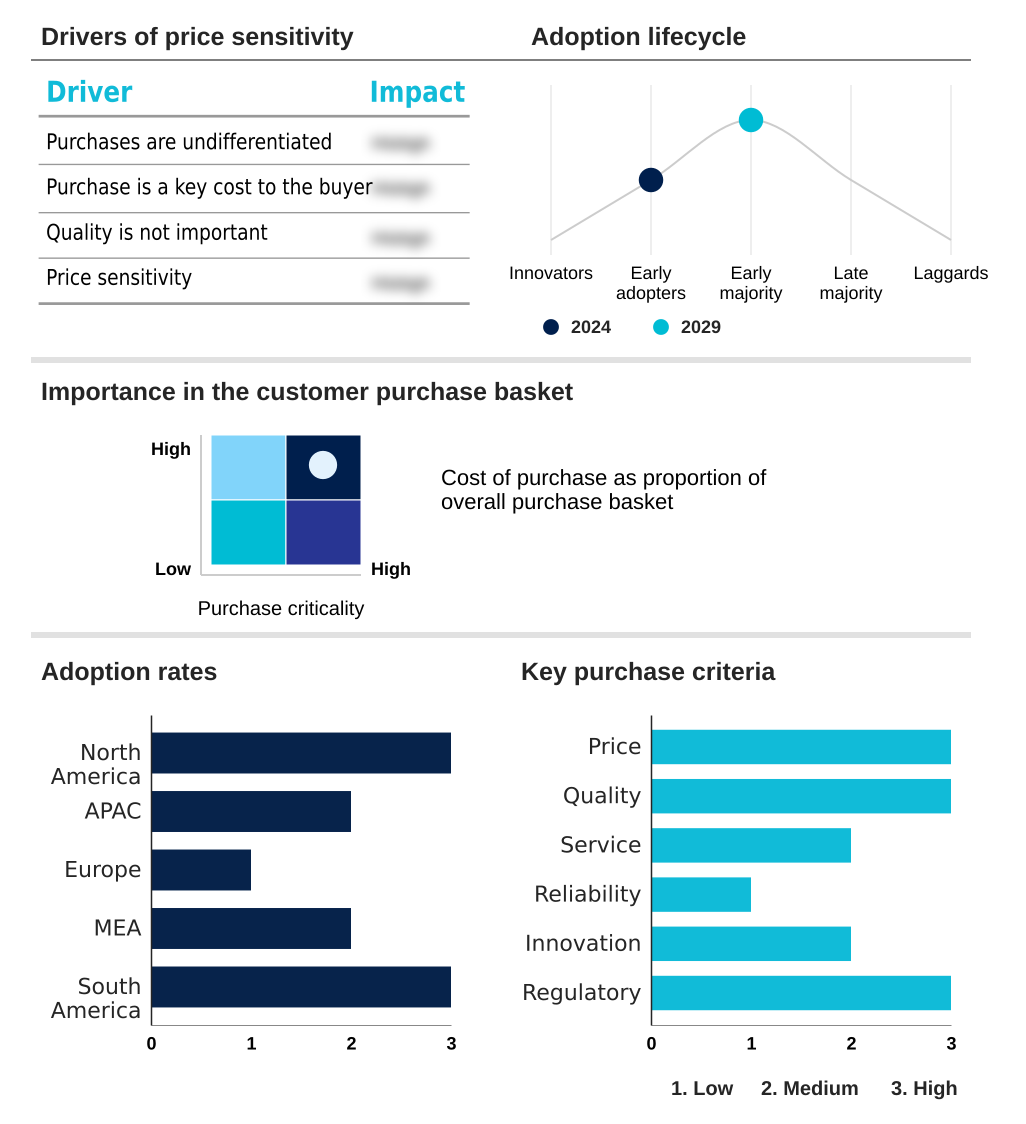
Exclusive Technavio Analysis on Customer Landscape

The ai and robotics in aerospace and defense market forecasting report includes the adoption lifecycle of the market, covering from the innovator’s stage to the laggard’s stage. It focuses on adoption rates in different regions based on penetration. Furthermore, the ai and robotics in aerospace and defense market report also includes key purchase criteria and drivers of price sensitivity to help companies evaluate and develop their market growth analysis strategies.

Customer Landscape of AI And Robotics In Aerospace And Defense Industry

Competitive Landscape

Companies are implementing various strategies, such as strategic alliances, ai and robotics in aerospace and defense market forecast, partnerships, mergers and acquisitions, geographical expansion, and product/service launches, to enhance their presence in the industry.

Airbus SE - Pioneers autonomous flight technologies and robotic assistants, driving innovation in future combat air systems and space exploration platforms.

The industry research and growth report includes detailed analyses of the competitive landscape of the market and information about key companies, including:

  • Airbus SE
  • Anduril Industries Inc.
  • General Electric Co.
  • Honeywell International Inc.
  • Indra Sistemas SA
  • Intel Corp.
  • IBM Corp.
  • Lockheed Martin Corp.
  • Microsoft Corp.
  • Northrop Grumman Corp.
  • NVIDIA Corp.
  • Palantir Technologies Inc.
  • RTX Corp.
  • Shield AI
  • SITA
  • Thales Group
  • The Boeing Co.
  • T-Systems International GmbH

Qualitative and quantitative analysis of companies has been conducted to help clients understand the wider business environment as well as the strengths and weaknesses of key industry players. Data is qualitatively analyzed to categorize companies as pure play, category-focused, industry-focused, and diversified; it is quantitatively analyzed to categorize companies as dominant, leading, strong, tentative, and weak.

Recent Development and News in Ai and robotics in aerospace and defense market

  • In December, 2024, Lockheed Martin Corp. announced the integration of IBM advanced Granite large language models into its AI Factory tools, aiming to enhance innovation across its defense and aerospace offerings.
  • In October, 2024, Northrop Grumman Corp. introduced an artificial intelligence feature to its Forward Area Air Defense Advanced Battle Manager system to improve real-time decision-making for counter-unmanned aerial systems missions.
  • In October, 2024, Lockheed Martin Corp. demonstrated advanced AI-driven autonomous systems for crewed-uncrewed teaming at U.S. Army events, showcasing capabilities in complex air and ground scenarios even with degraded communications.
  • In February, 2025, RTX Corp.'s Raytheon business successfully completed flight testing of its Cognitive Algorithm Deployment System, which integrates AI models into legacy radar warning receiver systems for real-time threat prioritization.

Dive into Technavio’s robust research methodology, blending expert interviews, extensive data synthesis, and validated models for unparalleled AI And Robotics In Aerospace And Defense Market insights. See full methodology.

Market Scope
Page number 306
Base year 2024
Historic period 2019-2023
Forecast period 2025-2029
Growth momentum & CAGR Accelerate at a CAGR of 24.5%
Market growth 2025-2029 USD 77331.3 million
Market structure Fragmented
YoY growth 2024-2025(%) 21.4%
Key countries US, Canada, Mexico, China, India, Japan, South Korea, Australia, Indonesia, UK, Germany, France, Italy, The Netherlands, Spain, Israel, UAE, Saudi Arabia, Turkey, South Africa, Brazil, Argentina and Colombia
Competitive landscape Leading Companies, Market Positioning of Companies, Competitive Strategies, and Industry Risks

Request Free Sample

Research Analyst Overview

  • The AI and robotics in aerospace and defense market is defined by a rapid cycle of innovation, where the development of autonomous systems is a core focus. The proliferation of machine learning and computer vision is enabling sophisticated applications, from unmanned aerial vehicles (UAVs) and unmanned ground vehicles (UGVs) to advanced predictive maintenance platforms.
  • A key area is the development of collaborative combat aircraft (CCAs) and the underlying AI pilots that facilitate crew-uncrewed teaming. The integration of AI-driven decision support systems is transforming command and control, while robotics in manufacturing and maintenance are streamlining production.
  • For instance, AI-driven quality control has been shown to improve defect detection accuracy by up to 30% over manual inspection. However, the advancement of lethal autonomous weapon systems (LAWS) introduces significant ethical and regulatory discussions at the boardroom level, compelling leadership to balance technological advantage with responsible deployment strategies.
  • The push towards multi-domain operations is further driving the need for technologies like drone swarms and AI for threat detection, creating a complex but opportunity-rich landscape.

What are the Key Data Covered in this AI And Robotics In Aerospace And Defense Market Research and Growth Report?

  • What is the expected growth of the AI And Robotics In Aerospace And Defense Market between 2025 and 2029?

    • USD 77.33 billion, at a CAGR of 24.5%

  • What segmentation does the market report cover?

    • The report is segmented by Component (Hardware, Software, Services), Deployment (On premises, Cloud based), Platform (Airborne platforms, Ground platforms, Naval platforms, Space platforms) and Geography (North America, APAC, Europe, Middle East and Africa, South America)

  • Which regions are analyzed in the report?

    • North America, APAC, Europe, Middle East and Africa and South America

  • What are the key growth drivers and market challenges?

    • Enhanced autonomous capabilities for mission critical operations, Regulatory and ethical hurdles

  • Who are the major players in the AI And Robotics In Aerospace And Defense Market?

    • Airbus SE, Anduril Industries Inc., General Electric Co., Honeywell International Inc., Indra Sistemas SA, Intel Corp., IBM Corp., Lockheed Martin Corp., Microsoft Corp., Northrop Grumman Corp., NVIDIA Corp., Palantir Technologies Inc., RTX Corp., Shield AI, SITA, Thales Group, The Boeing Co. and T-Systems International GmbH

Market Research Insights

  • The dynamics of the AI and robotics in aerospace and defense market are shaped by a strategic push for technological superiority. The adoption of AI for operational efficiency and AI for mission readiness is paramount, with some platforms improving threat identification accuracy by over 30% compared to legacy systems.
  • This drive for AI-enabled predictive logistics and decision superiority through AI is balanced by significant implementation hurdles. Development cycles for secure autonomous resupply missions and other advanced systems can be 2-3 times longer than for typical commercial software due to stringent testing and validation requirements.
  • The focus on AI for resource allocation aims to optimize expenditures, but the initial investment in capabilities like generative AI use cases remains a considerable factor for budget-conscious defense organizations.

We can help! Our analysts can customize this ai and robotics in aerospace and defense market research report to meet your requirements.

Get in touch

1. Executive Summary

1.1 Market overview

Executive Summary - Chart on Market Overview
Executive Summary - Data Table on Market Overview
Executive Summary - Chart on Global Market Characteristics
Executive Summary - Chart on Market by Geography
Executive Summary - Chart on Market Segmentation by Component
Executive Summary - Chart on Market Segmentation by Deployment
Executive Summary - Chart on Market Segmentation by Platform
Executive Summary - Chart on Incremental Growth
Executive Summary - Data Table on Incremental Growth
Executive Summary - Chart on Company Market Positioning

2. Technavio Analysis

2.1 Analysis of price sensitivity, lifecycle, customer purchase basket, adoption rates, and purchase criteria

2.2 Criticality of inputs and Factors of differentiation

Chart on Overview on criticality of inputs and factors of differentiation

2.3 Factors of disruption

Chart on Overview on factors of disruption

2.4 Impact of drivers and challenges

Chart on Impact of drivers and challenges in 2024 and 2029

3. Market Landscape

3.1 Market ecosystem

Chart on Parent Market
Data Table on - Parent Market

3.2 Market characteristics

Chart on Market characteristics analysis

3.3 Value chain analysis

Chart on Value chain analysis

4. Market Sizing

4.1 Market definition

Data Table on Offerings of companies included in the market definition

4.2 Market segment analysis

Market segments

4.3 Market size 2024

4.4 Market outlook: Forecast for 2024-2029

Chart on Global - Market size and forecast 2024-2029 ($ million)
Data Table on Global - Market size and forecast 2024-2029 ($ million)
Chart on Global Market: Year-over-year growth 2024-2029 (%)
Data Table on Global Market: Year-over-year growth 2024-2029 (%)

5. Historic Market Size

5.1 Global AI And Robotics In Aerospace And Defense Market 2019 - 2023

Historic Market Size - Data Table on Global AI And Robotics In Aerospace And Defense Market 2019 - 2023 ($ million)

5.2 Component segment analysis 2019 - 2023

Historic Market Size - Component Segment 2019 - 2023 ($ million)

5.3 Deployment segment analysis 2019 - 2023

Historic Market Size - Deployment Segment 2019 - 2023 ($ million)

5.4 Platform segment analysis 2019 - 2023

Historic Market Size - Platform Segment 2019 - 2023 ($ million)

5.5 Geography segment analysis 2019 - 2023

Historic Market Size - Geography Segment 2019 - 2023 ($ million)

5.6 Country segment analysis 2019 - 2023

Historic Market Size - Country Segment 2019 - 2023 ($ million)

6. Five Forces Analysis

6.1 Five forces summary

Five forces analysis - Comparison between 2024 and 2029

6.2 Bargaining power of buyers

Bargaining power of buyers - Impact of key factors 2024 and 2029

6.3 Bargaining power of suppliers

Bargaining power of suppliers - Impact of key factors in 2024 and 2029

6.4 Threat of new entrants

Threat of new entrants - Impact of key factors in 2024 and 2029

6.5 Threat of substitutes

Threat of substitutes - Impact of key factors in 2024 and 2029

6.6 Threat of rivalry

Threat of rivalry - Impact of key factors in 2024 and 2029

6.7 Market condition

Chart on Market condition - Five forces 2024 and 2029

7. Market Segmentation by Component

7.1 Market segments

Chart on Component - Market share 2024-2029 (%)
Data Table on Component - Market share 2024-2029 (%)

7.2 Comparison by Component

Chart on Comparison by Component
Data Table on Comparison by Component

7.3 Hardware - Market size and forecast 2024-2029

Chart on Hardware - Market size and forecast 2024-2029 ($ million)
Data Table on Hardware - Market size and forecast 2024-2029 ($ million)
Chart on Hardware - Year-over-year growth 2024-2029 (%)
Data Table on Hardware - Year-over-year growth 2024-2029 (%)

7.4 Software - Market size and forecast 2024-2029

Chart on Software - Market size and forecast 2024-2029 ($ million)
Data Table on Software - Market size and forecast 2024-2029 ($ million)
Chart on Software - Year-over-year growth 2024-2029 (%)
Data Table on Software - Year-over-year growth 2024-2029 (%)

7.5 Services - Market size and forecast 2024-2029

Chart on Services - Market size and forecast 2024-2029 ($ million)
Data Table on Services - Market size and forecast 2024-2029 ($ million)
Chart on Services - Year-over-year growth 2024-2029 (%)
Data Table on Services - Year-over-year growth 2024-2029 (%)

7.6 Market opportunity by Component

Market opportunity by Component ($ million)
Data Table on Market opportunity by Component ($ million)

8. Market Segmentation by Deployment

8.1 Market segments

Chart on Deployment - Market share 2024-2029 (%)
Data Table on Deployment - Market share 2024-2029 (%)

8.2 Comparison by Deployment

Chart on Comparison by Deployment
Data Table on Comparison by Deployment

8.3 On premises - Market size and forecast 2024-2029

Chart on On premises - Market size and forecast 2024-2029 ($ million)
Data Table on On premises - Market size and forecast 2024-2029 ($ million)
Chart on On premises - Year-over-year growth 2024-2029 (%)
Data Table on On premises - Year-over-year growth 2024-2029 (%)

8.4 Cloud based - Market size and forecast 2024-2029

Chart on Cloud based - Market size and forecast 2024-2029 ($ million)
Data Table on Cloud based - Market size and forecast 2024-2029 ($ million)
Chart on Cloud based - Year-over-year growth 2024-2029 (%)
Data Table on Cloud based - Year-over-year growth 2024-2029 (%)

8.5 Market opportunity by Deployment

Market opportunity by Deployment ($ million)
Data Table on Market opportunity by Deployment ($ million)

9. Market Segmentation by Platform

9.1 Market segments

Chart on Platform - Market share 2024-2029 (%)
Data Table on Platform - Market share 2024-2029 (%)

9.2 Comparison by Platform

Chart on Comparison by Platform
Data Table on Comparison by Platform

9.3 Airborne platforms - Market size and forecast 2024-2029

Chart on Airborne platforms - Market size and forecast 2024-2029 ($ million)
Data Table on Airborne platforms - Market size and forecast 2024-2029 ($ million)
Chart on Airborne platforms - Year-over-year growth 2024-2029 (%)
Data Table on Airborne platforms - Year-over-year growth 2024-2029 (%)

9.4 Ground platforms - Market size and forecast 2024-2029

Chart on Ground platforms - Market size and forecast 2024-2029 ($ million)
Data Table on Ground platforms - Market size and forecast 2024-2029 ($ million)
Chart on Ground platforms - Year-over-year growth 2024-2029 (%)
Data Table on Ground platforms - Year-over-year growth 2024-2029 (%)

9.5 Naval platforms - Market size and forecast 2024-2029

Chart on Naval platforms - Market size and forecast 2024-2029 ($ million)
Data Table on Naval platforms - Market size and forecast 2024-2029 ($ million)
Chart on Naval platforms - Year-over-year growth 2024-2029 (%)
Data Table on Naval platforms - Year-over-year growth 2024-2029 (%)

9.6 Space platforms - Market size and forecast 2024-2029

Chart on Space platforms - Market size and forecast 2024-2029 ($ million)
Data Table on Space platforms - Market size and forecast 2024-2029 ($ million)
Chart on Space platforms - Year-over-year growth 2024-2029 (%)
Data Table on Space platforms - Year-over-year growth 2024-2029 (%)

9.7 Market opportunity by Platform

Market opportunity by Platform ($ million)
Data Table on Market opportunity by Platform ($ million)

10. Customer Landscape

10.1 Customer landscape overview

Analysis of price sensitivity, lifecycle, customer purchase basket, adoption rates, and purchase criteria

11. Geographic Landscape

11.1 Geographic segmentation

Chart on Market share by geography 2024-2029 (%)
Data Table on Market share by geography 2024-2029 (%)

11.2 Geographic comparison

Chart on Geographic comparison
Data Table on Geographic comparison

11.3 North America - Market size and forecast 2024-2029

Chart on North America - Market size and forecast 2024-2029 ($ million)
Data Table on North America - Market size and forecast 2024-2029 ($ million)
Chart on North America - Year-over-year growth 2024-2029 (%)
Data Table on North America - Year-over-year growth 2024-2029 (%)
Chart on Regional Comparison - North America
Data Table on Regional Comparison - North America

11.3.1 US - Market size and forecast 2024-2029

Chart on US - Market size and forecast 2024-2029 ($ million)
Data Table on US - Market size and forecast 2024-2029 ($ million)
Chart on US - Year-over-year growth 2024-2029 (%)
Data Table on US - Year-over-year growth 2024-2029 (%)

11.3.2 Canada - Market size and forecast 2024-2029

Chart on Canada - Market size and forecast 2024-2029 ($ million)
Data Table on Canada - Market size and forecast 2024-2029 ($ million)
Chart on Canada - Year-over-year growth 2024-2029 (%)
Data Table on Canada - Year-over-year growth 2024-2029 (%)

11.3.3 Mexico - Market size and forecast 2024-2029

Chart on Mexico - Market size and forecast 2024-2029 ($ million)
Data Table on Mexico - Market size and forecast 2024-2029 ($ million)
Chart on Mexico - Year-over-year growth 2024-2029 (%)
Data Table on Mexico - Year-over-year growth 2024-2029 (%)

11.4 APAC - Market size and forecast 2024-2029

Chart on APAC - Market size and forecast 2024-2029 ($ million)
Data Table on APAC - Market size and forecast 2024-2029 ($ million)
Chart on APAC - Year-over-year growth 2024-2029 (%)
Data Table on APAC - Year-over-year growth 2024-2029 (%)
Chart on Regional Comparison - APAC
Data Table on Regional Comparison - APAC

11.4.1 China - Market size and forecast 2024-2029

Chart on China - Market size and forecast 2024-2029 ($ million)
Data Table on China - Market size and forecast 2024-2029 ($ million)
Chart on China - Year-over-year growth 2024-2029 (%)
Data Table on China - Year-over-year growth 2024-2029 (%)

11.4.2 India - Market size and forecast 2024-2029

Chart on India - Market size and forecast 2024-2029 ($ million)
Data Table on India - Market size and forecast 2024-2029 ($ million)
Chart on India - Year-over-year growth 2024-2029 (%)
Data Table on India - Year-over-year growth 2024-2029 (%)

11.4.3 Japan - Market size and forecast 2024-2029

Chart on Japan - Market size and forecast 2024-2029 ($ million)
Data Table on Japan - Market size and forecast 2024-2029 ($ million)
Chart on Japan - Year-over-year growth 2024-2029 (%)
Data Table on Japan - Year-over-year growth 2024-2029 (%)

11.4.4 South Korea - Market size and forecast 2024-2029

Chart on South Korea - Market size and forecast 2024-2029 ($ million)
Data Table on South Korea - Market size and forecast 2024-2029 ($ million)
Chart on South Korea - Year-over-year growth 2024-2029 (%)
Data Table on South Korea - Year-over-year growth 2024-2029 (%)

11.4.5 Australia - Market size and forecast 2024-2029

Chart on Australia - Market size and forecast 2024-2029 ($ million)
Data Table on Australia - Market size and forecast 2024-2029 ($ million)
Chart on Australia - Year-over-year growth 2024-2029 (%)
Data Table on Australia - Year-over-year growth 2024-2029 (%)

11.4.6 Indonesia - Market size and forecast 2024-2029

Chart on Indonesia - Market size and forecast 2024-2029 ($ million)
Data Table on Indonesia - Market size and forecast 2024-2029 ($ million)
Chart on Indonesia - Year-over-year growth 2024-2029 (%)
Data Table on Indonesia - Year-over-year growth 2024-2029 (%)

11.5 Europe - Market size and forecast 2024-2029

Chart on Europe - Market size and forecast 2024-2029 ($ million)
Data Table on Europe - Market size and forecast 2024-2029 ($ million)
Chart on Europe - Year-over-year growth 2024-2029 (%)
Data Table on Europe - Year-over-year growth 2024-2029 (%)
Chart on Regional Comparison - Europe
Data Table on Regional Comparison - Europe

11.5.1 UK - Market size and forecast 2024-2029

Chart on UK - Market size and forecast 2024-2029 ($ million)
Data Table on UK - Market size and forecast 2024-2029 ($ million)
Chart on UK - Year-over-year growth 2024-2029 (%)
Data Table on UK - Year-over-year growth 2024-2029 (%)

11.5.2 Germany - Market size and forecast 2024-2029

Chart on Germany - Market size and forecast 2024-2029 ($ million)
Data Table on Germany - Market size and forecast 2024-2029 ($ million)
Chart on Germany - Year-over-year growth 2024-2029 (%)
Data Table on Germany - Year-over-year growth 2024-2029 (%)

11.5.3 France - Market size and forecast 2024-2029

Chart on France - Market size and forecast 2024-2029 ($ million)
Data Table on France - Market size and forecast 2024-2029 ($ million)
Chart on France - Year-over-year growth 2024-2029 (%)
Data Table on France - Year-over-year growth 2024-2029 (%)

11.5.4 Italy - Market size and forecast 2024-2029

Chart on Italy - Market size and forecast 2024-2029 ($ million)
Data Table on Italy - Market size and forecast 2024-2029 ($ million)
Chart on Italy - Year-over-year growth 2024-2029 (%)
Data Table on Italy - Year-over-year growth 2024-2029 (%)

11.5.5 The Netherlands - Market size and forecast 2024-2029

Chart on The Netherlands - Market size and forecast 2024-2029 ($ million)
Data Table on The Netherlands - Market size and forecast 2024-2029 ($ million)
Chart on The Netherlands - Year-over-year growth 2024-2029 (%)
Data Table on The Netherlands - Year-over-year growth 2024-2029 (%)

11.5.6 Spain - Market size and forecast 2024-2029

Chart on Spain - Market size and forecast 2024-2029 ($ million)
Data Table on Spain - Market size and forecast 2024-2029 ($ million)
Chart on Spain - Year-over-year growth 2024-2029 (%)
Data Table on Spain - Year-over-year growth 2024-2029 (%)

11.6 Middle East and Africa - Market size and forecast 2024-2029

Chart on Middle East and Africa - Market size and forecast 2024-2029 ($ million)
Data Table on Middle East and Africa - Market size and forecast 2024-2029 ($ million)
Chart on Middle East and Africa - Year-over-year growth 2024-2029 (%)
Data Table on Middle East and Africa - Year-over-year growth 2024-2029 (%)
Chart on Regional Comparison - Middle East and Africa
Data Table on Regional Comparison - Middle East and Africa

11.6.1 Israel - Market size and forecast 2024-2029

Chart on Israel - Market size and forecast 2024-2029 ($ million)
Data Table on Israel - Market size and forecast 2024-2029 ($ million)
Chart on Israel - Year-over-year growth 2024-2029 (%)
Data Table on Israel - Year-over-year growth 2024-2029 (%)

11.6.2 UAE - Market size and forecast 2024-2029

Chart on UAE - Market size and forecast 2024-2029 ($ million)
Data Table on UAE - Market size and forecast 2024-2029 ($ million)
Chart on UAE - Year-over-year growth 2024-2029 (%)
Data Table on UAE - Year-over-year growth 2024-2029 (%)

11.6.3 Saudi Arabia - Market size and forecast 2024-2029

Chart on Saudi Arabia - Market size and forecast 2024-2029 ($ million)
Data Table on Saudi Arabia - Market size and forecast 2024-2029 ($ million)
Chart on Saudi Arabia - Year-over-year growth 2024-2029 (%)
Data Table on Saudi Arabia - Year-over-year growth 2024-2029 (%)

11.6.4 Turkey - Market size and forecast 2024-2029

Chart on Turkey - Market size and forecast 2024-2029 ($ million)
Data Table on Turkey - Market size and forecast 2024-2029 ($ million)
Chart on Turkey - Year-over-year growth 2024-2029 (%)
Data Table on Turkey - Year-over-year growth 2024-2029 (%)

11.6.5 South Africa - Market size and forecast 2024-2029

Chart on South Africa - Market size and forecast 2024-2029 ($ million)
Data Table on South Africa - Market size and forecast 2024-2029 ($ million)
Chart on South Africa - Year-over-year growth 2024-2029 (%)
Data Table on South Africa - Year-over-year growth 2024-2029 (%)

11.7 South America - Market size and forecast 2024-2029

Chart on South America - Market size and forecast 2024-2029 ($ million)
Data Table on South America - Market size and forecast 2024-2029 ($ million)
Chart on South America - Year-over-year growth 2024-2029 (%)
Data Table on South America - Year-over-year growth 2024-2029 (%)
Chart on Regional Comparison - South America
Data Table on Regional Comparison - South America

11.7.1 Brazil - Market size and forecast 2024-2029

Chart on Brazil - Market size and forecast 2024-2029 ($ million)
Data Table on Brazil - Market size and forecast 2024-2029 ($ million)
Chart on Brazil - Year-over-year growth 2024-2029 (%)
Data Table on Brazil - Year-over-year growth 2024-2029 (%)

11.7.2 Argentina - Market size and forecast 2024-2029

Chart on Argentina - Market size and forecast 2024-2029 ($ million)
Data Table on Argentina - Market size and forecast 2024-2029 ($ million)
Chart on Argentina - Year-over-year growth 2024-2029 (%)
Data Table on Argentina - Year-over-year growth 2024-2029 (%)

11.7.3 Colombia - Market size and forecast 2024-2029

Chart on Colombia - Market size and forecast 2024-2029 ($ million)
Data Table on Colombia - Market size and forecast 2024-2029 ($ million)
Chart on Colombia - Year-over-year growth 2024-2029 (%)
Data Table on Colombia - Year-over-year growth 2024-2029 (%)

11.8 Market opportunity by geography

Market opportunity by geography ($ million)
Data Tables on Market opportunity by geography ($ million)

12. Drivers, Challenges, and Opportunity

12.1 Market drivers

Enhanced autonomous capabilities for mission critical operations
Escalating geopolitical tensions and defense modernization initiatives
Rapid advancements in AI and robotic technologies

12.2 Market challenges

Regulatory and ethical hurdles
High development and integration costs and complexity
Cybersecurity vulnerabilities and trust

12.3 Impact of drivers and challenges

Impact of drivers and challenges in 2024 and 2029

12.4 Market opportunities

Increased adoption of AI for enhanced situational awareness and decision making
Proliferation of autonomous systems and robotics
Integration of AI and robotics in manufacturing and maintenance for aerospace and defense

13. Competitive Landscape

13.1 Overview

13.2

Overview on criticality of inputs and factors of differentiation

13.3 Landscape disruption

Overview on factors of disruption

13.4 Industry risks

Impact of key risks on business

14. Competitive Analysis

14.1 Companies profiled

Companies covered

14.2 Company ranking index

14.3 Market positioning of companies

Matrix on companies position and classification

14.4 Airbus SE

Airbus SE - Overview
Airbus SE - Business segments
Airbus SE - Key news
Airbus SE - Key offerings
Airbus SE - Segment focus
SWOT

14.5 General Electric Co.

General Electric Co. - Overview
General Electric Co. - Business segments
General Electric Co. - Key news
General Electric Co. - Key offerings
General Electric Co. - Segment focus
SWOT

14.6 Honeywell International Inc.

Honeywell International Inc. - Overview
Honeywell International Inc. - Business segments
Honeywell International Inc. - Key news
Honeywell International Inc. - Key offerings
Honeywell International Inc. - Segment focus
SWOT

14.7 Indra Sistemas SA

Indra Sistemas SA - Overview
Indra Sistemas SA - Business segments
Indra Sistemas SA - Key news
Indra Sistemas SA - Key offerings
Indra Sistemas SA - Segment focus
SWOT

14.8 Intel Corp.

Intel Corp. - Overview
Intel Corp. - Business segments
Intel Corp. - Key news
Intel Corp. - Key offerings
Intel Corp. - Segment focus
SWOT

14.9 IBM Corp.

IBM Corp. - Overview
IBM Corp. - Business segments
IBM Corp. - Key news
IBM Corp. - Key offerings
IBM Corp. - Segment focus
SWOT

14.10 Lockheed Martin Corp.

Lockheed Martin Corp. - Overview
Lockheed Martin Corp. - Business segments
Lockheed Martin Corp. - Key news
Lockheed Martin Corp. - Key offerings
Lockheed Martin Corp. - Segment focus
SWOT

14.11 Microsoft Corp.

Microsoft Corp. - Overview
Microsoft Corp. - Business segments
Microsoft Corp. - Key news
Microsoft Corp. - Key offerings
Microsoft Corp. - Segment focus
SWOT

14.12 Northrop Grumman Corp.

Northrop Grumman Corp. - Overview
Northrop Grumman Corp. - Business segments
Northrop Grumman Corp. - Key news
Northrop Grumman Corp. - Key offerings
Northrop Grumman Corp. - Segment focus
SWOT

14.13 NVIDIA Corp.

NVIDIA Corp. - Overview
NVIDIA Corp. - Business segments
NVIDIA Corp. - Key news
NVIDIA Corp. - Key offerings
NVIDIA Corp. - Segment focus
SWOT

14.14 Palantir Technologies Inc.

Palantir Technologies Inc. - Overview
Palantir Technologies Inc. - Product / Service
Palantir Technologies Inc. - Key offerings
SWOT

14.15 RTX Corp.

RTX Corp. - Overview
RTX Corp. - Business segments
RTX Corp. - Key news
RTX Corp. - Key offerings
RTX Corp. - Segment focus
SWOT

14.16 Shield AI

Shield AI - Overview
Shield AI - Product / Service
Shield AI - Key offerings
SWOT

14.17 Thales Group

Thales Group - Overview
Thales Group - Business segments
Thales Group - Key news
Thales Group - Key offerings
Thales Group - Segment focus
SWOT

14.18 The Boeing Co.

The Boeing Co. - Overview
The Boeing Co. - Business segments
The Boeing Co. - Key news
The Boeing Co. - Key offerings
The Boeing Co. - Segment focus
SWOT

15. Appendix

15.1 Scope of the report

Market definition
Objectives
Notes and caveats

15.2 Inclusions and exclusions checklist

Inclusions checklist
Exclusions checklist

15.3 Currency conversion rates for US$

15.4 Research methodology

15.5 Data procurement

Information sources

15.6 Data validation

15.7 Validation techniques employed for market sizing

15.8 Data synthesis

15.9 360 degree market analysis

15.10 List of abbreviations

Research Methodology

Technavio presents a detailed picture of the market by way of study, synthesis, and summation of data from multiple sources. The analysts have presented the various facets of the market with a particular focus on identifying the key industry influencers. The data thus presented is comprehensive, reliable, and the result of extensive research, both primary and secondary.

INFORMATION SOURCES

Primary sources

  • Manufacturers and suppliers
  • Channel partners
  • Industry experts
  • Strategic decision makers

Secondary sources

  • Industry journals and periodicals
  • Government data
  • Financial reports of key industry players
  • Historical data
  • Press releases

DATA ANALYSIS

Data Synthesis

  • Collation of data
  • Estimation of key figures
  • Analysis of derived insights

Data Validation

  • Triangulation with data models
  • Reference against proprietary databases
  • Corroboration with industry experts

REPORT WRITING

Qualitative

  • Market drivers
  • Market challenges
  • Market trends
  • Five forces analysis

Quantitative

  • Market size and forecast
  • Market segmentation
  • Geographical insights
  • Competitive landscape

Interested in this report?

Get your sample now to see our research methodology and insights!

Download Now

Frequently Asked Questions

AI And Robotics In Aerospace And Defense market growth will increase by USD 77331.3 million during 2025-2029.

The AI And Robotics In Aerospace And Defense market is expected to grow at a CAGR of 24.5% during 2025-2029.

AI And Robotics In Aerospace And Defense market is segmented by Component (Hardware, Software, Services) Deployment (On premises, Cloud based) Platform (Airborne platforms, Ground platforms, Naval platforms, Space platforms)

Airbus SE, Anduril Industries Inc., General Electric Co., Honeywell International Inc., Indra Sistemas SA, Intel Corp., IBM Corp., Lockheed Martin Corp., Microsoft Corp., Northrop Grumman Corp., NVIDIA Corp., Palantir Technologies Inc., RTX Corp., Shield AI, SITA, Thales Group, The Boeing Co., T-Systems International GmbH are a few of the key vendors in the AI And Robotics In Aerospace And Defense market.

North America will register the highest growth rate of 45.7% among the other regions. Therefore, the AI And Robotics In Aerospace And Defense market in North America is expected to garner significant business opportunities for the vendors during the forecast period.

US, Canada, Mexico, China, India, Japan, South Korea, Australia, Indonesia, UK, Germany, France, Italy, The Netherlands, Spain, Israel, UAE, Saudi Arabia, Turkey, South Africa, Brazil, Argentina, Colombia

  • Enhanced autonomous capabilities for mission critical operations is the driving factor this market.

The AI And Robotics In Aerospace And Defense market vendors should focus on grabbing business opportunities from the Component segment as it accounted for the largest market share in the base year.