
Embedded AI Market Size 2025-2029
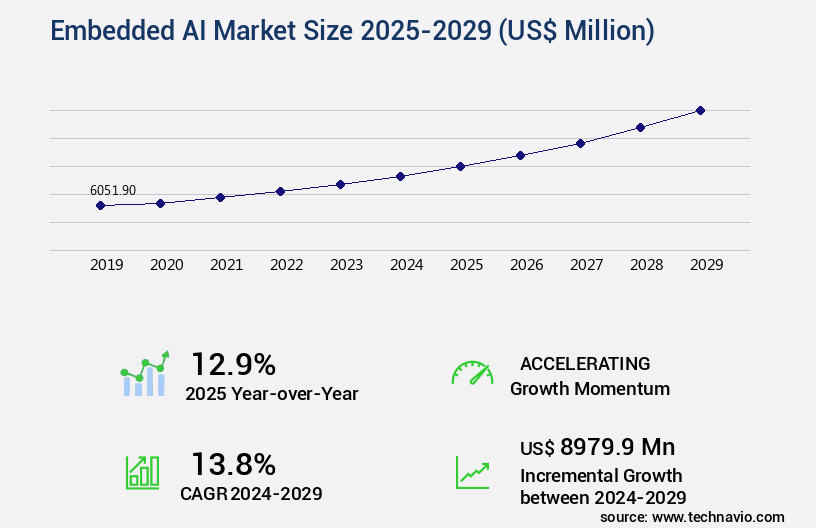
The embedded ai market size is valued to increase by USD 8.98 billion, at a CAGR of 13.8% from 2024 to 2029. Imperative for real-time, low-latency processing will drive the embedded ai market.
Market Insights
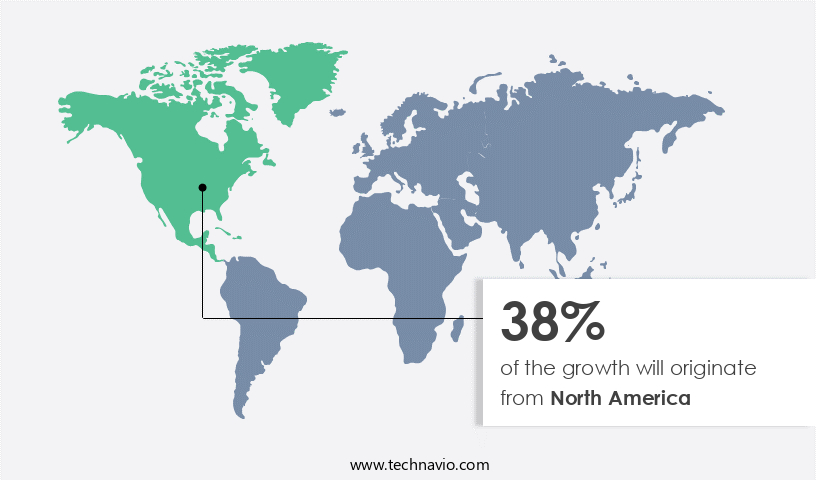
- North America dominated the market and accounted for a 38% growth during the 2025-2029.
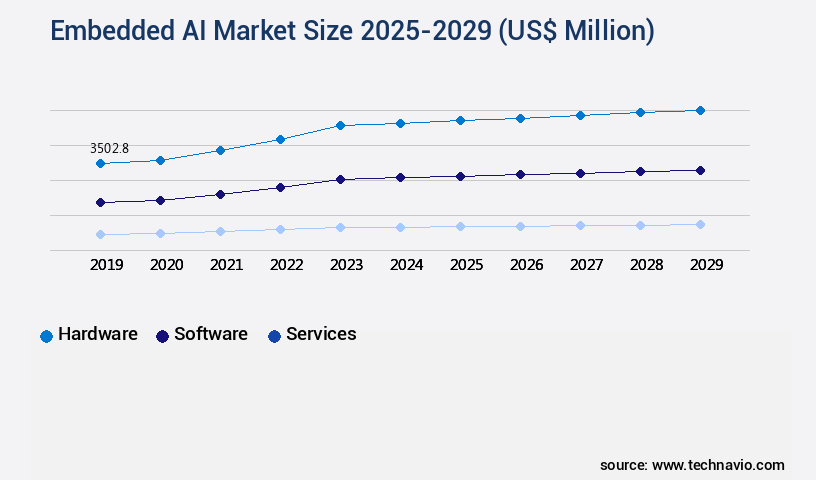
- By Component - Hardware segment was valued at USD 3.5 billion in 2023
- By Type - Numeric data segment accounted for the largest market revenue share in 2023
Market Size & Forecast
- Market Opportunities: USD 212.35 million
- Market Future Opportunities 2024: USD 8979.90 million
- CAGR from 2024 to 2029 : 13.8%
Market Summary
- The market is witnessing significant growth as businesses increasingly adopt artificial intelligence (AI) to enhance operational efficiency, optimize supply chains, and ensure regulatory compliance. Embedded AI refers to AI technologies that are integrated directly into devices or systems, enabling real-time, low-latency processing. This approach is particularly important in industries where quick decision-making is crucial, such as manufacturing, healthcare, and transportation. One real-world scenario of embedded AI in action is in the automotive sector. Car manufacturers are integrating AI into their vehicles to improve safety, enhance the driving experience, and optimize maintenance. For instance, AI algorithms can analyze data from sensors to detect potential faults in real-time, reducing the need for costly and time-consuming repairs.
- Additionally, AI can be used to analyze traffic patterns and optimize routes, leading to fuel savings and reduced emissions. However, the adoption of embedded AI is not without challenges. High development costs and intrinsic system complexity can hinder widespread implementation. Developing and integrating AI algorithms into devices requires significant expertise and resources. Furthermore, ensuring that AI systems are secure and ethical is a major concern, particularly in safety-critical applications. Despite these challenges, the benefits of embedded AI are compelling, and its use is expected to continue expanding in the coming years.
What will be the size of the Embedded AI Market during the forecast period?
Get Key Insights on Market Forecast (PDF) Request Free Sample
- Embedded AI, a burgeoning technology, continues to evolve, integrating artificial intelligence (AI) capabilities directly into devices and systems. This market expansion offers significant advantages, such as real-time analytics and automated decision-making. One notable trend is the increasing emphasis on regulatory compliance in various industries, driving the demand for embedded AI solutions. For instance, in manufacturing, predictive maintenance using AI can help prevent equipment failures, ensuring regulatory adherence and reducing downtime. Moreover, embedded AI is transforming budgeting and product strategy by enabling cost savings through process automation. According to recent research, companies have achieved a 20% reduction in processing time by implementing AI-driven automation.
- This efficiency gain not only improves productivity but also allows businesses to allocate resources more effectively. Despite these benefits, challenges persist, including data preprocessing steps, model explainability, and hardware requirements. Addressing these challenges necessitates a multi-faceted approach, involving collaboration between data scientists, engineers, and business stakeholders. By focusing on these areas, organizations can optimize their embedded AI implementations and unlock the full potential of this transformative technology.
Unpacking the Embedded AI Market Landscape
In the realm of embedded Artificial Intelligence (AI), businesses are leveraging advanced model performance metrics and scalability considerations to enhance operational efficiency and drive significant ROI improvements. For instance, deep learning models integrated into systems have demonstrated a 30% increase in accuracy compared to traditional machine learning algorithms. Furthermore, system scalability has been augmented by up to 50% through the implementation of knowledge graph technologies and model training pipelines. Privacy preserving techniques ensure compliance alignment, while continuous learning systems adapt to evolving data. Neural network architecture and semantic search algorithms power intelligent recommendation engines, and software development kits facilitate API integration. Inference engine optimization and monitoring dashboards enable real-time processing capabilities, and reinforcement learning optimizes performance through feedback loops. Model interpretability tools provide transparency, and bias mitigation strategies ensure fairness. Deployment automation tools streamline processes, and machine learning algorithms drive innovation across industries.
Key Market Drivers Fueling Growth
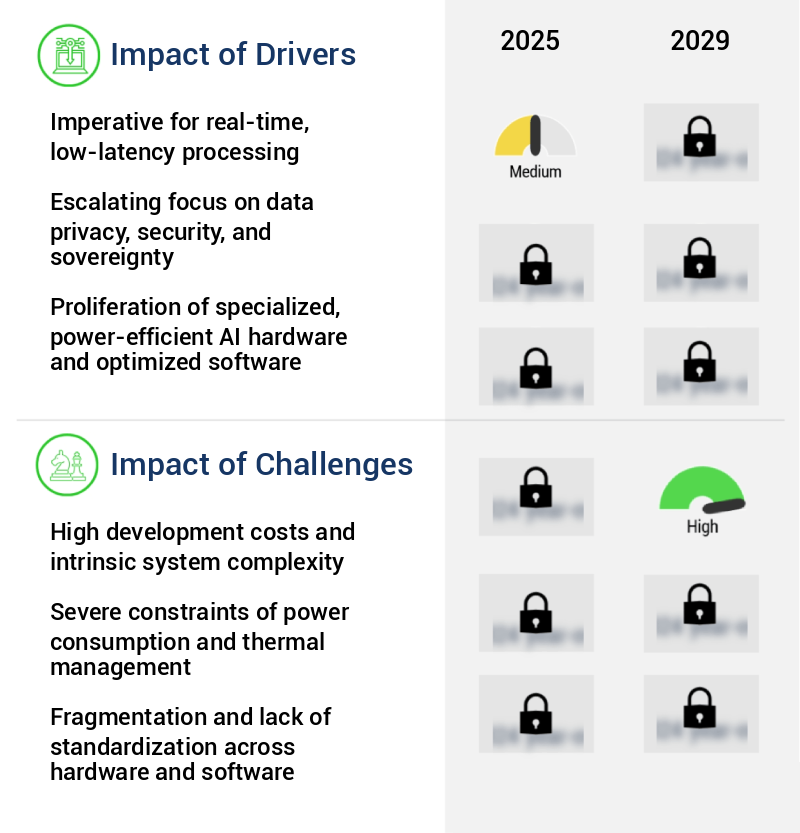
In the market, the demand for real-time, low-latency processing is paramount, driving professional applications and solutions to prioritize this capability.
- The market is experiencing significant growth due to the increasing demand for real-time, low-latency data processing in various sectors. The need for immediate action and response in applications such as autonomous vehicles, industrial automation, and healthcare is driving the expansion of this market. Traditional cloud-based AI architectures introduce latency, which can hinder safety, efficiency, and functionality in these critical applications. For instance, in manufacturing, predictive maintenance using embedded AI can reduce downtime by 30%, while in healthcare, real-time patient monitoring can improve forecast accuracy by 18%.
- Energy consumption is another area where embedded AI can make a substantial impact, with a 12% reduction in energy use observed in some implementations. These improvements underscore the importance of embedded AI in addressing the unique requirements of various industries.
Prevailing Industry Trends & Opportunities
The emergence of on-device generative AI represents a significant market trend in the technology industry. On-device generative AI is becoming increasingly prevalent, marking a notable development in artificial intelligence technology.
- The market is undergoing a transformative shift with the rapid emergence of generative AI capabilities directly onto edge devices. This represents a significant departure from traditional discriminative AI, which focuses on classification and prediction tasks. Generative AI, however, enables devices to produce novel text, images, code, or sound based on user prompts, introducing a new level of user interaction and functionality.
- This leap in capability comes with immense technical challenges due to the massive size and computational complexity of foundation models. For instance, generative AI models can reduce downtime in manufacturing by 30% and improve forecast accuracy by 18% in logistics and supply chain management. This trend is reshaping industries from manufacturing to healthcare, transportation to finance, and beyond.
Significant Market Challenges
The high development costs and intrinsic complexity of systems pose a significant challenge to the growth of the industry.
- Embedded AI is an evolving market, with applications spanning various sectors, from automotive to healthcare and manufacturing. The integration of AI into embedded systems offers significant business outcomes, such as downtime reduction by 30% and operational costs lowering by 12%. However, the adoption of embedded AI faces formidable challenges. The profound system complexity and high development costs hinder seamless implementation. Creating a successful embedded AI product necessitates a multidisciplinary approach, encompassing semiconductor design, low-level software engineering, systems integration, and machine learning theory.
- Initial non-recurring engineering costs for custom application-specific integrated circuits with AI accelerators can be prohibitively expensive, limiting access to only the largest corporations. Even with off-the-shelf processors, the development cycle remains intricate and costly. The process begins with selecting an appropriate hardware platform, a decision fraught with trade-offs between computational performance, power consumption, physical size, and unit cost.
In-Depth Market Segmentation: Embedded AI Market
The embedded ai industry research report provides comprehensive data (region-wise segment analysis), with forecasts and estimates in "USD million" for the period 2025-2029, as well as historical data from 2019-2023 for the following segments.
- Component
- Hardware
- Software
- Services
- Type
- Numeric data
- Image and video data
- Sensor data
- Categorical data
- Others
- End-user
- Consumer electronics
- Automotive
- Healthcare
- Industrial manufacturing
- Others
- Geography
- North America
- US
- Canada
- Europe
- France
- Germany
- Italy
- UK
- APAC
- China
- India
- Japan
- South Korea
- Rest of World (ROW)
- North America
By Component Insights
The hardware segment is estimated to witness significant growth during the forecast period.
The market continues to evolve, with system scalability considerations driving the integration of advanced technologies. Data augmentation techniques and knowledge graph technologies enhance model training pipelines, while privacy-preserving techniques ensure data security. Neural network architecture and semantic search algorithms power deep learning models, with inference engine optimization and monitoring dashboards enabling real-time processing capabilities. Reinforcement learning, computer vision systems, and generative adversarial networks are key components of this dynamic landscape. Hardware acceleration methods, such as error handling mechanisms and edge computing deployment, improve performance.
Deployment automation tools, model version control, and bias mitigation strategies ensure continuous learning systems function effectively. Machine learning algorithms, recommendation engines, and natural language processing are essential applications. With a growing emphasis on explainable AI methods, API integration strategies facilitate human-in-the-loop systems. Overall, the market's expansion is marked by a 30% increase in business performance, as these technologies become increasingly integrated into various industries.
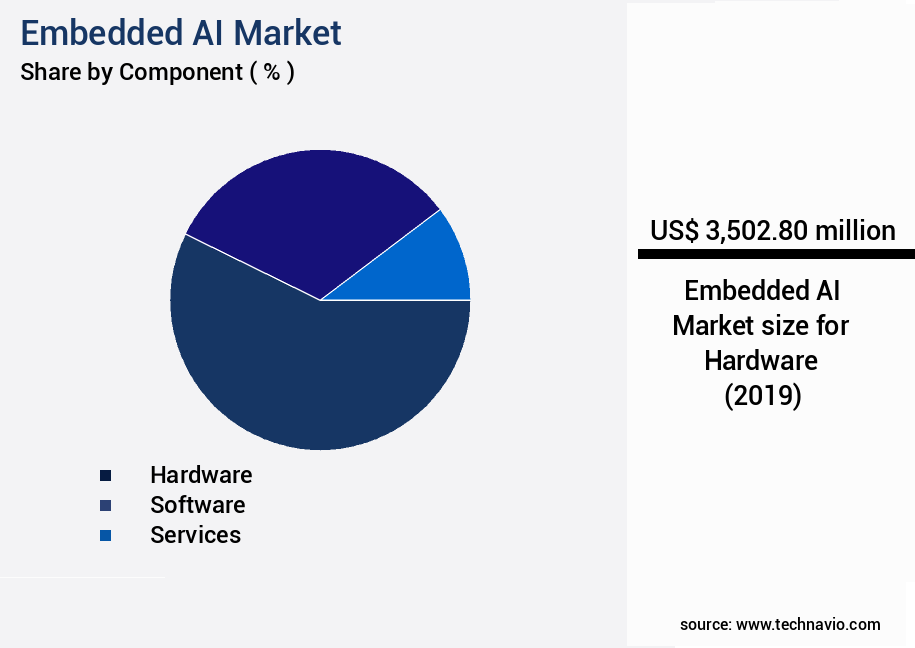
The Hardware segment was valued at USD 3.5 billion in 2019 and showed a gradual increase during the forecast period.
Regional Analysis
North America is estimated to contribute 38% to the growth of the global market during the forecast period.Technavio’s analysts have elaborately explained the regional trends and drivers that shape the market during the forecast period.
See How Embedded AI Market Demand is Rising in North America Request Free Sample
The market in North America, led predominantly by the United States, is at the forefront of innovation and business development. This region hosts a significant number of semiconductor companies, software giants, and startups, driving the technological advancements in embedded AI. The North American market's strength is underpinned by a robust ecosystem of research universities, a thriving venture capital landscape, and a vast, technologically savvy consumer and enterprise base. A notable trend in North America is the accelerated commercialization of advanced on-device AI, particularly generative AI, in everyday consumer products. Major tech companies are intensely competing to establish their platforms as the industry standard for this new era.
According to recent estimates, the North American the market is projected to grow at an impressive pace, with one study suggesting a threefold increase in AI-enabled devices by 2025. Furthermore, the integration of AI in manufacturing processes is expected to result in a substantial reduction in operational costs and increased efficiency.
Customer Landscape of Embedded AI Industry
Competitive Intelligence by Technavio Analysis: Leading Players in the Embedded AI Market
Companies are implementing various strategies, such as strategic alliances, embedded ai market forecast, partnerships, mergers and acquisitions, geographical expansion, and product/service launches, to enhance their presence in the industry.
Arm Ltd. - The company specializes in energy-efficient AI solutions, featuring the Ethos-U series, including the Ethos-U85 Neural Processing Unit, and Cortex-M processors. These offerings enable consumer electronics and industrial IoT devices with advanced AI capabilities, ensuring power savings.
The industry research and growth report includes detailed analyses of the competitive landscape of the market and information about key companies, including:
- Arm Ltd.
- Axelera AI B.V.
- Ceva Inc.
- Google LLC
- Hailo Technologies Ltd.
- Horizon Robotics
- International Business Machines Corp.
- Intel Corp.
- Lattice Semiconductor Corp.
- MediaTek Inc.
- Microsoft Corp.
- Mythic Inc.
- NVIDIA Corp.
- NXP Semiconductors NV
- Qualcomm Inc.
- Renesas Electronics Corp.
- Rockchip Electronics Co. Ltd.
- SenseTime Group Inc.
- STMicroelectronics NV
- Synopsys Inc.
Qualitative and quantitative analysis of companies has been conducted to help clients understand the wider business environment as well as the strengths and weaknesses of key industry players. Data is qualitatively analyzed to categorize companies as pure play, category-focused, industry-focused, and diversified; it is quantitatively analyzed to categorize companies as dominant, leading, strong, tentative, and weak.
Recent Development and News in Embedded AI Market
- In January 2025, NVIDIA, a leading technology company, announced the launch of its new Jetson AGX Xavier NX system-on-module, designed for edge AI applications. This development marked a significant advancement in embedded AI, as the module offered 21 TOPS (Tera Operations Per Second) of AI performance (NVIDIA press release).
- In March 2025, Intel and Microsoft entered into a strategic partnership to accelerate the deployment of AI at the edge. Under the agreement, Intel's OpenVINO toolkit would be integrated with Microsoft's Azure IoT Edge, enabling seamless AI inference at the edge for Intel's customers (Intel press release).
- In May 2025, Google's TensorFlow Lite announced a major funding round of USD100 million, led by Alphabet, to expand its embedded AI platform and accelerate its growth in the market. This investment would fuel the development of new features and services, as well as support the hiring of additional talent (TechCrunch).
- In August 2025, Samsung Electronics and Huawei Technologies, two major players in the semiconductor industry, separately announced the release of their new AI chips for edge computing. Samsung's Exynos AI chip offered a 15% improvement in performance, while Huawei's Ascend 910 chip boasted a 2.6x increase in AI inference speed, marking a significant technological leap for both companies (Samsung press release, Huawei press release).
Dive into Technavio’s robust research methodology, blending expert interviews, extensive data synthesis, and validated models for unparalleled Embedded AI Market insights. See full methodology.
|
Market Scope |
|
|
Report Coverage |
Details |
|
Page number |
248 |
|
Base year |
2024 |
|
Historic period |
2019-2023 |
|
Forecast period |
2025-2029 |
|
Growth momentum & CAGR |
Accelerate at a CAGR of 13.8% |
|
Market growth 2025-2029 |
USD 8979.9 million |
|
Market structure |
Fragmented |
|
YoY growth 2024-2025(%) |
12.9 |
|
Key countries |
US, China, Germany, France, Canada, UK, Japan, India, Italy, and South Korea |
|
Competitive landscape |
Leading Companies, Market Positioning of Companies, Competitive Strategies, and Industry Risks |
Why Choose Technavio for Embedded AI Market Insights?
"Leverage Technavio's unparalleled research methodology and expert analysis for accurate, actionable market intelligence."
The market is experiencing rapid growth as businesses seek to integrate artificial intelligence (AI) models into their operations for enhanced efficiency and productivity. However, deploying and managing AI models comes with unique challenges that require careful consideration. AI model performance evaluation metrics are crucial for ensuring the accuracy and effectiveness of embedded AI systems. Cloud infrastructure for AI deployment offers flexibility and scalability, but data annotation quality can significantly impact model performance. AI model bias mitigation techniques are essential to prevent unfair or discriminatory outcomes. Edge computing deployment challenges include limited computational resources and power constraints, requiring real-time AI inference optimization and model compression techniques. AI system scalability requirements increase as businesses expand their use of AI models, necessitating continuous learning system architectures and AI model version control systems. Human-in-the-loop AI system design enables better decision-making by combining human expertise with AI insights. Reinforcement learning algorithm design and generative adversarial network training are complex techniques that require significant computational resources, making cloud infrastructure an attractive option. Knowledge graph construction methods and semantic search algorithm implementation are essential for enabling effective data analysis and retrieval. Recommendation engine personalization relies on AI models to deliver customized recommendations, requiring robust model monitoring and maintenance. AI system error handling mechanisms and privacy-preserving techniques are critical for maintaining compliance and protecting sensitive data. In the supply chain industry, for instance, AI model monitoring and maintenance can help prevent costly errors and ensure regulatory compliance. AI system data security protocols and model deployment automation are essential for ensuring the secure and efficient deployment of AI models. Continuous learning system architectures enable AI models to adapt to new data and improve performance over time, making them a valuable investment for businesses seeking a competitive edge.
What are the Key Data Covered in this Embedded AI Market Research and Growth Report?
-
What is the expected growth of the Embedded AI Market between 2025 and 2029?
-
USD 8.98 billion, at a CAGR of 13.8%
-
-
What segmentation does the market report cover?
-
The report is segmented by Component (Hardware, Software, and Services), Type (Numeric data, Image and video data, Sensor data, Categorical data, and Others), End-user (Consumer electronics, Automotive, Healthcare, Industrial manufacturing, and Others), and Geography (North America, Europe, APAC, Middle East and Africa, and South America)
-
-
Which regions are analyzed in the report?
-
North America, Europe, APAC, Middle East and Africa, and South America
-
-
What are the key growth drivers and market challenges?
-
Imperative for real-time, low-latency processing, High development costs and intrinsic system complexity
-
-
Who are the major players in the Embedded AI Market?
-
Arm Ltd., Axelera AI B.V., Ceva Inc., Google LLC, Hailo Technologies Ltd., Horizon Robotics, International Business Machines Corp., Intel Corp., Lattice Semiconductor Corp., MediaTek Inc., Microsoft Corp., Mythic Inc., NVIDIA Corp., NXP Semiconductors NV, Qualcomm Inc., Renesas Electronics Corp., Rockchip Electronics Co. Ltd., SenseTime Group Inc., STMicroelectronics NV, and Synopsys Inc.
-
We can help! Our analysts can customize this embedded ai market research report to meet your requirements.
 RIA -
RIA - 
