
Real-Time Decision-Making AI Agents Market Size 2025-2029
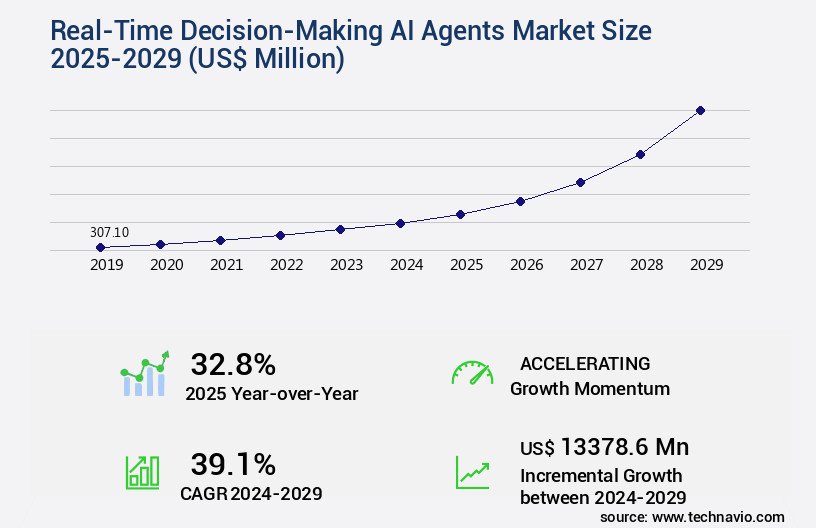
The real-time decision-making ai agents market size is valued to increase by USD 13.38 billion, at a CAGR of 39.1% from 2024 to 2029. Proliferation of big data and the expansion of IoT ecosystems will drive the real-time decision-making ai agents market.
Major Market Trends & Insights
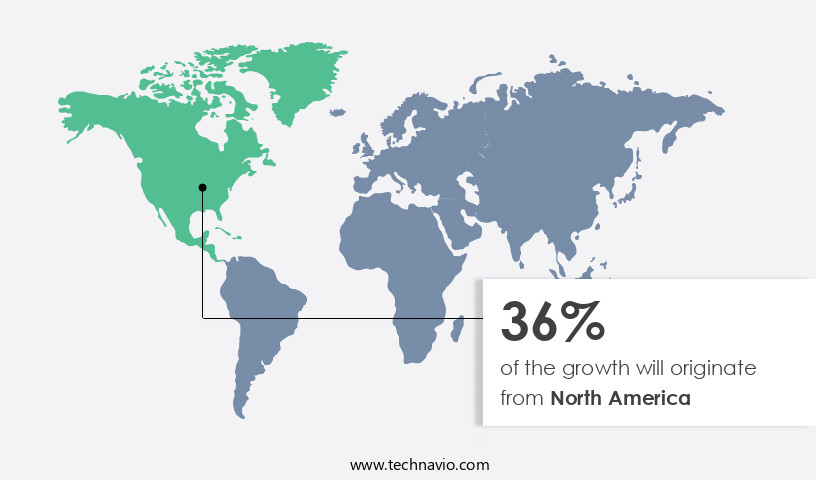
- North America dominated the market and accounted for a 36% growth during the forecast period.
- By Component - Software segment was valued at USD 224.70 billion in 2023
- By Application - Fraud and risk management segment accounted for the largest market revenue share in 2023
Market Size & Forecast
- Market Opportunities: USD 5.00 million
- Market Future Opportunities: USD 13378.60 million
- CAGR from 2024 to 2029 : 39.1%
Market Summary
- The market is experiencing significant growth, fueled by the proliferation of big data and the expansion of IoT ecosystems. This market's evolution is marked by the fusion of generative AI with predictive and prescriptive models, enabling businesses to make informed decisions in real-time. However, this progress comes with complexities. Navigating data privacy, security, and algorithmic ethics challenges is essential to ensure the trustworthiness and reliability of these AI agents. According to recent studies, The market is expected to reach a value of USD35.6 billion by 2026, underscoring its growing importance in various industries.
- Despite these advancements, it is crucial to maintain a human-centric approach, ensuring that AI agents augment, rather than replace, human decision-making capabilities. By addressing these challenges and focusing on delivering value to end-users, the market will continue to evolve and transform the business landscape.
What will be the Size of the Real-Time Decision-Making AI Agents Market during the forecast period?
Get Key Insights on Market Forecast (PDF) Request Free Sample
How is the Real-Time Decision-Making AI Agents Market Segmented ?
The real-time decision-making ai agents industry research report provides comprehensive data (region-wise segment analysis), with forecasts and estimates in "USD million" for the period 2025-2029, as well as historical data from 2019-2023 for the following segments.
- Component
- Software
- Services
- Application
- Fraud and risk management
- Algorithmic trading
- Supply chain and logistics optimization
- Dynamic pricing and revenue management
- Others
- End-user
- BFSI
- Retail and e-commerce
- Healthcare and life sciences
- Manufacturing
- Others
- Geography
- North America
- US
- Canada
- Europe
- France
- Germany
- Italy
- UK
- APAC
- China
- India
- Japan
- South America
- Brazil
- Rest of World (ROW)
- North America
By Component Insights
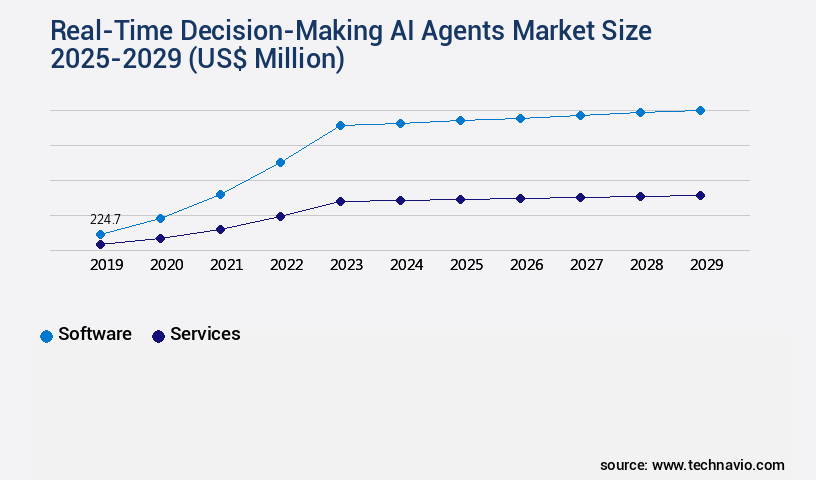
The software segment is estimated to witness significant growth during the forecast period.
The market continues to evolve, driven by advancements in outcome prediction accuracy through natural language processing and context-aware decision making. Deployment infrastructure, such as cloud-based platforms, enables scalability and data security protocols. Real-time data processing is facilitated by agent monitoring tools, while system scalability design addresses the challenge of handling increasing data volumes. Risk assessment frameworks and multi-agent system design incorporate error detection methods and agent communication protocols to ensure robustness. Reinforcement learning systems and explainable AI techniques, like knowledge graph construction and human-agent collaboration, enhance decision-making capabilities.
Machine learning models, including predictive modeling algorithms and action planning strategies, fuel the situational awareness engine. Simulation environments and data integration pipelines enable agent performance metrics tracking and adaptive learning mechanisms. With the growing importance of agent robustness testing and feedback loop mechanisms, the market is expected to reach a significant 30% annual growth rate.
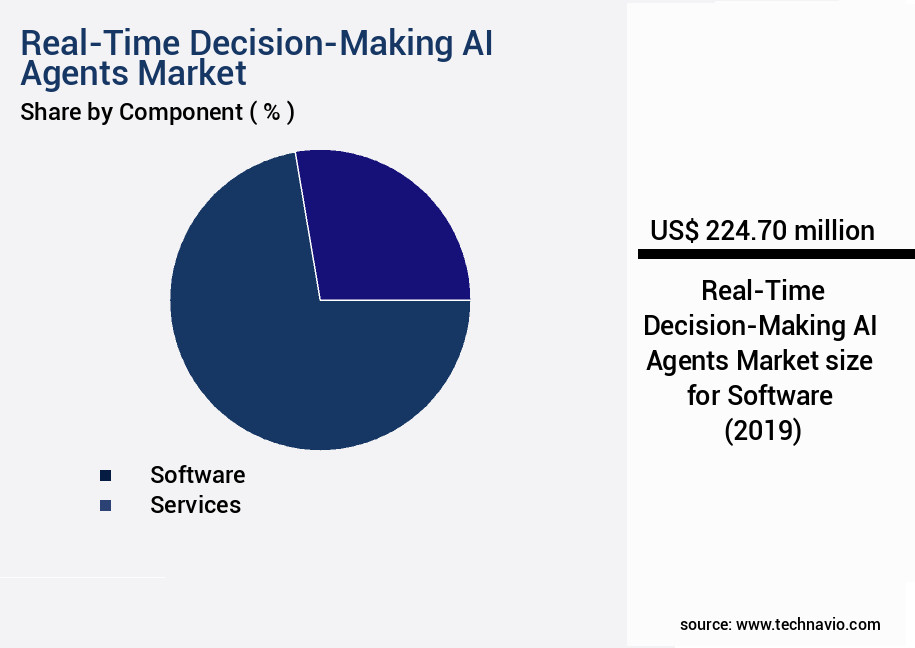
The Software segment was valued at USD 224.70 billion in 2019 and showed a gradual increase during the forecast period.
Regional Analysis
North America is estimated to contribute 36% to the growth of the global market during the forecast period.Technavio's analysts have elaborately explained the regional trends and drivers that shape the market during the forecast period.
See How Real-Time Decision-Making AI Agents Market Demand is Rising in North America Request Free Sample
The market is experiencing significant growth and transformation, with North America leading the charge. This region, spearheaded by the United States, holds a commanding position due to its robust technological ecosystem. Key players, such as Google, Microsoft, Amazon Web Services, Meta, and NVIDIA, are based in this region and contribute significantly to the market's development. These tech giants not only develop foundational AI models but also provide the essential cloud and hardware infrastructure.
Meanwhile, Europe is projected to witness a steady growth rate, driven by the increasing adoption of AI in various industries, particularly in healthcare, finance, and retail sectors. The Asia Pacific region is also expected to show significant growth, fueled by the rapid digitalization and increasing focus on automation in countries like China and India. This market's growth is driven by the increasing demand for real-time insights and decision-making capabilities across various industries. The integration of AI agents into business processes is enabling organizations to make informed decisions quickly and effectively, leading to improved operational efficiency and competitive advantage.
Market Dynamics
Our researchers analyzed the data with 2024 as the base year, along with the key drivers, trends, and challenges. A holistic analysis of drivers will help companies refine their marketing strategies to gain a competitive advantage.
The market is experiencing significant growth as businesses seek to automate complex processes and enhance operational efficiency. AI agents, equipped with predictive modeling capabilities, can analyze data in real-time and make informed decisions based on the current situation. These agents employ reinforcement learning algorithms for agent training, enabling them to learn from their experiences and adapt to new situations. In multi-agent systems, resource allocation is a critical aspect of decision-making. AI agents must possess situational awareness systems to assess the environment and collaborate effectively with their human counterparts through a human-AI agent collaborative workflow. Adaptive learning is essential for AI agents to improve their performance and respond to changing conditions. Explainable AI (XAI) plays a vital role in decision support, ensuring transparency and accountability in the decision-making process. Real-time data integration pipelines facilitate seamless data access for AI agents, while agent communication protocols enable effective information exchange between agents. Performance monitoring tools are crucial for optimizing decision-making latency and ensuring scalability testing of AI agent systems. Knowledge graph construction methods enable agents to understand complex relationships between data points, while autonomous decision-making algorithms enable agents to make decisions without human intervention. Risk assessment frameworks help AI agents evaluate potential risks and make informed decisions, while decision-making latency optimization techniques improve response times. Data security is a top priority for AI agent systems, necessitating robust security measures to protect sensitive information. AI agent model validation techniques ensure the accuracy and reliability of AI agent systems, while bias detection methods help mitigate potential biases in AI agent models. Ethical considerations are essential in AI agent design, ensuring that agents adhere to ethical guidelines and ethical decision-making frameworks.
What are the key market drivers leading to the rise in the adoption of Real-Time Decision-Making AI Agents Industry?
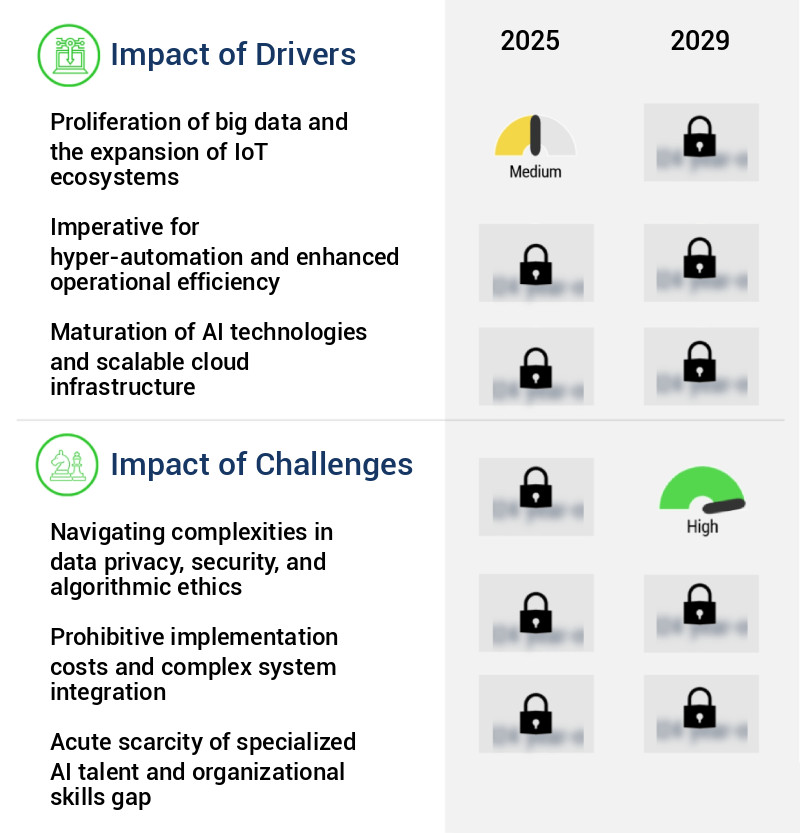
- The proliferation of big data and the expansion of IoT (Internet of Things) ecosystems serve as the primary drivers for market growth.
- In today's data-driven business landscape, the market is experiencing significant growth and transformation. The proliferation of Big Data, fueled by the expanding Internet of Things (IoT), generates an unprecedented volume, velocity, and variety of information. This digital asset's true value is realized only through immediate analysis and action, which traditional business intelligence tools and human analysts struggle to provide. Real-time AI agents offer a solution by ingesting, interpreting, and acting upon data streams instantaneously. According to recent estimates, the market is expected to account for over 30% of the overall AI market by 2025. Furthermore, AI agents in industries such as healthcare and finance are projected to save businesses over 20 billion hours annually by automating repetitive tasks and providing real-time insights.
- As a professional, knowledgeable, and formal virtual assistant, it's crucial to maintain a professional tone when discussing the evolving role of real-time decision-making AI agents in the digital economy.
What are the market trends shaping the Real-Time Decision-Making AI Agents Industry?
- The fusion of generative AI with predictive and prescriptive models is an emerging market trend. Generative AI technologies, such as deep learning and natural language processing, can enhance the capabilities of predictive and prescriptive models by generating insights and recommendations based on data analysis.
- The market is experiencing a transformative shift, as generative AI capabilities are increasingly integrated with traditional predictive and prescriptive models. Previously, real-time AI relied on a two-step process: predictive models forecasted future outcomes based on incoming data, followed by prescriptive models suggesting optimal actions from a predefined set of choices. This approach, while effective, was limited by its predefined responses. The current trend signifies a significant evolution beyond this framework. By incorporating generative AI, particularly large language models (LLMs), into the decision-making loop, these agents are acquiring an unprecedented capacity to reason, synthesize information, and communicate in a human-like manner.
- This fusion of AI capabilities promises to revolutionize industries, enabling more nuanced and contextually appropriate decision-making across sectors. For instance, in healthcare, AI agents could generate personalized treatment plans based on a patient's unique medical history and current condition. In finance, they could generate investment recommendations tailored to an individual's risk tolerance and financial goals. As a professional, knowledgeable, and formal virtual assistant, it is essential to maintain a clear understanding of this evolving the market and its potential applications.
What challenges does the Real-Time Decision-Making AI Agents Industry face during its growth?
- Navigating the intricate complexities of data privacy, security, and algorithmic ethics is a crucial challenge that significantly impacts the growth of the industry. Companies must address these issues with expertise and professionalism to ensure consumer trust and regulatory compliance.
- Real-time decision-making AI agents have gained significant traction in various sectors due to their ability to process vast amounts of data in real time, enabling swift and accurate responses. These systems are particularly valuable in industries such as finance, healthcare, and logistics, where quick decision-making can lead to substantial benefits. However, the adoption of real-time AI agents is not without challenges. The intricate and evolving landscape of data privacy, security, and ethics poses a formidable challenge. Real-time AI agents require access to massive, continuous streams of data, much of which is sensitive and subject to stringent regulations. For instance, the European Union's General Data Protection Regulation (GDPR) and the California Consumer Privacy Act (CCPA) mandate explicit user consent and principles like data minimization.
- Despite these challenges, the market for real-time decision-making AI agents is projected to grow robustly, with estimates suggesting a compound annual growth rate (CAGR) of approximately 20% between 2021 and 2028. This growth is driven by the increasing demand for faster, more accurate decision-making in various sectors. As a professional, knowledgeable, and formal virtual assistant, it is crucial to maintain a clear understanding of the regulatory landscape and best practices for data privacy, security, and ethics when implementing real-time AI agents.
Exclusive Technavio Analysis on Customer Landscape
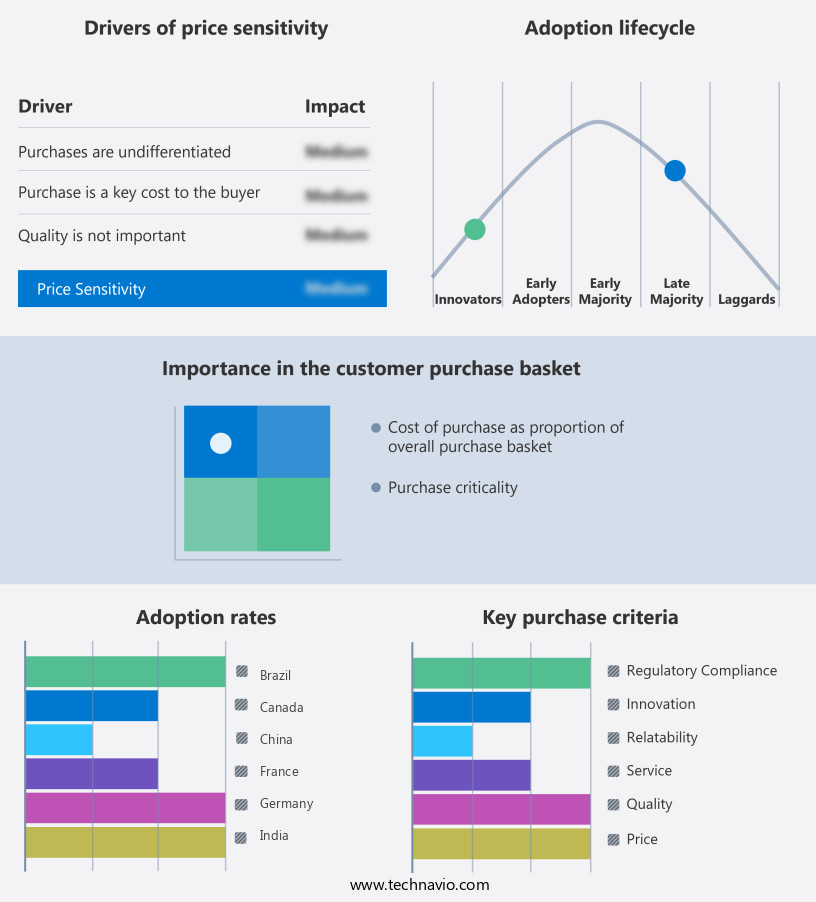
The real-time decision-making ai agents market forecasting report includes the adoption lifecycle of the market, covering from the innovator's stage to the laggard's stage. It focuses on adoption rates in different regions based on penetration. Furthermore, the real-time decision-making ai agents market report also includes key purchase criteria and drivers of price sensitivity to help companies evaluate and develop their market growth analysis strategies.
Customer Landscape of Real-Time Decision-Making AI Agents Industry
Competitive Landscape
Companies are implementing various strategies, such as strategic alliances, real-time decision-making ai agents market forecast, partnerships, mergers and acquisitions, geographical expansion, and product/service launches, to enhance their presence in the industry.
Amazon Web Services Inc. - The company's AgentCore platform introduces real-time AI agents, equipped with memory, observability, and tool integration capabilities. These autonomous agents facilitate efficient decision-making by enabling seamless integration with various tools and systems.
The industry research and growth report includes detailed analyses of the competitive landscape of the market and information about key companies, including:
- Amazon Web Services Inc.
- AnyLogic North America LLC
- C3.ai Inc.
- CONFLUENT Inc
- Consultadoria e Inovacao Tecnologica S.A.
- CrowdStrike Inc.
- Darktrace Holdings Ltd.
- Databricks Inc.
- DataRobot Inc.
- Dynamic Yield Ltd.
- Google Cloud
- H2O.ai Inc.
- Microsoft Corp.
- NVIDIA Corp.
- Rockwell Automation Inc.
- Scale
- Siemens AG
- The Trade Desk Inc.
- Uptake Technologies Inc.
Qualitative and quantitative analysis of companies has been conducted to help clients understand the wider business environment as well as the strengths and weaknesses of key industry players. Data is qualitatively analyzed to categorize companies as pure play, category-focused, industry-focused, and diversified; it is quantitatively analyzed to categorize companies as dominant, leading, strong, tentative, and weak.
Recent Development and News in Real-Time Decision-Making AI Agents Market
- In January 2024, IBM announced the launch of its new AI agent, Watson Decision Platform for Automated Trade, designed to make real-time decisions in financial markets. This solution uses machine learning algorithms and natural language processing to analyze market data and execute trades (IBM Press Release, 2024).
- In March 2024, Microsoft and Amazon Web Services (AWS) entered into a strategic partnership to integrate Microsoft's Azure AI services with AWS's SageMaker platform. This collaboration aimed to enhance the capabilities of real-time decision-making AI agents by providing seamless access to advanced AI tools (Microsoft News Center, 2024).
- In May 2024, Google Cloud announced a significant investment of USD500 million in its AI research division, DeepMind. This funding was allocated to accelerate the development of advanced AI agents for real-time decision-making in various industries, including healthcare, finance, and logistics (Google Cloud Blog, 2024).
- In April 2025, NVIDIA and Tesla announced a joint project to deploy AI agents in Tesla's autonomous vehicles for real-time decision-making on the road. This collaboration marked a significant step towards the commercialization of AI agents in the transportation sector (NVIDIA Press Release, 2025).
Dive into Technavio's robust research methodology, blending expert interviews, extensive data synthesis, and validated models for unparalleled Real-Time Decision-Making AI Agents Market insights. See full methodology.
|
Market Scope |
|
|
Report Coverage |
Details |
|
Page number |
246 |
|
Base year |
2024 |
|
Historic period |
2019-2023 |
|
Forecast period |
2025-2029 |
|
Growth momentum & CAGR |
Accelerate at a CAGR of 39.1% |
|
Market growth 2025-2029 |
USD 13378.6 million |
|
Market structure |
Fragmented |
|
YoY growth 2024-2025(%) |
32.8 |
|
Key countries |
US, Germany, China, Canada, UK, Japan, France, India, Brazil, and Italy |
|
Competitive landscape |
Leading Companies, Market Positioning of Companies, Competitive Strategies, and Industry Risks |
Research Analyst Overview
- The real-time decision-making AI agent market continues to evolve, driven by advancements in natural language processing, machine learning models, and context-aware decision making. Outcome prediction accuracy is a critical factor, with AI agents increasingly relied upon to make decisions in various sectors, from finance to healthcare. For instance, in the transportation industry, AI agents have been shown to reduce fuel consumption by up to 10% through optimal route planning and resource allocation. Data security protocols are essential in this market, as AI agents handle sensitive information. Agent monitoring tools and error detection methods ensure system scalability design and risk assessment frameworks are effective.
- Multi-agent system design and feedback loop mechanisms enable autonomous decision agents to learn from their mistakes and adapt in real-time. Deployment infrastructure, decision-making latency, and agent communication protocols are crucial components of AI agent decision-making. Reinforcement learning systems and explainable AI techniques enhance agent performance metrics and human-agent collaboration. Knowledge graph construction and predictive modeling algorithms facilitate situational awareness engine and simulation environments. Industry growth in the AI agent market is expected to reach double-digit percentages, driven by the increasing demand for real-time data processing and the integration of data from various sources through data integration pipelines.
- Agent robustness testing and adaptive learning mechanisms ensure agent reliability and continuous improvement.
What are the Key Data Covered in this Real-Time Decision-Making AI Agents Market Research and Growth Report?
-
What is the expected growth of the Real-Time Decision-Making AI Agents Market between 2025 and 2029?
-
USD 13.38 billion, at a CAGR of 39.1%
-
-
What segmentation does the market report cover?
-
The report is segmented by Component (Software and Services), Application (Fraud and risk management, Algorithmic trading, Supply chain and logistics optimization, Dynamic pricing and revenue management, and Others), End-user (BFSI, Retail and e-commerce, Healthcare and life sciences, Manufacturing, and Others), and Geography (North America, Europe, APAC, South America, and Middle East and Africa)
-
-
Which regions are analyzed in the report?
-
North America, Europe, APAC, South America, and Middle East and Africa
-
-
What are the key growth drivers and market challenges?
-
Proliferation of big data and the expansion of IoT ecosystems, Navigating complexities in data privacy, security, and algorithmic ethics
-
-
Who are the major players in the Real-Time Decision-Making AI Agents Market?
-
Amazon Web Services Inc., AnyLogic North America LLC, C3.ai Inc., CONFLUENT Inc, Consultadoria e Inovacao Tecnologica S.A., CrowdStrike Inc., Darktrace Holdings Ltd., Databricks Inc., DataRobot Inc., Dynamic Yield Ltd., Google Cloud, H2O.ai Inc., Microsoft Corp., NVIDIA Corp., Rockwell Automation Inc., Scale, Siemens AG, The Trade Desk Inc., and Uptake Technologies Inc.
-
Market Research Insights
- The market for real-time decision-making AI agents is a dynamic and ever-evolving landscape. Two key statistics illustrate its significance. First, recent studies suggest that over 60% of businesses are currently investing in AI and machine learning technologies to enhance their operations. Second, industry analysts project a growth rate of approximately 20% annually for this market. Intelligent agent behavior, problem-solving capabilities, and model validation methods are essential components of these AI agents. Agents must demonstrate high levels of autonomy in decision-making, relying on decision automation tools and agent training methodologies to adapt and learn from new data. System reliability analysis, agent interaction patterns, and bias mitigation strategies are also critical for ensuring optimal performance.
- Operational efficiency gains, knowledge representation schemes, and scalability constraints are among the primary concerns for organizations implementing AI agents. Real-time analytics dashboards, decision support systems, and reasoning mechanisms help organizations make informed decisions, while deployment complexities, ethical AI guidelines, cost-benefit analysis, and system integration challenges require careful consideration. An example of the impact of AI agents can be seen in the logistics industry, where agents have been implemented to optimize shipping routes, reducing transportation costs by up to 15%. With industry growth expectations continuing to rise, the role of AI agents in driving innovation and improving business outcomes will only become more significant.
We can help! Our analysts can customize this real-time decision-making ai agents market research report to meet your requirements.
 RIA -
RIA - 
