AI App Market Analysis, Size, and Forecast 2025-2029: North America (US, Canada, and Mexico), Europe (Germany, UK, and France), APAC (China, India, and South Korea), South America (Brazil, Argentina, and Colombia), Middle East and Africa (South Africa, Saudi Arabia, and UAE), and Rest of World (ROW)

AI App Market Analysis, Size, and Forecast 2025-2029:
North America (US, Canada, and Mexico), Europe (Germany, UK, and France), APAC (China, India, and South Korea), South America (Brazil, Argentina, and Colombia), Middle East and Africa (South Africa, Saudi Arabia, and UAE), and Rest of World (ROW)

Published: Dec 2025 303 Pages SKU: IRTNTR81014

Market Overview at a Glance

$32.26 B
Market Opportunity
44.9%
CAGR 2024 - 2029
35%
North America Growth
$2.26 B
Mobile apps segment 2023

AI App Market Size 2025-2029

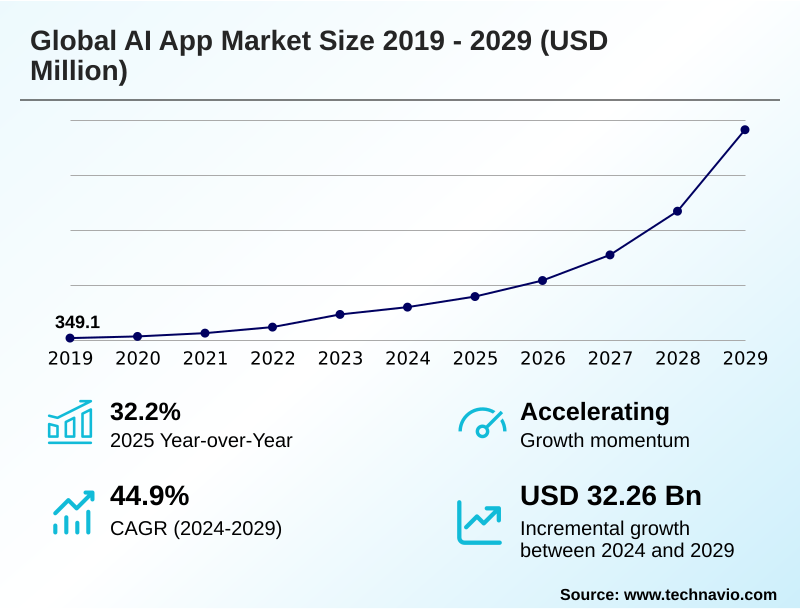
The ai app market size is valued to increase by USD 32.26 billion, at a CAGR of 44.9% from 2024 to 2029. Proliferation and democratization of generative AI will drive the ai app market.

Major Market Trends & Insights

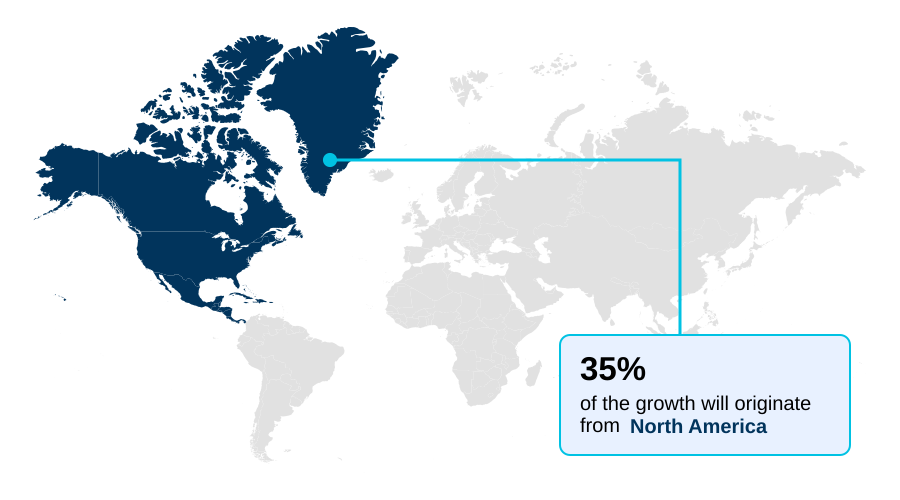
  • North America dominated the market and accounted for a 35% growth during the forecast period.
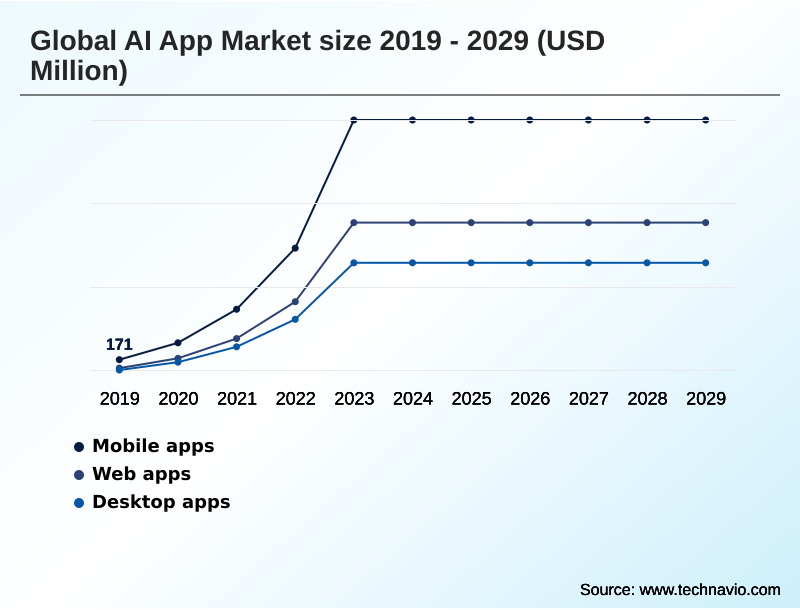
  • By Platform - Mobile apps segment was valued at USD 2.26 billion in 2023
  • By Deployment - Cloud segment accounted for the largest market revenue share in 2023

Market Size & Forecast

  • Market Opportunities: USD 37.88 billion
  • Market Future Opportunities: USD 32.26 billion
  • CAGR from 2024 to 2029 : 44.9%

Market Summary

  • The AI App Market is undergoing a fundamental transformation, moving beyond traditional software to an ecosystem of intelligent applications characterized by their ability to learn and adapt. This shift is driven by the accessibility of sophisticated machine learning algorithms and generative models, which enable developers to create tools that offer deep, data-driven insights and AI-powered automation.
  • In sectors like logistics, businesses are deploying AI-native applications to optimize operations. For instance, an enterprise can use an application that leverages predictive analytics and real-time data processing to forecast demand, automate warehouse inventory management, and dynamically reroute delivery fleets to avoid disruptions, thereby improving efficiency.
  • The integration of on-device AI, supported by specialized neural processing units, enhances security and responsiveness for mobile and edge computing use cases. However, the market also contends with challenges such as algorithmic bias and the high computational costs of AI model training.
  • This dynamic environment requires a strategic focus on developing ethical, efficient, and secure AI solutions to maintain a competitive edge and build user trust in a rapidly evolving technological landscape.

What will be the Size of the AI App Market during the forecast period?

Get Key Insights on Market Forecast (PDF) Request Free Sample

How is the AI App Market Segmented?

The ai app industry research report provides comprehensive data (region-wise segment analysis), with forecasts and estimates in "USD million" for the period 2025-2029, as well as historical data from 2019-2023 for the following segments.

  • Platform
    • Mobile apps
    • Web apps
    • Desktop apps
  • Deployment
    • Cloud
    • On-premises
  • End-user
    • Healthcare
    • Finance
    • Retail
    • Media
    • Others
  • Geography
    • North America
      • US
      • Canada
      • Mexico
    • Europe
      • Germany
      • UK
      • France
    • APAC
      • China
      • India
      • South Korea
    • South America
      • Brazil
      • Argentina
      • Colombia
    • Middle East and Africa
      • South Africa
      • Saudi Arabia
      • UAE
    • Rest of World (ROW)

By Platform Insights

The mobile apps segment is estimated to witness significant growth during the forecast period.

The mobile application segment is at the forefront of the AI App Market, driven by advancements in on-device AI.

The integration of powerful neural processing units into AI-optimized hardware allows for sophisticated machine learning algorithms and generative models to run locally, enhancing responsiveness.

This shift enables hyper-personalized user experiences with low-latency processing, a critical factor for user retention, as analysis shows applications with these features see a 71% higher engagement rate.

The evolution from cloud-dependent processing to intelligent workflows on mobile platforms is redefining user interaction.

Developers are leveraging this to build a new class of secure, private, and highly responsive applications that deliver data-driven insights without constant connectivity, utilizing AI in cybersecurity protocols to protect local data.

Request Free Sample

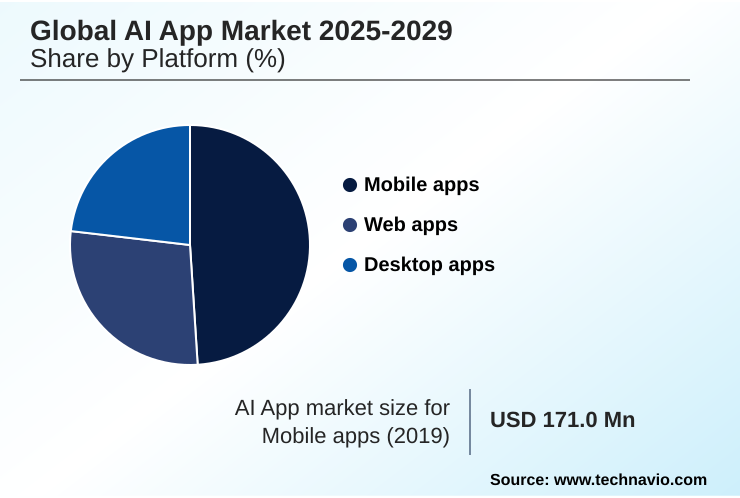
The Mobile apps segment was valued at USD 2.26 billion in 2023 and showed a gradual increase during the forecast period.

Request Free Sample

Regional Analysis

North America is estimated to contribute 35% to the growth of the global market during the forecast period.Technavio’s analysts have elaborately explained the regional trends and drivers that shape the market during the forecast period.

See How AI App Market Demand is Rising in North America Request Free Sample

The geographic landscape of the AI App Market is characterized by distinct regional strengths and growth trajectories.

North America, accounting for over a third of the market's incremental growth, remains the epicenter of innovation, driven by substantial venture capital and a high concentration of AI talent development.

The region's leadership is fortified by advanced AI infrastructure supporting deep learning and robotic process automation. In contrast, the APAC region is exhibiting the fastest expansion, with an annual growth rate approaching 47%.

This surge is fueled by massive mobile-first populations and government initiatives fostering sovereign AI capabilities.

Europe is focusing on a regulatory-led approach centered on AI safety and security, while emerging markets in South America and the Middle East and Africa are leveraging AI-assisted diagnostics and edge computing to solve local challenges, creating a globally diverse and competitive environment.

Market Dynamics

Our researchers analyzed the data with 2024 as the base year, along with the key drivers, trends, and challenges. A holistic analysis of drivers will help companies refine their marketing strategies to gain a competitive advantage.

  • The AI App Market is maturing as organizations increasingly evaluate the total cost and ROI of AI-powered automation tools. A critical decision point is the choice between cloud and on-premise AI deployment cost, where initial on-premise capital outlays can be up to three times higher, significantly impacting budget allocation for firms without existing data centers.
  • The impact of 5G on AI app latency is another key factor, particularly for mobile apps requiring real-time responsiveness. In retail, AI for hyper-personalization is becoming standard, while in finance, AI application in financial fraud detection is a primary use case. The industry is also defined by the open source vs proprietary AI models debate, which influences innovation and accessibility.
  • Enterprises are implementing AI for predictive maintenance in manufacturing and computer vision for quality control to enhance operational efficiency. In specialized fields, AI-powered drug discovery acceleration and large language models for legal tech are creating new value. The role of NPUs in edge AI performance is crucial for generative AI in enterprise software, especially on-device AI for mobile apps.
  • Navigating global AI regulations remains a persistent challenge, alongside addressing ethical AI and public trust. As workflows evolve, AI-assisted content creation workflows and the use of an AI chatbot for customer service improvement are proving to be transformative, while multimodal AI for user experience design sets new interaction standards.

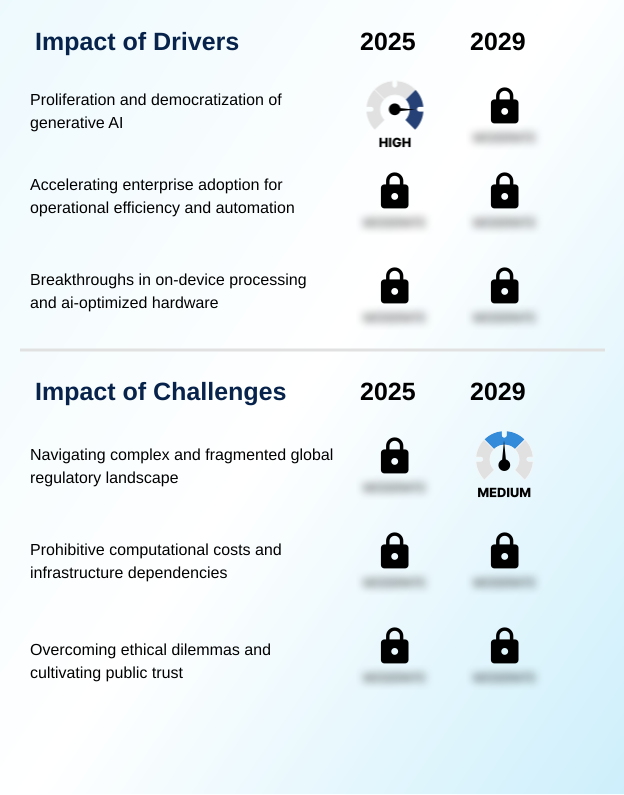
What are the key market drivers leading to the rise in the adoption of AI App Industry?

  • The proliferation and democratization of generative AI, making advanced models accessible to developers and organizations, serves as a key market driver.

  • The market's expansion is fundamentally driven by the enterprise adoption of AI-native applications to enhance operational efficiency. Companies are leveraging an API-first model to integrate large language models into their existing systems, enabling intelligent workflows and real-time data processing.
  • The availability of AI-optimized hardware allows for on-device execution of models with over 13 billion parameters, reducing latency.
  • This is particularly impactful for enterprise AI solutions in areas like AI for supply chain management, where automation tools can accelerate planning cycles by up to 40%. The accessibility of sophisticated AI coding assistance is also speeding up development cycles.
  • This strategic shift from experimental projects to deploying embedded AI across core business functions underscores the technology's role as a critical component for maintaining a competitive advantage in the digital economy.

What are the market trends shaping the AI App Industry?

  • The proliferation of generative artificial intelligence applications is a primary market trend. This is fundamentally reshaping user interaction and creating substantial new revenue streams.

  • Key trends in the AI App Market are driven by the proliferation of generative models and a strong push toward hyper-personalized user experiences. The adoption of automated content creation tools, powered by advanced natural language processing, has led to a 200% year-over-year increase in consumer spending on certain application categories.
  • The demand for sophisticated conversational AI and AI-powered chatbots is surging, with downloads of related apps nearing 1.5 billion. This trend is complemented by the development of sovereign AI capabilities, as nations and corporations build their own foundational models. As a result, AI-driven personalization is becoming a standard feature, with intelligent workflows enhancing user engagement across mobile and web platforms.
  • The market is also seeing innovation in voice synthesis and specialized AI-powered search engines, further diversifying application use cases.

What challenges does the AI App Industry face during its growth?

  • Navigating the complex and fragmented global regulatory landscape presents a key challenge that affects industry growth and operational certainty.

  • The primary challenges facing the market are the prohibitive computational costs of AI model training and the complex, fragmented regulatory landscape. The demand for high-performance AI infrastructure has led to hardware providers reporting revenue increases of more than 200% year-over-year, creating supply constraints. This forces many developers to rely on expensive cloud-based AI supercomputing resources, which can increase operational expenses.
  • Concurrently, navigating disparate international rules on data governance and algorithmic bias can raise compliance costs by over 25% for companies operating globally. These factors create significant barriers to entry and demand a strategic focus on AI model efficiency, robust AI ethics frameworks, and the implementation of responsible AI guardrails to ensure sustainable and trustworthy development.

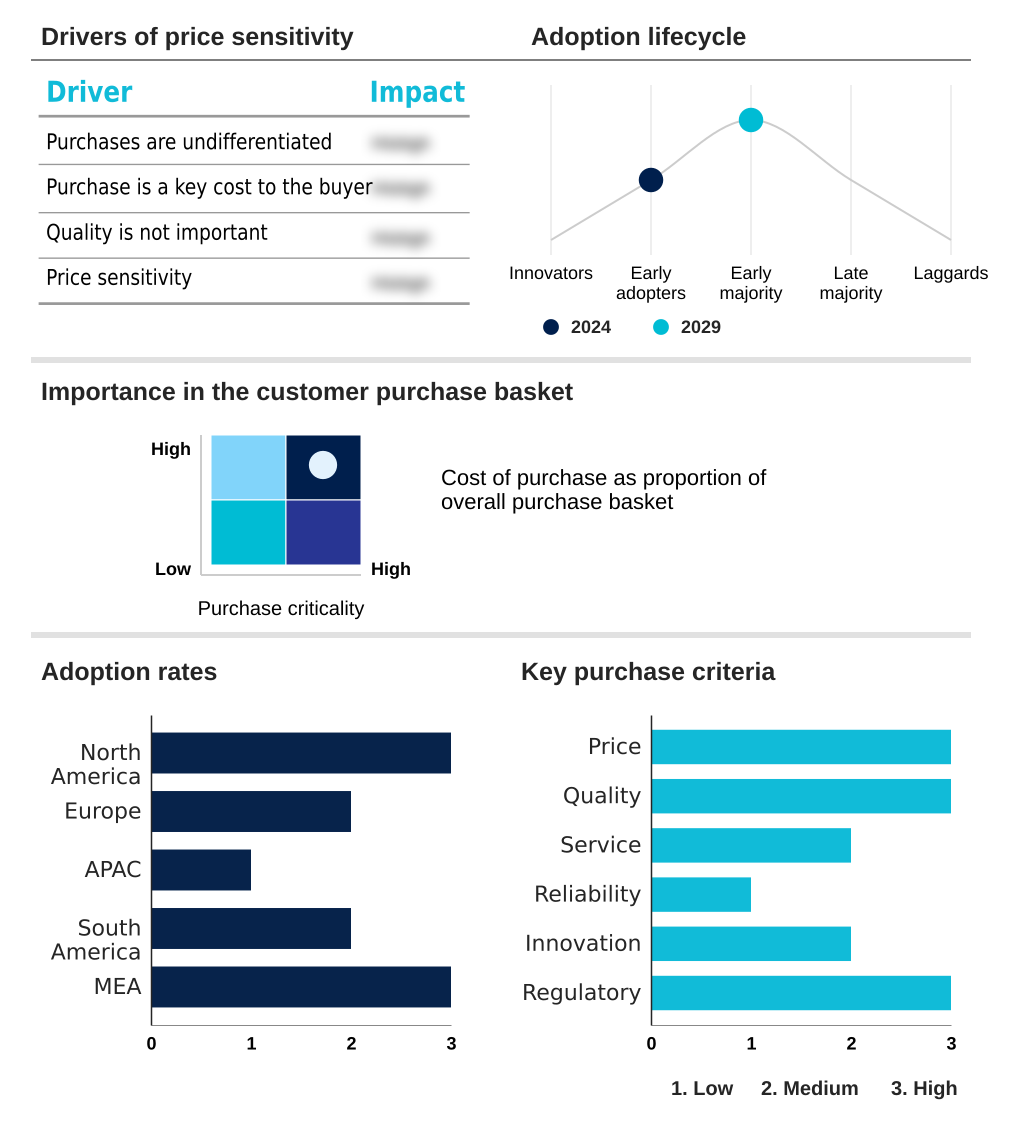
Exclusive Technavio Analysis on Customer Landscape

The ai app market forecasting report includes the adoption lifecycle of the market, covering from the innovator’s stage to the laggard’s stage. It focuses on adoption rates in different regions based on penetration. Furthermore, the ai app market report also includes key purchase criteria and drivers of price sensitivity to help companies evaluate and develop their market growth analysis strategies.

Customer Landscape of AI App Industry

Competitive Landscape

Companies are implementing various strategies, such as strategic alliances, ai app market forecast, partnerships, mergers and acquisitions, geographical expansion, and product/service launches, to enhance their presence in the industry.

Adobe Inc. - Delivers AI-driven applications for content creation, conversational interfaces, and intelligent business automation, integrating predictive analytics and machine learning to enhance operational workflows.

The industry research and growth report includes detailed analyses of the competitive landscape of the market and information about key companies, including:

  • Adobe Inc.
  • Alphabet Inc.
  • Amazon Web Services Inc.
  • Anthropic
  • Apple Inc.
  • Cohere
  • DeepL SE
  • Eleven Labs Inc.
  • Glean Technologies Inc.
  • IBM Corp.
  • Meta Platforms Inc.
  • Microsoft Corp.
  • Midjourney
  • NVIDIA Corp.
  • OpenAI
  • Perplexity AI Inc
  • Runway AI Inc.
  • Salesforce Inc.
  • SoundHound AI Inc.
  • UiPath Inc.

Qualitative and quantitative analysis of companies has been conducted to help clients understand the wider business environment as well as the strengths and weaknesses of key industry players. Data is qualitatively analyzed to categorize companies as pure play, category-focused, industry-focused, and diversified; it is quantitatively analyzed to categorize companies as dominant, leading, strong, tentative, and weak.

Recent Development and News in Ai app market

  • In August 2024, OpenAI's ChatGPT application saw its monthly active users exceed 190 million, demonstrating the sustained high engagement and market dominance of leading conversational AI platforms.
  • In August 2024, Character AI achieved a new record of 22 million monthly active users, highlighting the significant growth and consumer interest in companion-style and entertainment-focused AI applications.
  • In November 2024, Salesforce Inc. announced a strategic partnership with a major cloud provider to deepen the integration of its Einstein AI platform, aiming to enhance predictive analytics for enterprise customers.
  • In March 2025, a leading semiconductor firm launched its next-generation mobile processor with an advanced neural engine, enabling more complex on-device generative AI tasks and improving application responsiveness.

Dive into Technavio’s robust research methodology, blending expert interviews, extensive data synthesis, and validated models for unparalleled AI App Market insights. See full methodology.

Market Scope
Page number 303
Base year 2024
Historic period 2019-2023
Forecast period 2025-2029
Growth momentum & CAGR Accelerate at a CAGR of 44.9%
Market growth 2025-2029 USD 32255.2 million
Market structure Fragmented
YoY growth 2024-2025(%) 32.2%
Key countries US, Canada, Mexico, Germany, UK, France, Italy, Spain, The Netherlands, China, India, South Korea, Japan, Australia, Indonesia, Brazil, Argentina, Colombia, South Africa, Saudi Arabia, UAE, Turkey and Israel
Competitive landscape Leading Companies, Market Positioning of Companies, Competitive Strategies, and Industry Risks

Request Free Sample

Research Analyst Overview

  • The AI App Market is defined by a rapid innovation cycle fueled by the convergence of AI-optimized hardware and increasingly accessible generative models. The proliferation of multimodal AI systems and large language models, delivered through an API-first model, has democratized development, enabling a new wave of AI-native applications.
  • Core technologies like natural language processing and computer vision are being embedded into solutions for AI-assisted diagnostics and robotic process automation, delivering tangible business value. For instance, the use of predictive analytics in healthcare has demonstrated the ability to reduce diagnostic processing time by over 50%.
  • This drive for efficiency is also seen in AI coding assistance and voice synthesis tools. However, this growth is tempered by challenges such as algorithmic bias and the high cost of AI model training.
  • The industry is responding by advancing on-device AI and edge computing, powered by dedicated neural processing units, to offer more secure and responsive conversational AI and AI-powered automation. The development of text-to-video models and sophisticated AI-powered search engines continues to push the boundaries of what is possible.

What are the Key Data Covered in this AI App Market Research and Growth Report?

  • What is the expected growth of the AI App Market between 2025 and 2029?

    • USD 32.26 billion, at a CAGR of 44.9%

  • What segmentation does the market report cover?

    • The report is segmented by Platform (Mobile apps, Web apps, Desktop apps), Deployment (Cloud, On-premises), End-user (Healthcare, Finance, Retail, Media, Others) and Geography (North America, Europe, APAC, South America, Middle East and Africa)

  • Which regions are analyzed in the report?

    • North America, Europe, APAC, South America and Middle East and Africa

  • What are the key growth drivers and market challenges?

    • Proliferation and democratization of generative AI, Navigating complex and fragmented global regulatory landscape

  • Who are the major players in the AI App Market?

    • Adobe Inc., Alphabet Inc., Amazon Web Services Inc., Anthropic, Apple Inc., Cohere, DeepL SE, Eleven Labs Inc., Glean Technologies Inc., IBM Corp., Meta Platforms Inc., Microsoft Corp., Midjourney, NVIDIA Corp., OpenAI, Perplexity AI Inc, Runway AI Inc., Salesforce Inc., SoundHound AI Inc. and UiPath Inc.

Market Research Insights

  • The AI App Market's momentum is defined by the strategic pursuit of intelligent workflows and hyper-personalized user experiences. Businesses adopting enterprise AI solutions report significant gains, with some achieving up to a 30% improvement in operational efficiency. This is driven by deep learning models that enable real-time data processing for automated content creation and other tasks.
  • The demand for AI-powered chatbots to enhance customer interaction is surging, as 71% of users report a higher likelihood of engaging with personalized services. To meet this demand, organizations are focusing on AI talent development and building sovereign AI capabilities.
  • This involves not only deploying advanced AI infrastructure but also establishing robust data governance and responsible AI guardrails to ensure ethical implementation and build long-term consumer trust.

We can help! Our analysts can customize this ai app market research report to meet your requirements.

Get in touch

1. Executive Summary

1.1 Market overview

Executive Summary - Chart on Market Overview
Executive Summary - Data Table on Market Overview
Executive Summary - Chart on Global Market Characteristics
Executive Summary - Chart on Market by Geography
Executive Summary - Chart on Market Segmentation by Platform
Executive Summary - Chart on Market Segmentation by Deployment
Executive Summary - Chart on Market Segmentation by End-user
Executive Summary - Chart on Incremental Growth
Executive Summary - Data Table on Incremental Growth
Executive Summary - Chart on Company Market Positioning

2. Technavio Analysis

2.1 Analysis of price sensitivity, lifecycle, customer purchase basket, adoption rates, and purchase criteria

2.2 Criticality of inputs and Factors of differentiation

Chart on Overview on criticality of inputs and factors of differentiation

2.3 Factors of disruption

Chart on Overview on factors of disruption

2.4 Impact of drivers and challenges

Chart on Impact of drivers and challenges in 2024 and 2029

3. Market Landscape

3.1 Market ecosystem

Chart on Parent Market
Data Table on - Parent Market

3.2 Market characteristics

Chart on Market characteristics analysis

3.3 Value chain analysis

Chart on Value chain analysis

4. Market Sizing

4.1 Market definition

Data Table on Offerings of companies included in the market definition

4.2 Market segment analysis

Market segments

4.3 Market size 2024

4.4 Market outlook: Forecast for 2024-2029

Chart on Global - Market size and forecast 2024-2029 ($ million)
Data Table on Global - Market size and forecast 2024-2029 ($ million)
Chart on Global Market: Year-over-year growth 2024-2029 (%)
Data Table on Global Market: Year-over-year growth 2024-2029 (%)

5. Historic Market Size

5.1 Global AI App Market 2019 - 2023

Historic Market Size - Data Table on Global AI App Market 2019 - 2023 ($ million)

5.2 Platform segment analysis 2019 - 2023

Historic Market Size - Platform Segment 2019 - 2023 ($ million)

5.3 Deployment segment analysis 2019 - 2023

Historic Market Size - Deployment Segment 2019 - 2023 ($ million)

5.4 End-user segment analysis 2019 - 2023

Historic Market Size - End-user Segment 2019 - 2023 ($ million)

5.5 Geography segment analysis 2019 - 2023

Historic Market Size - Geography Segment 2019 - 2023 ($ million)

5.6 Country segment analysis 2019 - 2023

Historic Market Size - Country Segment 2019 - 2023 ($ million)

6. Five Forces Analysis

6.1 Five forces summary

Five forces analysis - Comparison between 2024 and 2029

6.2 Bargaining power of buyers

Bargaining power of buyers - Impact of key factors 2024 and 2029

6.3 Bargaining power of suppliers

Bargaining power of suppliers - Impact of key factors in 2024 and 2029

6.4 Threat of new entrants

Threat of new entrants - Impact of key factors in 2024 and 2029

6.5 Threat of substitutes

Threat of substitutes - Impact of key factors in 2024 and 2029

6.6 Threat of rivalry

Threat of rivalry - Impact of key factors in 2024 and 2029

6.7 Market condition

Chart on Market condition - Five forces 2024 and 2029

7. Market Segmentation by Platform

7.1 Market segments

Chart on Platform - Market share 2024-2029 (%)
Data Table on Platform - Market share 2024-2029 (%)

7.2 Comparison by Platform

Chart on Comparison by Platform
Data Table on Comparison by Platform

7.3 Mobile apps - Market size and forecast 2024-2029

Chart on Mobile apps - Market size and forecast 2024-2029 ($ million)
Data Table on Mobile apps - Market size and forecast 2024-2029 ($ million)
Chart on Mobile apps - Year-over-year growth 2024-2029 (%)
Data Table on Mobile apps - Year-over-year growth 2024-2029 (%)

7.4 Web apps - Market size and forecast 2024-2029

Chart on Web apps - Market size and forecast 2024-2029 ($ million)
Data Table on Web apps - Market size and forecast 2024-2029 ($ million)
Chart on Web apps - Year-over-year growth 2024-2029 (%)
Data Table on Web apps - Year-over-year growth 2024-2029 (%)

7.5 Desktop apps - Market size and forecast 2024-2029

Chart on Desktop apps - Market size and forecast 2024-2029 ($ million)
Data Table on Desktop apps - Market size and forecast 2024-2029 ($ million)
Chart on Desktop apps - Year-over-year growth 2024-2029 (%)
Data Table on Desktop apps - Year-over-year growth 2024-2029 (%)

7.6 Market opportunity by Platform

Market opportunity by Platform ($ million)
Data Table on Market opportunity by Platform ($ million)

8. Market Segmentation by Deployment

8.1 Market segments

Chart on Deployment - Market share 2024-2029 (%)
Data Table on Deployment - Market share 2024-2029 (%)

8.2 Comparison by Deployment

Chart on Comparison by Deployment
Data Table on Comparison by Deployment

8.3 Cloud - Market size and forecast 2024-2029

Chart on Cloud - Market size and forecast 2024-2029 ($ million)
Data Table on Cloud - Market size and forecast 2024-2029 ($ million)
Chart on Cloud - Year-over-year growth 2024-2029 (%)
Data Table on Cloud - Year-over-year growth 2024-2029 (%)

8.4 On-premises - Market size and forecast 2024-2029

Chart on On-premises - Market size and forecast 2024-2029 ($ million)
Data Table on On-premises - Market size and forecast 2024-2029 ($ million)
Chart on On-premises - Year-over-year growth 2024-2029 (%)
Data Table on On-premises - Year-over-year growth 2024-2029 (%)

8.5 Market opportunity by Deployment

Market opportunity by Deployment ($ million)
Data Table on Market opportunity by Deployment ($ million)

9. Market Segmentation by End-user

9.1 Market segments

Chart on End-user - Market share 2024-2029 (%)
Data Table on End-user - Market share 2024-2029 (%)

9.2 Comparison by End-user

Chart on Comparison by End-user
Data Table on Comparison by End-user

9.3 Healthcare - Market size and forecast 2024-2029

Chart on Healthcare - Market size and forecast 2024-2029 ($ million)
Data Table on Healthcare - Market size and forecast 2024-2029 ($ million)
Chart on Healthcare - Year-over-year growth 2024-2029 (%)
Data Table on Healthcare - Year-over-year growth 2024-2029 (%)

9.4 Finance - Market size and forecast 2024-2029

Chart on Finance - Market size and forecast 2024-2029 ($ million)
Data Table on Finance - Market size and forecast 2024-2029 ($ million)
Chart on Finance - Year-over-year growth 2024-2029 (%)
Data Table on Finance - Year-over-year growth 2024-2029 (%)

9.5 Retail - Market size and forecast 2024-2029

Chart on Retail - Market size and forecast 2024-2029 ($ million)
Data Table on Retail - Market size and forecast 2024-2029 ($ million)
Chart on Retail - Year-over-year growth 2024-2029 (%)
Data Table on Retail - Year-over-year growth 2024-2029 (%)

9.6 Media - Market size and forecast 2024-2029

Chart on Media - Market size and forecast 2024-2029 ($ million)
Data Table on Media - Market size and forecast 2024-2029 ($ million)
Chart on Media - Year-over-year growth 2024-2029 (%)
Data Table on Media - Year-over-year growth 2024-2029 (%)

9.7 Others - Market size and forecast 2024-2029

Chart on Others - Market size and forecast 2024-2029 ($ million)
Data Table on Others - Market size and forecast 2024-2029 ($ million)
Chart on Others - Year-over-year growth 2024-2029 (%)
Data Table on Others - Year-over-year growth 2024-2029 (%)

9.8 Market opportunity by End-user

Market opportunity by End-user ($ million)
Data Table on Market opportunity by End-user ($ million)

10. Customer Landscape

10.1 Customer landscape overview

Analysis of price sensitivity, lifecycle, customer purchase basket, adoption rates, and purchase criteria

11. Geographic Landscape

11.1 Geographic segmentation

Chart on Market share by geography 2024-2029 (%)
Data Table on Market share by geography 2024-2029 (%)

11.2 Geographic comparison

Chart on Geographic comparison
Data Table on Geographic comparison

11.3 North America - Market size and forecast 2024-2029

Chart on North America - Market size and forecast 2024-2029 ($ million)
Data Table on North America - Market size and forecast 2024-2029 ($ million)
Chart on North America - Year-over-year growth 2024-2029 (%)
Data Table on North America - Year-over-year growth 2024-2029 (%)
Chart on Regional Comparison - North America
Data Table on Regional Comparison - North America

11.3.1 US - Market size and forecast 2024-2029

Chart on US - Market size and forecast 2024-2029 ($ million)
Data Table on US - Market size and forecast 2024-2029 ($ million)
Chart on US - Year-over-year growth 2024-2029 (%)
Data Table on US - Year-over-year growth 2024-2029 (%)

11.3.2 Canada - Market size and forecast 2024-2029

Chart on Canada - Market size and forecast 2024-2029 ($ million)
Data Table on Canada - Market size and forecast 2024-2029 ($ million)
Chart on Canada - Year-over-year growth 2024-2029 (%)
Data Table on Canada - Year-over-year growth 2024-2029 (%)

11.3.3 Mexico - Market size and forecast 2024-2029

Chart on Mexico - Market size and forecast 2024-2029 ($ million)
Data Table on Mexico - Market size and forecast 2024-2029 ($ million)
Chart on Mexico - Year-over-year growth 2024-2029 (%)
Data Table on Mexico - Year-over-year growth 2024-2029 (%)

11.4 Europe - Market size and forecast 2024-2029

Chart on Europe - Market size and forecast 2024-2029 ($ million)
Data Table on Europe - Market size and forecast 2024-2029 ($ million)
Chart on Europe - Year-over-year growth 2024-2029 (%)
Data Table on Europe - Year-over-year growth 2024-2029 (%)
Chart on Regional Comparison - Europe
Data Table on Regional Comparison - Europe

11.4.1 Germany - Market size and forecast 2024-2029

Chart on Germany - Market size and forecast 2024-2029 ($ million)
Data Table on Germany - Market size and forecast 2024-2029 ($ million)
Chart on Germany - Year-over-year growth 2024-2029 (%)
Data Table on Germany - Year-over-year growth 2024-2029 (%)

11.4.2 UK - Market size and forecast 2024-2029

Chart on UK - Market size and forecast 2024-2029 ($ million)
Data Table on UK - Market size and forecast 2024-2029 ($ million)
Chart on UK - Year-over-year growth 2024-2029 (%)
Data Table on UK - Year-over-year growth 2024-2029 (%)

11.4.3 France - Market size and forecast 2024-2029

Chart on France - Market size and forecast 2024-2029 ($ million)
Data Table on France - Market size and forecast 2024-2029 ($ million)
Chart on France - Year-over-year growth 2024-2029 (%)
Data Table on France - Year-over-year growth 2024-2029 (%)

11.4.4 Italy - Market size and forecast 2024-2029

Chart on Italy - Market size and forecast 2024-2029 ($ million)
Data Table on Italy - Market size and forecast 2024-2029 ($ million)
Chart on Italy - Year-over-year growth 2024-2029 (%)
Data Table on Italy - Year-over-year growth 2024-2029 (%)

11.4.5 Spain - Market size and forecast 2024-2029

Chart on Spain - Market size and forecast 2024-2029 ($ million)
Data Table on Spain - Market size and forecast 2024-2029 ($ million)
Chart on Spain - Year-over-year growth 2024-2029 (%)
Data Table on Spain - Year-over-year growth 2024-2029 (%)

11.4.6 The Netherlands - Market size and forecast 2024-2029

Chart on The Netherlands - Market size and forecast 2024-2029 ($ million)
Data Table on The Netherlands - Market size and forecast 2024-2029 ($ million)
Chart on The Netherlands - Year-over-year growth 2024-2029 (%)
Data Table on The Netherlands - Year-over-year growth 2024-2029 (%)

11.5 APAC - Market size and forecast 2024-2029

Chart on APAC - Market size and forecast 2024-2029 ($ million)
Data Table on APAC - Market size and forecast 2024-2029 ($ million)
Chart on APAC - Year-over-year growth 2024-2029 (%)
Data Table on APAC - Year-over-year growth 2024-2029 (%)
Chart on Regional Comparison - APAC
Data Table on Regional Comparison - APAC

11.5.1 China - Market size and forecast 2024-2029

Chart on China - Market size and forecast 2024-2029 ($ million)
Data Table on China - Market size and forecast 2024-2029 ($ million)
Chart on China - Year-over-year growth 2024-2029 (%)
Data Table on China - Year-over-year growth 2024-2029 (%)

11.5.2 India - Market size and forecast 2024-2029

Chart on India - Market size and forecast 2024-2029 ($ million)
Data Table on India - Market size and forecast 2024-2029 ($ million)
Chart on India - Year-over-year growth 2024-2029 (%)
Data Table on India - Year-over-year growth 2024-2029 (%)

11.5.3 South Korea - Market size and forecast 2024-2029

Chart on South Korea - Market size and forecast 2024-2029 ($ million)
Data Table on South Korea - Market size and forecast 2024-2029 ($ million)
Chart on South Korea - Year-over-year growth 2024-2029 (%)
Data Table on South Korea - Year-over-year growth 2024-2029 (%)

11.5.4 Japan - Market size and forecast 2024-2029

Chart on Japan - Market size and forecast 2024-2029 ($ million)
Data Table on Japan - Market size and forecast 2024-2029 ($ million)
Chart on Japan - Year-over-year growth 2024-2029 (%)
Data Table on Japan - Year-over-year growth 2024-2029 (%)

11.5.5 Australia - Market size and forecast 2024-2029

Chart on Australia - Market size and forecast 2024-2029 ($ million)
Data Table on Australia - Market size and forecast 2024-2029 ($ million)
Chart on Australia - Year-over-year growth 2024-2029 (%)
Data Table on Australia - Year-over-year growth 2024-2029 (%)

11.5.6 Indonesia - Market size and forecast 2024-2029

Chart on Indonesia - Market size and forecast 2024-2029 ($ million)
Data Table on Indonesia - Market size and forecast 2024-2029 ($ million)
Chart on Indonesia - Year-over-year growth 2024-2029 (%)
Data Table on Indonesia - Year-over-year growth 2024-2029 (%)

11.6 South America - Market size and forecast 2024-2029

Chart on South America - Market size and forecast 2024-2029 ($ million)
Data Table on South America - Market size and forecast 2024-2029 ($ million)
Chart on South America - Year-over-year growth 2024-2029 (%)
Data Table on South America - Year-over-year growth 2024-2029 (%)
Chart on Regional Comparison - South America
Data Table on Regional Comparison - South America

11.6.1 Brazil - Market size and forecast 2024-2029

Chart on Brazil - Market size and forecast 2024-2029 ($ million)
Data Table on Brazil - Market size and forecast 2024-2029 ($ million)
Chart on Brazil - Year-over-year growth 2024-2029 (%)
Data Table on Brazil - Year-over-year growth 2024-2029 (%)

11.6.2 Argentina - Market size and forecast 2024-2029

Chart on Argentina - Market size and forecast 2024-2029 ($ million)
Data Table on Argentina - Market size and forecast 2024-2029 ($ million)
Chart on Argentina - Year-over-year growth 2024-2029 (%)
Data Table on Argentina - Year-over-year growth 2024-2029 (%)

11.6.3 Colombia - Market size and forecast 2024-2029

Chart on Colombia - Market size and forecast 2024-2029 ($ million)
Data Table on Colombia - Market size and forecast 2024-2029 ($ million)
Chart on Colombia - Year-over-year growth 2024-2029 (%)
Data Table on Colombia - Year-over-year growth 2024-2029 (%)

11.7 Middle East and Africa - Market size and forecast 2024-2029

Chart on Middle East and Africa - Market size and forecast 2024-2029 ($ million)
Data Table on Middle East and Africa - Market size and forecast 2024-2029 ($ million)
Chart on Middle East and Africa - Year-over-year growth 2024-2029 (%)
Data Table on Middle East and Africa - Year-over-year growth 2024-2029 (%)
Chart on Regional Comparison - Middle East and Africa
Data Table on Regional Comparison - Middle East and Africa

11.7.1 South Africa - Market size and forecast 2024-2029

Chart on South Africa - Market size and forecast 2024-2029 ($ million)
Data Table on South Africa - Market size and forecast 2024-2029 ($ million)
Chart on South Africa - Year-over-year growth 2024-2029 (%)
Data Table on South Africa - Year-over-year growth 2024-2029 (%)

11.7.2 Saudi Arabia - Market size and forecast 2024-2029

Chart on Saudi Arabia - Market size and forecast 2024-2029 ($ million)
Data Table on Saudi Arabia - Market size and forecast 2024-2029 ($ million)
Chart on Saudi Arabia - Year-over-year growth 2024-2029 (%)
Data Table on Saudi Arabia - Year-over-year growth 2024-2029 (%)

11.7.3 UAE - Market size and forecast 2024-2029

Chart on UAE - Market size and forecast 2024-2029 ($ million)
Data Table on UAE - Market size and forecast 2024-2029 ($ million)
Chart on UAE - Year-over-year growth 2024-2029 (%)
Data Table on UAE - Year-over-year growth 2024-2029 (%)

11.7.4 Turkey - Market size and forecast 2024-2029

Chart on Turkey - Market size and forecast 2024-2029 ($ million)
Data Table on Turkey - Market size and forecast 2024-2029 ($ million)
Chart on Turkey - Year-over-year growth 2024-2029 (%)
Data Table on Turkey - Year-over-year growth 2024-2029 (%)

11.7.5 Israel - Market size and forecast 2024-2029

Chart on Israel - Market size and forecast 2024-2029 ($ million)
Data Table on Israel - Market size and forecast 2024-2029 ($ million)
Chart on Israel - Year-over-year growth 2024-2029 (%)
Data Table on Israel - Year-over-year growth 2024-2029 (%)

11.8 Market opportunity by geography

Market opportunity by geography ($ million)
Data Tables on Market opportunity by geography ($ million)

12. Drivers, Challenges, and Opportunity

12.1 Market drivers

Proliferation and democratization of generative AI
Accelerating enterprise adoption for operational efficiency and automation
Breakthroughs in on-device processing and ai-optimized hardware

12.2 Market challenges

Navigating complex and fragmented global regulatory landscape
Prohibitive computational costs and infrastructure dependencies
Overcoming ethical dilemmas and cultivating public trust

12.3 Impact of drivers and challenges

Impact of drivers and challenges in 2024 and 2029

12.4 Market opportunities

Proliferation of generative artificial intelligence applications
Imperative for hyper-personalized user experiences
Synergistic catalyst of 5G technology

13. Competitive Landscape

13.1 Overview

13.2

Overview on criticality of inputs and factors of differentiation

13.3 Landscape disruption

Overview on factors of disruption

13.4 Industry risks

Impact of key risks on business

14. Competitive Analysis

14.1 Companies profiled

Companies covered

14.2 Company ranking index

14.3 Market positioning of companies

Matrix on companies position and classification

14.4 Adobe Inc.

Adobe Inc. - Overview
Adobe Inc. - Business segments
Adobe Inc. - Key news
Adobe Inc. - Key offerings
Adobe Inc. - Segment focus
SWOT

14.5 Alphabet Inc.

Alphabet Inc. - Overview
Alphabet Inc. - Business segments
Alphabet Inc. - Key offerings
Alphabet Inc. - Segment focus
SWOT

14.6 Amazon Web Services Inc.

Amazon Web Services Inc. - Overview
Amazon Web Services Inc. - Product / Service
Amazon Web Services Inc. - Key news
Amazon Web Services Inc. - Key offerings
SWOT

14.7 Anthropic

Anthropic - Overview
Anthropic - Product / Service
Anthropic - Key offerings
SWOT

14.8 Apple Inc.

Apple Inc. - Overview
Apple Inc. - Business segments
Apple Inc. - Key news
Apple Inc. - Key offerings
Apple Inc. - Segment focus
SWOT

14.9 Cohere

Cohere - Overview
Cohere - Product / Service
Cohere - Key offerings
SWOT

14.10 Glean Technologies Inc.

Glean Technologies Inc. - Overview
Glean Technologies Inc. - Product / Service
Glean Technologies Inc. - Key offerings
SWOT

14.11 IBM Corp.

IBM Corp. - Overview
IBM Corp. - Business segments
IBM Corp. - Key news
IBM Corp. - Key offerings
IBM Corp. - Segment focus
SWOT

14.12 Meta Platforms Inc.

Meta Platforms Inc. - Overview
Meta Platforms Inc. - Business segments
Meta Platforms Inc. - Key offerings
Meta Platforms Inc. - Segment focus
SWOT

14.13 Microsoft Corp.

Microsoft Corp. - Overview
Microsoft Corp. - Business segments
Microsoft Corp. - Key news
Microsoft Corp. - Key offerings
Microsoft Corp. - Segment focus
SWOT

14.14 NVIDIA Corp.

NVIDIA Corp. - Overview
NVIDIA Corp. - Business segments
NVIDIA Corp. - Key news
NVIDIA Corp. - Key offerings
NVIDIA Corp. - Segment focus
SWOT

14.15 OpenAI

OpenAI - Overview
OpenAI - Product / Service
OpenAI - Key offerings
SWOT

14.16 Perplexity AI Inc

Perplexity AI Inc - Overview
Perplexity AI Inc - Product / Service
Perplexity AI Inc - Key offerings
SWOT

14.17 Salesforce Inc.

Salesforce Inc. - Overview
Salesforce Inc. - Product / Service
Salesforce Inc. - Key news
Salesforce Inc. - Key offerings
SWOT

14.18 SoundHound AI Inc.

SoundHound AI Inc. - Overview
SoundHound AI Inc. - Product / Service
SoundHound AI Inc. - Key offerings
SWOT

15. Appendix

15.1 Scope of the report

Market definition
Objectives
Notes and caveats

15.2 Inclusions and exclusions checklist

Inclusions checklist
Exclusions checklist

15.3 Currency conversion rates for US$

15.4 Research methodology

15.5 Data procurement

Information sources

15.6 Data validation

15.7 Validation techniques employed for market sizing

15.8 Data synthesis

15.9 360 degree market analysis

15.10 List of abbreviations

Research Methodology

Technavio presents a detailed picture of the market by way of study, synthesis, and summation of data from multiple sources. The analysts have presented the various facets of the market with a particular focus on identifying the key industry influencers. The data thus presented is comprehensive, reliable, and the result of extensive research, both primary and secondary.

INFORMATION SOURCES

Primary sources

  • Manufacturers and suppliers
  • Channel partners
  • Industry experts
  • Strategic decision makers

Secondary sources

  • Industry journals and periodicals
  • Government data
  • Financial reports of key industry players
  • Historical data
  • Press releases

DATA ANALYSIS

Data Synthesis

  • Collation of data
  • Estimation of key figures
  • Analysis of derived insights

Data Validation

  • Triangulation with data models
  • Reference against proprietary databases
  • Corroboration with industry experts

REPORT WRITING

Qualitative

  • Market drivers
  • Market challenges
  • Market trends
  • Five forces analysis

Quantitative

  • Market size and forecast
  • Market segmentation
  • Geographical insights
  • Competitive landscape

Interested in this report?

Get your sample now to see our research methodology and insights!

Download Now

Frequently Asked Questions

AI App market growth will increase by USD 32255.2 million during 2025-2029.

The AI App market is expected to grow at a CAGR of 44.9% during 2025-2029.

AI App market is segmented by Platform (Mobile apps, Web apps, Desktop apps) Deployment (Cloud, On-premises) End-user (Healthcare, Finance, Retail, Media, Others)

Adobe Inc., Alphabet Inc., Amazon Web Services Inc., Anthropic, Apple Inc., Cohere, DeepL SE, Eleven Labs Inc., Glean Technologies Inc., IBM Corp., Meta Platforms Inc., Microsoft Corp., Midjourney, NVIDIA Corp., OpenAI, Perplexity AI Inc, Runway AI Inc., Salesforce Inc., SoundHound AI Inc., UiPath Inc. are a few of the key vendors in the AI App market.

North America will register the highest growth rate of 35% among the other regions. Therefore, the AI App market in North America is expected to garner significant business opportunities for the vendors during the forecast period.

US, Canada, Mexico, Germany, UK, France, Italy, Spain, The Netherlands, China, India, South Korea, Japan, Australia, Indonesia, Brazil, Argentina, Colombia, South Africa, Saudi Arabia, UAE, Turkey, Israel

  • Proliferation and democratization of generative AI is the driving factor this market.

The AI App market vendors should focus on grabbing business opportunities from the Platform segment as it accounted for the largest market share in the base year.