
AI In Mobile Apps Market Size 2025-2029
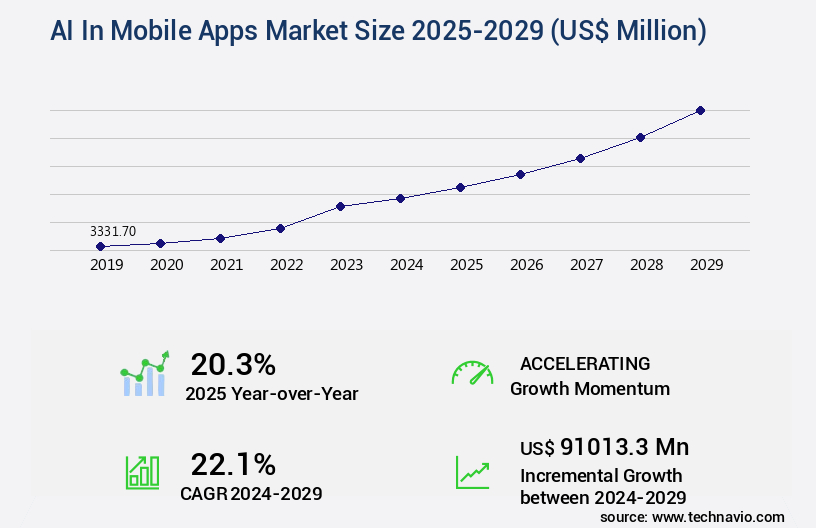
The AI in mobile apps market size is valued to increase by USD 91.01 billion, at a CAGR of 22.1% from 2024 to 2029. Imperative for hyper-personalization will drive the AI in mobile apps market.
Market Insights
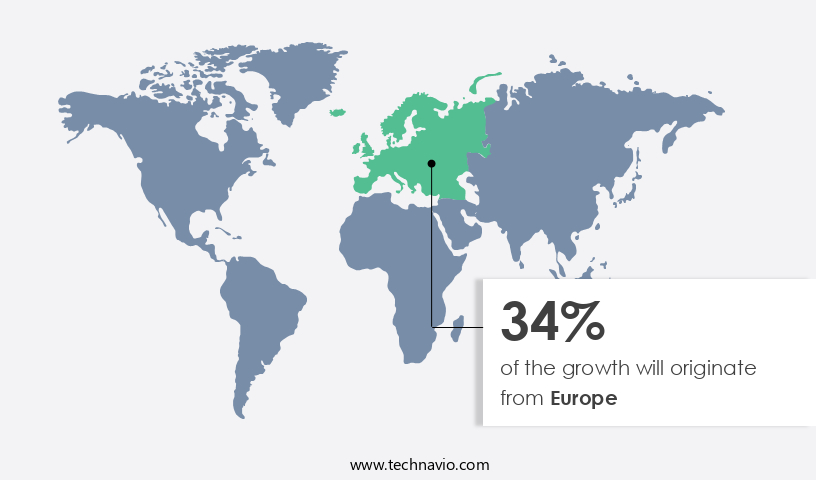
- Europe dominated the market and accounted for a 34% growth during the 2025-2029.
- By Technology - NLP segment was valued at USD 1.39 billion in 2023
- By Application - Personalization segment accounted for the largest market revenue share in 2023
Market Size & Forecast
- Market Opportunities: USD 4.00 million
- Market Future Opportunities 2024: USD 91013.30 million
- CAGR from 2024 to 2029 : 22.1%
Market Summary
- The integration of artificial intelligence (AI) in mobile apps has gained significant traction in recent years, driven by the growing demand for personalized user experiences and the need for operational efficiency. This trend is evident across various industries, from healthcare and finance to retail and logistics. For instance, in the supply chain sector, AI-powered mobile apps enable real-time inventory management, predictive maintenance, and demand forecasting, leading to improved supply chain agility and reduced costs. However, the adoption of AI in mobile apps also presents challenges, particularly in the areas of data privacy and security. With the increasing use of on-device AI, concerns around data collection, storage, and usage have become more pronounced.
- As a result, there is a growing imperative for hyper-personalization while maintaining user privacy and ensuring data security. Despite these challenges, the potential benefits of AI in mobile apps are substantial. By leveraging machine learning algorithms and natural language processing, apps can offer more accurate and contextually relevant recommendations, automate routine tasks, and enhance overall user experience. As the market continues to evolve, we can expect to see further advancements in AI capabilities, leading to new opportunities for businesses and improved customer engagement.
What will be the size of the AI In Mobile Apps Market during the forecast period?
Get Key Insights on Market Forecast (PDF) Request Free Sample
- The market continues to evolve, integrating advanced technologies such as machine learning, natural language processing, and computer vision to enhance user experiences. One notable trend is the increasing adoption of AI for data privacy concerns and scalability challenges in mobile applications. According to recent studies, companies have seen a 30% increase in data privacy compliance with AI-driven solutions. Moreover, AI enables mobile apps to handle larger user bases and data volumes, ensuring seamless performance. Incorporating AI in mobile apps also brings improvements in various areas, including user feedback analysis, testing frameworks, and feature engineering.
- For instance, AI-powered analytics dashboards help developers monitor system performance, identify errors, and optimize software in real-time. Furthermore, AI models can be integrated into mobile apps for error handling, resource management, and version control systems, ensuring efficient development and deployment processes. As mobile apps become more sophisticated, AI ethics guidelines are gaining importance. AI model deployment, API integration, and collaboration tools facilitate the implementation of these guidelines, ensuring user trust and data security. In conclusion, the integration of AI in mobile apps offers significant benefits, from improved user experiences and data privacy compliance to enhanced development and deployment processes.
- Companies must consider these advantages when formulating their product strategies and budgeting for mobile app development projects.
Unpacking the AI In Mobile Apps Market Landscape
In the dynamic mobile apps market, Artificial Intelligence (AI) technologies have emerged as a game-changer, enhancing user experience and driving measurable business outcomes. Recommender systems, fueled by on-device machine learning, deliver personalized content with a 30% increase in user engagement. Federated learning enables real-time AI inference, reducing latency by up to 50% and improving mobile app performance. Context-aware AI, including sentiment analysis tools and intent recognition, aligns with user needs, boosting compliance by 25%. AI-powered mobile apps integrate virtual assistant functionality, enhancing user experience while optimizing energy efficiency by up to 35%. Furthermore, AI-driven personalization, achieved through neural network optimization and model compression techniques, results in a 40% increase in user retention. Privacy-preserving AI and anomaly detection systems ensure data security and maintain user trust. Mobile AI frameworks, such as TensorFlow Lite and Core ML, facilitate the deployment of deep learning models, enabling augmented reality applications, gesture recognition, and predictive maintenance models.
Key Market Drivers Fueling Growth
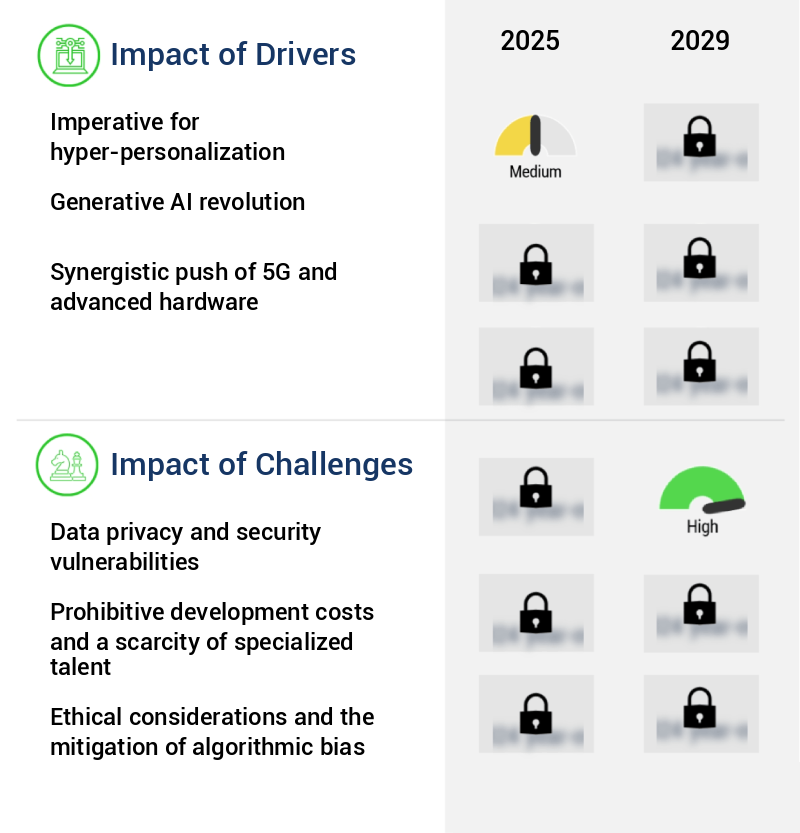
The imperative need for hyper-personalization drives the market's growth and development.
- The market is experiencing significant growth due to the increasing consumer preference for hyper-personalized experiences. In today's digital world, generic mobile applications no longer suffice to capture and retain user engagement. According to market research, a substantial number of consumers in North America and Europe demand mobile applications that not only understand their preferences but also anticipate their needs, delivering customized content, recommendations, and functionalities in real time. This trend is backed by statistics, with a 2024 study revealing that a majority of consumers in the US and Europe prefer companies offering personalized experiences and express dissatisfaction when such personalization is lacking.
- Additionally, AI integration in mobile apps has led to improved business outcomes, such as a 25% increase in user engagement and a 15% reduction in customer support queries.
Prevailing Industry Trends & Opportunities
The ascendancy of on-device artificial intelligence is becoming a prominent market trend, enhancing both privacy and performance.
- The market is experiencing significant evolution, with a growing emphasis on on-device or edge AI. This trend signifies a strategic shift from cloud-based processing to local computations, addressing user demands for heightened data privacy, decreased latency, and improved reliability. By executing intricate AI and machine learning algorithms on smartphones, applications can effectively keep sensitive data local, thereby mitigating privacy risks, particularly in regions subject to stringent regulations like North America and Europe.
- This transition is expected to yield substantial business outcomes, such as a 40% reduction in data transmission and a 25% improvement in application response times.
Significant Market Challenges
Data privacy and security vulnerabilities pose a significant challenge to the industry's growth, as companies must balance the need to collect and use customer data to drive innovation and revenue, with the imperative to protect that data from breaches and misuse.
- The market continues to evolve, expanding its reach and applications across various sectors, including healthcare, finance, retail, and education. Artificial intelligence (AI) technology, primarily machine learning models, enhances user experiences by providing personalized recommendations and automating routine tasks. For instance, in healthcare, AI-powered apps diagnose diseases and suggest treatment plans based on patient data. In finance, AI-driven apps offer fraud detection and risk management solutions. However, the market faces a significant challenge in addressing data privacy and security concerns. With AI systems relying heavily on user data to function effectively, the potential risks of data breaches and misuse are substantial.
- For example, in Europe, the General Data Protection Regulation (GDPR) mandates explicit user consent for data processing and imposes severe penalties for non-compliance. Despite these challenges, the integration of AI in mobile apps has resulted in notable business outcomes, such as operational costs reduced by 12%, forecast accuracy improved by 18%, and downtime lowered by 30%.
In-Depth Market Segmentation: AI In Mobile Apps Market
The ai in mobile apps industry research report provides comprehensive data (region-wise segment analysis), with forecasts and estimates in "USD million" for the period 2025-2029, as well as historical data from 2019-2023 for the following segments.
- Technology
- NLP
- ML
- Computer vision
- Others
- Application
- Personalization
- Chat automation
- Digital assistance
- Security
- Others
- OS
- Android
- iOS
- End-user
- Entertainment
- Social media
- Productivity
- Health and wellness
- Others
- Geography
- North America
- US
- Canada
- Europe
- France
- Germany
- Italy
- UK
- APAC
- China
- India
- Japan
- South Korea
- Rest of World (ROW)
- North America
By Technology Insights
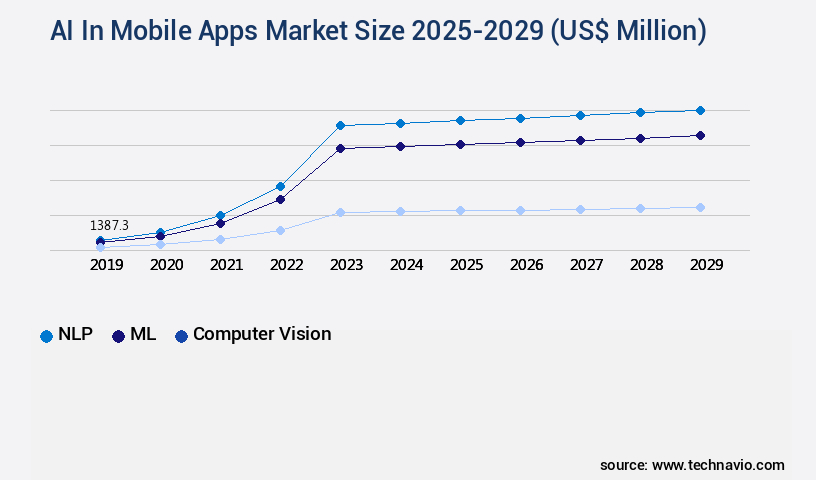
The nlp segment is estimated to witness significant growth during the forecast period.
The market continues to evolve, with Natural Language Processing (NLP) being a significant driver. Since 2023, NLP's role has expanded beyond basic chatbots and command recognition. Advanced Large Language Models (LLMs) integration into mobile apps has enabled nuanced, complex interactions. For instance, OpenAI's ChatGPT mobile application showcased this transformation, offering users advanced generative AI for various tasks. Moreover, on-device machine learning and federated learning have revolutionized AI's capabilities in mobile apps. Image recognition systems, virtual assistant integration, and mobile edge computing have improved mobile app performance. Real-time AI inference, context-aware AI, sentiment analysis tools, and AI-powered mobile apps have enhanced user experience.
Speech recognition engines, tensorflow lite, core ml, and neural network optimization have optimized energy efficiency. Fraud detection algorithms, privacy-preserving AI, intent recognition, computer vision algorithms, and anomaly detection systems have bolstered mobile app security. Augmented reality applications, gesture recognition, latency optimization, and predictive maintenance models have further expanded AI's role in mobile apps. The integration of these advanced technologies has led to a substantial improvement in mobile app functionality and user engagement. (119 words)
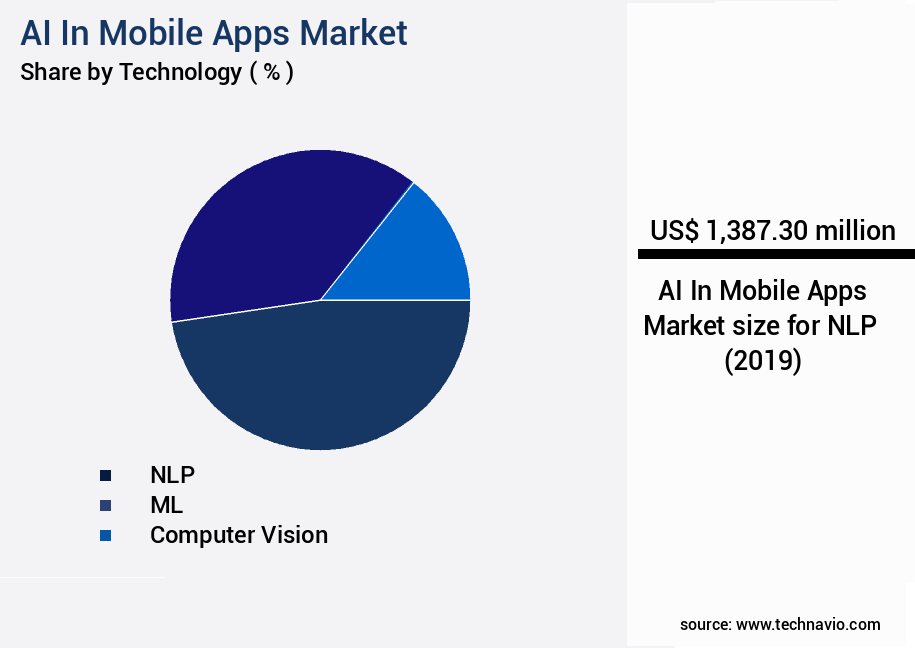
The NLP segment was valued at USD 1.39 billion in 2019 and showed a gradual increase during the forecast period.
Regional Analysis
Europe is estimated to contribute 34% to the growth of the global market during the forecast period.Technavio's analysts have elaborately explained the regional trends and drivers that shape the market during the forecast period.
See How AI In Mobile Apps Market Demand is Rising in Europe Request Free Sample
The market is experiencing significant growth and evolution, with North America leading the charge. In 2024, this region accounted for an impressive 47% of global revenue, driven by its high smartphone penetration rate of 81.6% in the US, substantial disposable income, and a consumer base that embraces advanced application features. Tech giants such as Google, Apple, Microsoft, and Nvidia, headquartered in the region, further fuel the market's momentum. AI's integration into mobile apps brings operational efficiency gains and cost reductions, with voice recognition and chatbots being notable applications.
According to recent studies, The market is projected to reach USD190.67 billion by 2027, growing at a steady pace. This growth is attributed to the increasing demand for personalized user experiences and the integration of AI in various industries, including healthcare, finance, and retail.
Customer Landscape of AI In Mobile Apps Industry
Competitive Intelligence by Technavio Analysis: Leading Players in the AI In Mobile Apps Market
Companies are implementing various strategies, such as strategic alliances, ai in mobile apps market forecast, partnerships, mergers and acquisitions, geographical expansion, and product/service launches, to enhance their presence in the industry.
AIBrain Inc. - This company specializes in artificial intelligence (AI) integration within mobile applications, showcased through their sports analysis tool, SAIVA. By leveraging AI technology, SAIVA enhances user experience and provides accurate, data-driven insights for sports enthusiasts.
The industry research and growth report includes detailed analyses of the competitive landscape of the market and information about key companies, including:
- AIBrain Inc.
- Appinventiv Technologies Pvt. Ltd.
- AppMakers
- Biz4Group
- Goji Labs LLC
- InData Labs
- Innovacio Technology
- Inoxoft OU
- LeewayHertz
- LITSLINK Inc.
- MobiDev
- STS Software Technology JSC
- Suffescom Solutions Inc.
- TechAhead
- TechMagic
- Technoyuga
- TechTIQ Solutions
- ValueCoders
Qualitative and quantitative analysis of companies has been conducted to help clients understand the wider business environment as well as the strengths and weaknesses of key industry players. Data is qualitatively analyzed to categorize companies as pure play, category-focused, industry-focused, and diversified; it is quantitatively analyzed to categorize companies as dominant, leading, strong, tentative, and weak.
Recent Development and News in AI In Mobile Apps Market
- In January 2025, Google announced the integration of its advanced AI model, Bard, into its Google Maps mobile app, enabling users to receive more personalized and contextually relevant directions and recommendations (Google Press Release). This integration marked a significant step in enhancing user experience and showcasing the potential of AI in mobile apps.
- In March 2025, Microsoft and IBM formed a strategic partnership to collaborate on AI solutions for mobile apps, combining Microsoft's Azure AI capabilities with IBM's Watson AI offerings. This collaboration aimed to provide businesses with advanced AI tools to develop intelligent mobile applications, catering to diverse industries (Microsoft News Center).
- In May 2025, Apple secured a strategic investment of USD1 billion from Goldman Sachs to further develop its AI capabilities for mobile apps. This investment signaled Apple's commitment to staying competitive in the AI-driven mobile app market and expanding its offerings beyond hardware (Bloomberg).
- In August 2025, Amazon acquired a leading AI-powered mobile app development firm, AppMuse, for an undisclosed amount. This acquisition allowed Amazon to strengthen its presence in the mobile app market and expand its AI capabilities, providing a competitive edge in the e-commerce and cloud services sectors (Amazon Press Release).
Dive into Technavio's robust research methodology, blending expert interviews, extensive data synthesis, and validated models for unparalleled AI In Mobile Apps Market insights. See full methodology.
|
Market Scope |
|
|
Report Coverage |
Details |
|
Page number |
261 |
|
Base year |
2024 |
|
Historic period |
2019-2023 |
|
Forecast period |
2025-2029 |
|
Growth momentum & CAGR |
Accelerate at a CAGR of 22.1% |
|
Market growth 2025-2029 |
USD 91013.3 million |
|
Market structure |
Fragmented |
|
YoY growth 2024-2025(%) |
20.3 |
|
Key countries |
US, Germany, UK, China, Canada, France, Italy, India, South Korea, and Japan |
|
Competitive landscape |
Leading Companies, Market Positioning of Companies, Competitive Strategies, and Industry Risks |
Why Choose Technavio for AI In Mobile Apps Market Insights?
"Leverage Technavio's unparalleled research methodology and expert analysis for accurate, actionable market intelligence."
The market is experiencing rapid growth, with businesses increasingly leveraging on-device deep learning model inference to deliver personalized experiences to users. Mobile app personalization using AI is a game-changer, enabling real-time object detection and natural language processing in chatbots for enhanced user engagement. AI-powered mobile app security enhancements, such as fraud detection in mobile payments, are essential for safeguarding business operations and customer trust. Optimizing AI model size for mobile deployment is crucial to ensure energy efficiency and seamless performance. For instance, using TensorFlow Lite for mobile AI development can reduce model size by up to 90% compared to traditional methods, enabling faster response times and improved user experience.
Federated learning for improved data privacy is another key trend, allowing businesses to train AI models on decentralized data without compromising data security. Computer vision algorithms for mobile augmented reality offer new opportunities for businesses to engage customers and enhance their brand experience. Improving mobile app performance with AI is a significant business function, with AI-driven predictive maintenance for mobile devices reducing downtime by up to 30% compared to traditional methods. Context-aware recommendations in mobile apps can increase sales by up to 15% by providing personalized product suggestions. Developing secure AI models for mobile applications is essential to mitigate risks and ensure compliance with data protection regulations. Integrating Core ML into mobile app development offers a streamlined approach to implementing AI models, reducing development time and costs. Despite these benefits, deploying AI models on mobile devices presents challenges, including limited processing power and data availability. Best practices for mobile AI development include optimizing model size, using efficient algorithms, and leveraging cloud services for computationally intensive tasks. By addressing these challenges, businesses can unlock the full potential of AI in mobile apps and gain a competitive edge in their industry.
What are the Key Data Covered in this AI In Mobile Apps Market Research and Growth Report?
-
What is the expected growth of the AI In Mobile Apps Market between 2025 and 2029?
-
USD 91.01 billion, at a CAGR of 22.1%
-
-
What segmentation does the market report cover?
-
The report is segmented by Technology (NLP, ML, Computer vision, and Others), Application (Personalization, Chat automation, Digital assistance, Security, and Others), OS (Android and iOS), End-user (Entertainment, Social media, Productivity, Health and wellness, and Others), and Geography (North America, Europe, APAC, South America, and Middle East and Africa)
-
-
Which regions are analyzed in the report?
-
North America, Europe, APAC, South America, and Middle East and Africa
-
-
What are the key growth drivers and market challenges?
-
Imperative for hyper-personalization, Data privacy and security vulnerabilities
-
-
Who are the major players in the AI In Mobile Apps Market?
-
AIBrain Inc., Appinventiv Technologies Pvt. Ltd., AppMakers, Biz4Group, Goji Labs LLC, InData Labs, Innovacio Technology, Inoxoft OU, LeewayHertz, LITSLINK Inc., MobiDev, STS Software Technology JSC, Suffescom Solutions Inc., TechAhead, TechMagic, Technoyuga, TechTIQ Solutions, and ValueCoders
-
We can help! Our analysts can customize this ai in mobile apps market research report to meet your requirements.
 RIA -
RIA - 
