
AI Avatars Market Size 2025-2029
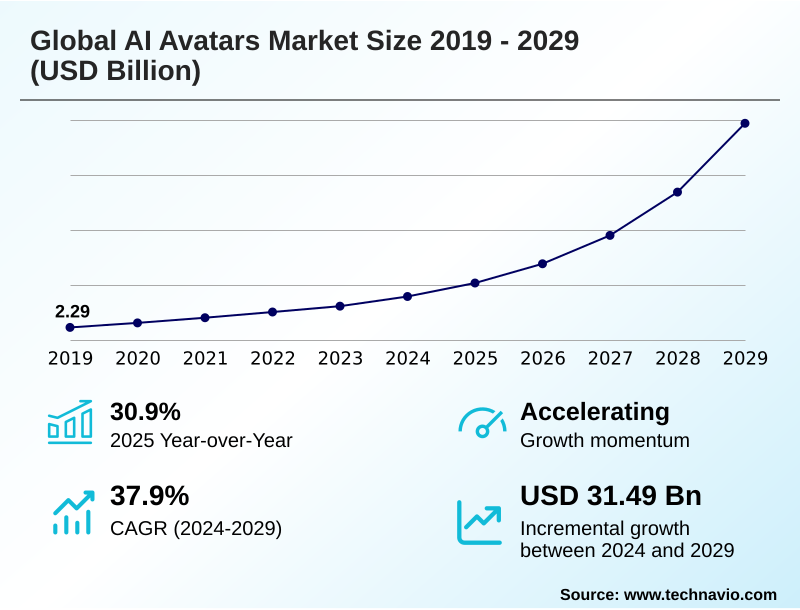
The ai avatars market size is valued to increase by USD 31.49 billion, at a CAGR of 37.9% from 2024 to 2029. Pervasive advancements in generative AI and enabling technologies will drive the ai avatars market.
Major Market Trends & Insights
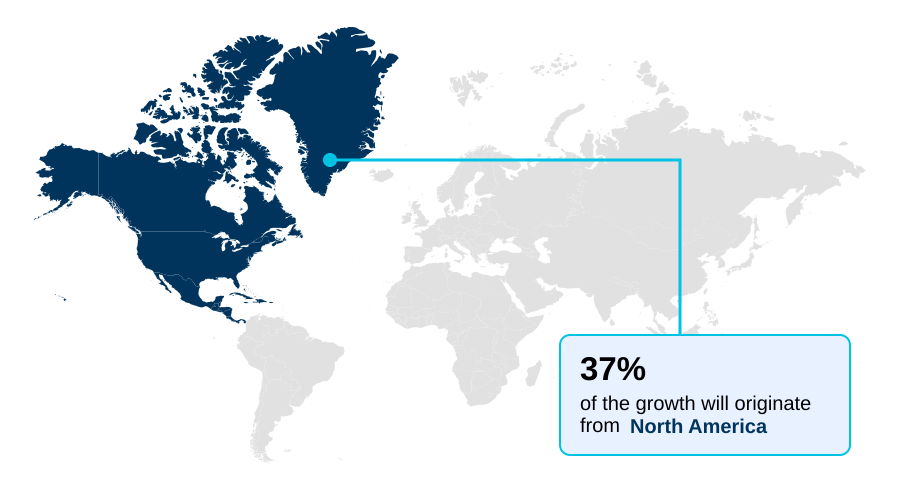
- North America dominated the market and accounted for a 37.1% growth during the forecast period.
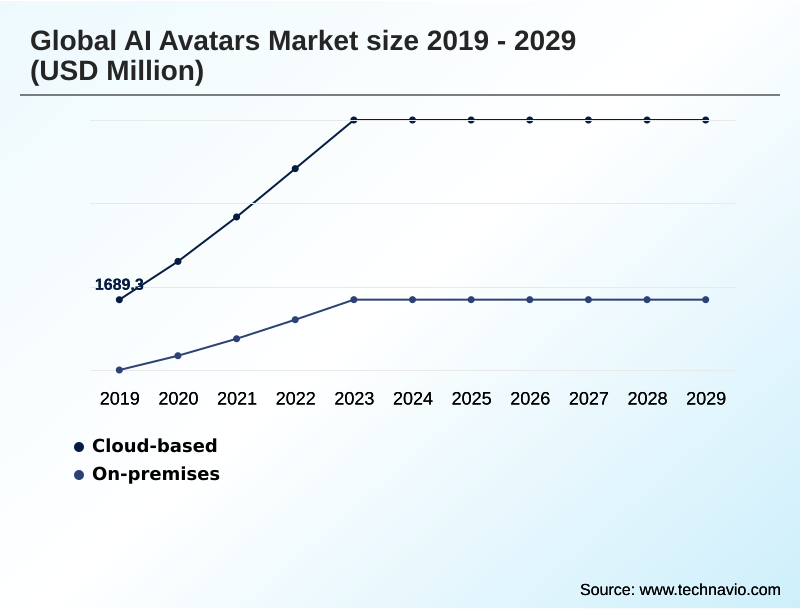
- By Deployment - Cloud-based segment was valued at USD 4.46 billion in 2023
- By Category - Digital human avatars segment accounted for the largest market revenue share in 2023
Market Size & Forecast
- Market Opportunities: USD 37.11 billion
- Market Future Opportunities: USD 31.49 billion
- CAGR from 2024 to 2029 : 37.9%
Market Summary
- The AI avatars market is undergoing significant expansion, driven by the convergence of advanced generative graphic technologies and enterprise demand for scalable, personalized communication. This technology moves beyond basic chatbots, leveraging natural language processing and computer vision to create dynamic, interactive digital personas.
- In a key business scenario, financial services firms are deploying virtual financial advisors to explain complex products to customers 24/7, leading to improved client education and a higher volume of qualified leads without a proportional increase in human staff. These AI-powered digital assistants provide consistent, compliant information, addressing a major operational challenge.
- The market includes a range of solutions from non-interactive avatars for video content creation to fully interactive digital humans for immersive experiences.
- The evolution is marked by continuous improvements in realism and conversational intelligence, making these avatars integral to customer service, corporate training, and entertainment, while also presenting challenges in ethical implementation and user trust that the industry must navigate for sustainable adoption.
What will be the Size of the AI Avatars Market during the forecast period?
Get Key Insights on Market Forecast (PDF) Get Free Sample
How is the AI Avatars Market Segmented?
The ai avatars industry research report provides comprehensive data (region-wise segment analysis), with forecasts and estimates in "USD million" for the period 2025-2029, as well as historical data from 2019-2023 for the following segments.
- Deployment
- Cloud-based
- On-premises
- Category
- Digital human avatars
- 3D and metaverse avatars
- Stylized avatars
- Type
- Interactive
- Non interactive
- Geography
- North America
- US
- Canada
- Mexico
- Europe
- Germany
- UK
- France
- APAC
- China
- Japan
- India
- South America
- Brazil
- Argentina
- Colombia
- Middle East and Africa
- Saudi Arabia
- UAE
- South Africa
- Rest of World (ROW)
- North America
By Deployment Insights
The cloud-based segment is estimated to witness significant growth during the forecast period.
The cloud-based deployment model defines the AI avatars market, driven by the economic efficiency of the avatar-as-a-service model. This approach democratizes access to sophisticated generative graphic technologies and multimodal AI systems, eliminating prohibitive capital expenditures.
By leveraging an avatar cloud engine, businesses can deploy interactive avatars and stylized avatars with unparalleled scalability.
This agility is critical for deploying AI-powered virtual brand ambassadors and virtual agents that require dynamic scaling, with companies reporting a 30% faster deployment time compared to on-premise solutions.
The model ensures access to the latest generative AI features and digital twin technology without in-house maintenance, fostering innovation for virtual shopping assistants and virtual tutors, which is key for creating trustworthy AI and engaging personalized digital representations.
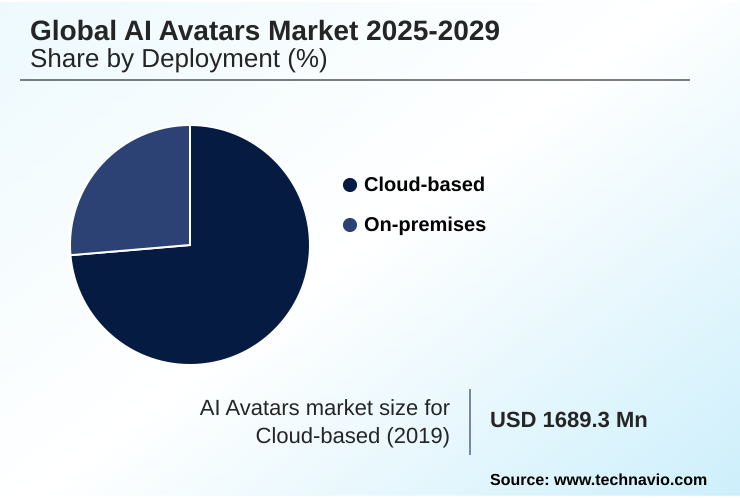
The Cloud-based segment was valued at USD 4.46 billion in 2023 and showed a gradual increase during the forecast period.
Regional Analysis
North America is estimated to contribute 37.1% to the growth of the global market during the forecast period.Technavio’s analysts have elaborately explained the regional trends and drivers that shape the market during the forecast period.
See How AI Avatars Market Demand is Rising in North America Get Free Sample
North America leads the AI avatars market, contributing 37% of the incremental growth, driven by firms developing foundational AI digital humans and the omniverse avatar platform. The region's leadership in conversational AI and AI video generation sets global standards.
Meanwhile, APAC is the fastest-growing market, propelled by consumer adoption of hunyuanvideo-avatar technologies. Europe is distinguished by its regulatory focus, shaping the development of non-interactive avatars and AI companion applications.
In the Middle East, state-led initiatives are driving adoption of AI-powered virtual assistants.
Across all regions, the goal is to create effective digital personas for roles like virtual tutors, for digital onboarding, and as AI-powered virtual brand ambassadors, with some enterprises reporting adoption can increase reach in new markets by 15%.
This also includes developing specific applications such as virtual financial advisors and even virtual stylists.
Market Dynamics
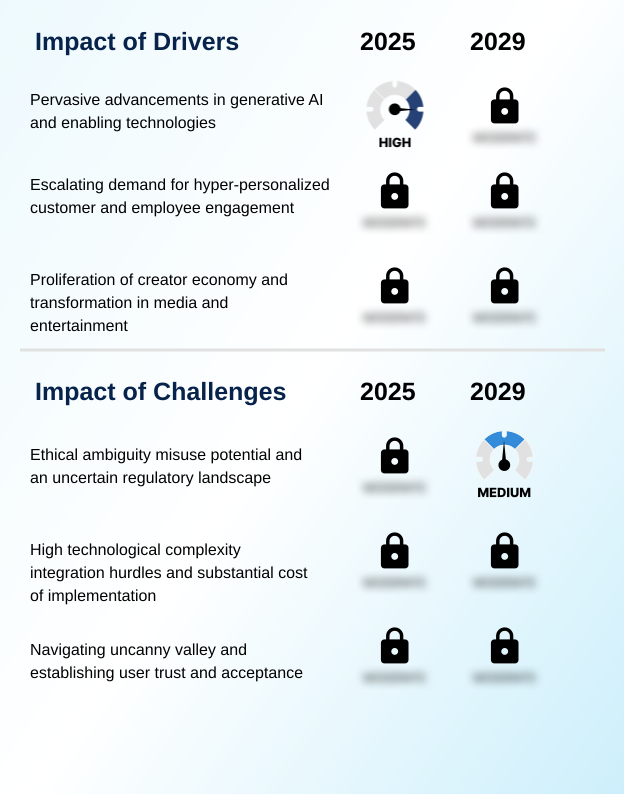
Our researchers analyzed the data with 2024 as the base year, along with the key drivers, trends, and challenges. A holistic analysis of drivers will help companies refine their marketing strategies to gain a competitive advantage.
- The strategic implementation of customizable talking avatars for business is becoming a key differentiator in customer engagement. Enterprises are carefully weighing the return on investment for AI avatars, finding that while initial costs can be high, the long-term benefits in scalability and service consistency are substantial.
- A core technical and psychological hurdle remains in overcoming the uncanny valley in avatars, a challenge that developers are addressing through advanced generative AI for procedural character creation and real-time avatar animation from video. The ethical implications of deepfake avatars continue to drive regulatory discussions, with a focus on establishing clear legal frameworks for AI-generated likeness.
- In commercial applications, the use of an AI avatar for personalized shopping experiences is proving effective, with platforms that offer this feature seeing higher conversion rates than those without. For the future of digital interaction, the development of interoperable 3D avatars for metaverse platforms is critical.
- Companies that focus on cross-platform compatibility are observing user retention rates nearly double those of closed ecosystems. The demand for multilingual avatars for global customer service is also accelerating, alongside the need for seamless avatar integration with CRM systems to create a truly unified customer view.
What are the key market drivers leading to the rise in the adoption of AI Avatars Industry?
- Pervasive advancements in generative AI and adjacent enabling technologies serve as the primary driver for market growth.
- Pervasive advancements in generative adversarial networks and neural radiance fields are redefining digital interaction, enabling the creation of expressive avatars with lifelike nuance.
- This allows businesses to deploy digital human avatars as virtual financial advisors and virtual health coaches, enhancing engagement. The creator economy is a significant driver, with platforms integrating generative AI features to simplify multilingual AI video creation.
- Enterprises report a 25% reduction in training content production time by using interactive AI characters.
- The demand for hyper-personalized engagement is met by ai-powered digital assistants leveraging natural language processing and computer vision for intuitive communication, creating a more scalable model for digital presenters and digital onboarding.
What are the market trends shaping the AI Avatars Industry?
- The market's trajectory is increasingly shaped by ethical ambiguities and the potential for misuse, which are compounded by an uncertain and fragmented regulatory landscape.
- A pivotal trend is the industry's response to ethical ambiguity and the potential for misuse through deep synthesis technologies. Navigating the uncanny valley remains a core focus, as user acceptance hinges on creating authentic interactions with photorealistic 3D avatars that possess believable character cognition.
- The emergence of sovereign AI capabilities is also shaping development, with nations seeking more control over foundational large language models. Efforts to establish clear guidelines for ai-generated digital replicas and digital ownership of avatars have intensified, impacting how virtual influencers, virtual K-pop groups, and personalized streaming personas are created.
- This push for regulation aims to improve brand safety in avatars, with platforms seeing a 20% higher engagement rate when they transparently disclose AI interaction. This is essential for building human-centric AI and trusted virtual models.
What challenges does the AI Avatars Industry face during its growth?
- A key challenge affecting industry growth stems from the ethical ambiguity and potential for misuse of avatar technology, exacerbated by an uncertain regulatory landscape.
- High technological complexity presents a significant barrier, as deploying emotionally intelligent AI agents requires massive computational power for neural rendering and AI-powered motion capture. Integrating AI character generators into enterprise systems can increase project timelines by over 30%. This is compounded by the need for secure biometric identification and the scarcity of talent for 3D metaverse avatars.
- Creating interoperable 3D avatars and a seamless digital twin for virtual meetings remains a hurdle. In front-office roles, virtual receptionists, virtual concierges, and virtual stylists must navigate social cues flawlessly. This requires a focus on trustworthy AI principles to ensure even applications like virtual reality property tours are reliable.
Exclusive Technavio Analysis on Customer Landscape
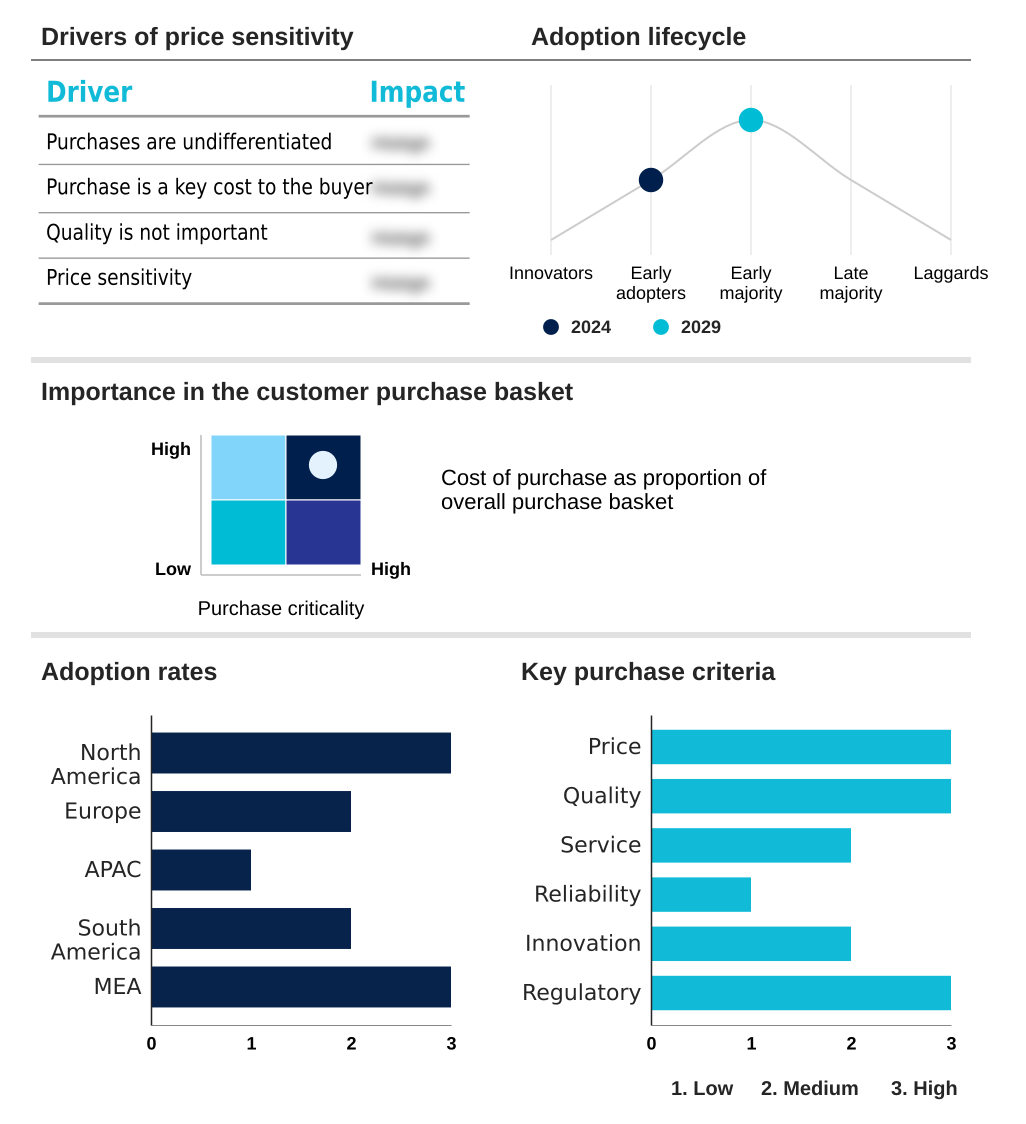
The ai avatars market forecasting report includes the adoption lifecycle of the market, covering from the innovator’s stage to the laggard’s stage. It focuses on adoption rates in different regions based on penetration. Furthermore, the ai avatars market report also includes key purchase criteria and drivers of price sensitivity to help companies evaluate and develop their market growth analysis strategies.
Customer Landscape of AI Avatars Industry
Competitive Landscape
Companies are implementing various strategies, such as strategic alliances, ai avatars market forecast, partnerships, mergers and acquisitions, geographical expansion, and product/service launches, to enhance their presence in the industry.
COPRESENCE AG - Offers realistic stock and custom avatars, enabling scalable, multilingual AI-driven video creation and training content for enterprise applications.
The industry research and growth report includes detailed analyses of the competitive landscape of the market and information about key companies, including:
- COPRESENCE AG
- DeepBrain AI Inc.
- DEEPMOTION INC.
- Didimo
- Epic Games Inc.
- GoAnimate Inc.
- HeyGen
- Hour One AI
- Inworld AI
- Meta Platforms Inc.
- Microsoft Corp.
- NVIDIA Corp.
- Ready Player Me
- Luka Inc.
- Soul Machines
- Synthesia Ltd.
- Tencent Holdings Ltd.
- VEED
Qualitative and quantitative analysis of companies has been conducted to help clients understand the wider business environment as well as the strengths and weaknesses of key industry players. Data is qualitatively analyzed to categorize companies as pure play, category-focused, industry-focused, and diversified; it is quantitatively analyzed to categorize companies as dominant, leading, strong, tentative, and weak.
Recent Development and News in Ai avatars market
- In August, 2024, the European Commission published finalized implementation guidelines for its AI Act, establishing stringent transparency and human oversight requirements for high-risk avatar systems used in public services and employment.
- In October, 2024, Zoom unveiled its AI Companion 2.0, including plans for personalized digital representations to enhance asynchronous communications in professional workflows.
- In February, 2025, Inworld AI announced a landmark partnership with a major game development studio to co-develop a flagship RPG title where all non-player characters are powered by its character engine for unscripted, dynamic conversations.
- In April, 2025, DeepBrain AI Inc. completed a Series D funding round of USD 150 million to expand its Avatar-as-a-Service (AaaS) platform, focusing on deploying emotionally intelligent AI agents for the financial services and healthcare sectors in North America and Europe.
Dive into Technavio’s robust research methodology, blending expert interviews, extensive data synthesis, and validated models for unparalleled AI Avatars Market insights. See full methodology.
| Market Scope | |
|---|---|
| Page number | 284 |
| Base year | 2024 |
| Historic period | 2019-2023 |
| Forecast period | 2025-2029 |
| Growth momentum & CAGR | Accelerate at a CAGR of 37.9% |
| Market growth 2025-2029 | USD 31492.5 million |
| Market structure | Fragmented |
| YoY growth 2024-2025(%) | 30.9% |
| Key countries | US, Canada, Mexico, Germany, UK, France, Italy, The Netherlands, Spain, China, Japan, India, Australia, South Korea, Indonesia, Brazil, Argentina, Colombia, Saudi Arabia, UAE, South Africa, Israel and Turkey |
| Competitive landscape | Leading Companies, Market Positioning of Companies, Competitive Strategies, and Industry Risks |
Research Analyst Overview
- The AI avatars market is shaped by the rapid convergence of generative adversarial networks, neural radiance fields, and advanced multimodal AI systems. This technological fusion creates a complex landscape where enterprises must make critical decisions regarding investment in proprietary development versus leveraging third-party platforms.
- The development of photorealistic 3D avatars with sophisticated character cognition is no longer a niche endeavor but a strategic imperative for companies in media, retail, and customer service. These emotionally intelligent AI agents are being designed to serve as virtual influencers and brand representatives.
- For boardroom consideration, the choice of platform directly impacts compliance with evolving regulations surrounding AI-generated digital replicas and deep synthesis technologies. Early adopters of integrated, multimodal avatar systems are reporting a 25% uplift in complex query resolution compared to text-only bots, demonstrating a clear performance benefit.
- This progress is compelling businesses to evaluate how AI digital humans and text-to-speech avatars fit into their long-term digital transformation strategies, balancing innovation with the high costs of ai-powered motion capture and neural rendering.
What are the Key Data Covered in this AI Avatars Market Research and Growth Report?
-
What is the expected growth of the AI Avatars Market between 2025 and 2029?
-
USD 31.49 billion, at a CAGR of 37.9%
-
-
What segmentation does the market report cover?
-
The report is segmented by Deployment (Cloud-based, and On-premises), Category (Digital human avatars, 3D and metaverse avatars, and Stylized avatars), Type (Interactive, and Non interactive) and Geography (North America, Europe, APAC, South America, Middle East and Africa)
-
-
Which regions are analyzed in the report?
-
North America, Europe, APAC, South America and Middle East and Africa
-
-
What are the key growth drivers and market challenges?
-
Pervasive advancements in generative AI and enabling technologies, Ethical ambiguity misuse potential and an uncertain regulatory landscape
-
-
Who are the major players in the AI Avatars Market?
-
COPRESENCE AG, DeepBrain AI Inc., DEEPMOTION INC., Didimo, Epic Games Inc., GoAnimate Inc., HeyGen, Hour One AI, Inworld AI, Meta Platforms Inc., Microsoft Corp., NVIDIA Corp., Ready Player Me, Luka Inc., Soul Machines, Synthesia Ltd., Tencent Holdings Ltd. and VEED
-
Market Research Insights
- Market dynamics are defined by a push for hyper-personalized digital interactions at scale. The adoption of AI-powered digital assistants and virtual stylists is reshaping customer engagement, with businesses reporting user interaction rates doubling those of static web interfaces.
- Concurrently, the development of a digital twin for virtual meetings is gaining traction in the corporate sector, promising to enhance productivity in remote work environments by up to 15%. This trend toward creating a persistent digital identity is balanced by the strategic need to ensure brand safety in avatars, as consumer trust is directly linked to transparency and ethical use.
- As technology evolves, the focus is shifting from mere automation to creating authentic, emotionally resonant connections through a variety of AI-driven personas.
We can help! Our analysts can customize this ai avatars market research report to meet your requirements.
 RIA -
RIA - 
