Digital Human Avatar Market Analysis, Size, and Forecast 2026-2030: North America (US, Canada, and Mexico), Europe (Germany, UK, and France), APAC (China, Japan, and India), South America (Brazil and Argentina), Middle East and Africa (Saudi Arabia, UAE, and South Africa), and Rest of World (ROW)

Digital Human Avatar Market Analysis, Size, and Forecast 2026-2030:
North America (US, Canada, and Mexico), Europe (Germany, UK, and France), APAC (China, Japan, and India), South America (Brazil and Argentina), Middle East and Africa (Saudi Arabia, UAE, and South Africa), and Rest of World (ROW)

Published: May 2026 326 Pages SKU: IRTNTR80653

Market Overview at a Glance

$37.15 B
Market Opportunity
43%
CAGR 2025 - 2030
40.5%
North America Growth
$3.30 B
Virtual assistants segment 2024

Digital Human Avatar Market Size 2026-2030

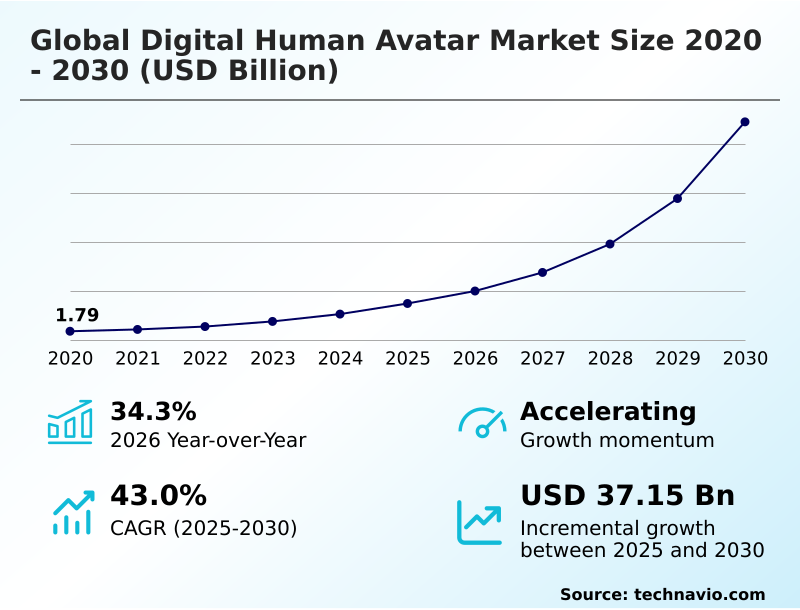
The Digital Human Avatar Market size was valued at USD 7.47 billion in 2025, growing at a CAGR of 43% during the forecast period 2026-2030.

Major Market Trends & Insights

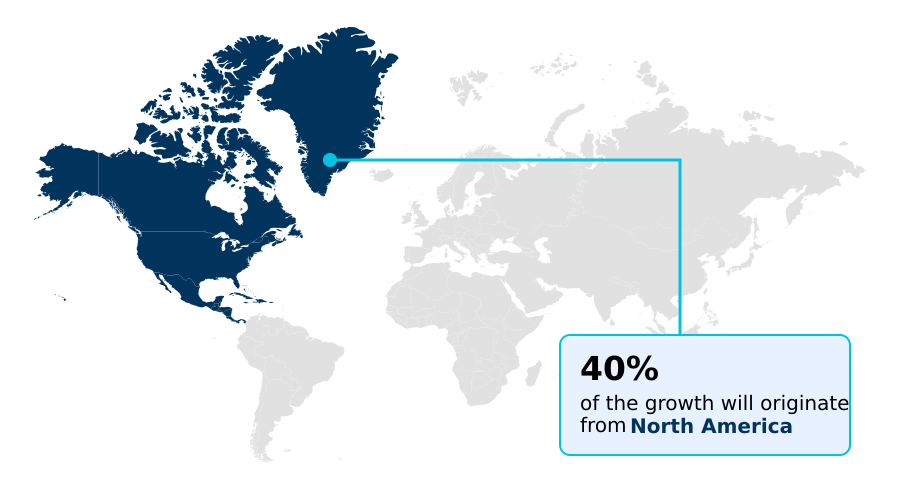
  • North America dominated the market and accounted for a 40.5% growth during the forecast period.
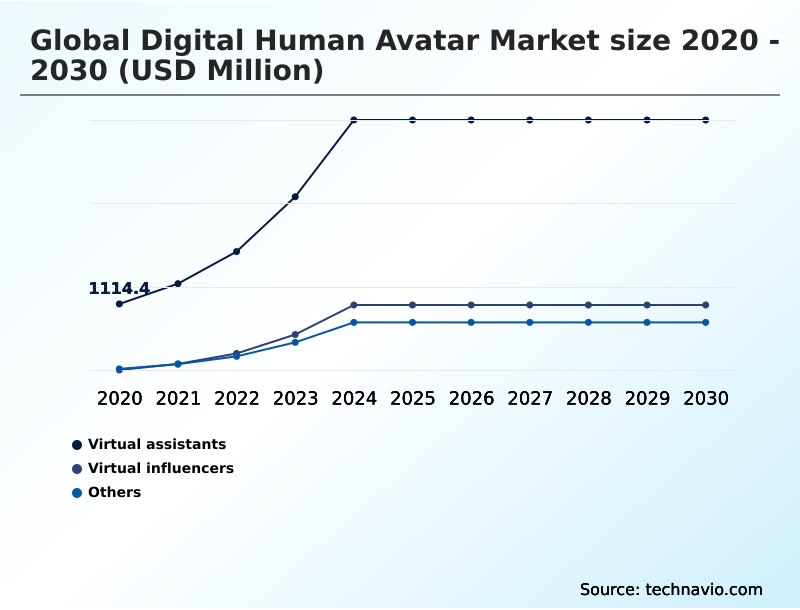
  • By Product - Virtual assistants segment was valued at USD 3.30 billion in 2024
  • By Technology - AI-based segment accounted for the largest market revenue share in 2024

Market Size & Forecast

  • Historic Market Opportunities 2020-2024: USD 42.83 billion
  • Market Future Opportunities 2025-2030: USD 37.15 billion
  • CAGR from 2025 to 2030 : 43%

Market Summary

  • The digital human avatar market is expanding rapidly, with AI-based technology accounting for over 55% of the market, a figure more than double that of 3D modeling and animation.
  • This growth is driven by the corporate need for hyper-personalized consumer engagement, as these avatars can handle massive inquiry volumes with 24/7 availability, significantly improving customer satisfaction scores compared to traditional chatbots. For instance, in a retail environment, a digital concierge leverages natural language processing and real-time rendering to create a human-like presence, building brand loyalty.
  • However, this advancement is not without challenges. The high computational complexity required for photorealistic rendering introduces latency, which can degrade the user experience and represents a major technical barrier.
  • This high processing demand also leads to substantial energy consumption, posing a challenge for companies with sustainability goals, where energy usage can be up to 40% higher than for standard cloud services.

What will be the Size of the Digital Human Avatar Market during the forecast period?

Get Key Insights on Market Forecast (PDF) Request Free Sample

How is the Digital Human Avatar Market Segmented?

The digital human avatar industry research report provides comprehensive data (region-wise segment analysis), with forecasts and analysis for the period 2026-2030, as well as historical data from 2020-2024 for the following segments.

  • Product
    • Virtual assistants
    • Virtual influencers
    • Others
  • Technology
    • AI-based
    • 3D modeling and animation
    • Motion capture
    • Emotion recognition
  • Type
    • Text-based
    • Voice-based
    • Gesture-based
  • Application
    • Customer service
    • Entertainment and media
    • Healthcare
    • Education and training
    • Others
  • Geography
    • North America
      • US
      • Canada
      • Mexico
    • Europe
      • Germany
      • UK
      • France
    • APAC
      • China
      • Japan
      • India
    • South America
      • Brazil
      • Argentina
    • Middle East and Africa
      • Saudi Arabia
      • UAE
      • South Africa
    • Rest of World (ROW)

How is the Digital Human Avatar Market Segmented by Product?

The virtual assistants segment is estimated to witness significant growth during the forecast period.

The digital human avatar market segmentation reveals distinct performance metrics across its categories.

Virtual assistants, comprising over 63% of the product segment, focus on scalable customer interactions, while the smaller but fast-growing virtual influencers segment is driven by social commerce and brand engagement.

The technology segmentation is led by AI-based solutions, which account for more than 55% of the market due to their ability to power autonomous task execution and conversational AI.

This is a significant lead over 3D modeling and animation, which holds about 25% of the technology share. Applications in customer service are the largest, followed by entertainment and media, reflecting the dual enterprise and consumer focus.

This structure highlights a market where AI-based virtual assistants for customer service represent the core, with significant growth potential in specialized areas like virtual influencers and healthcare training.

Request Free Sample

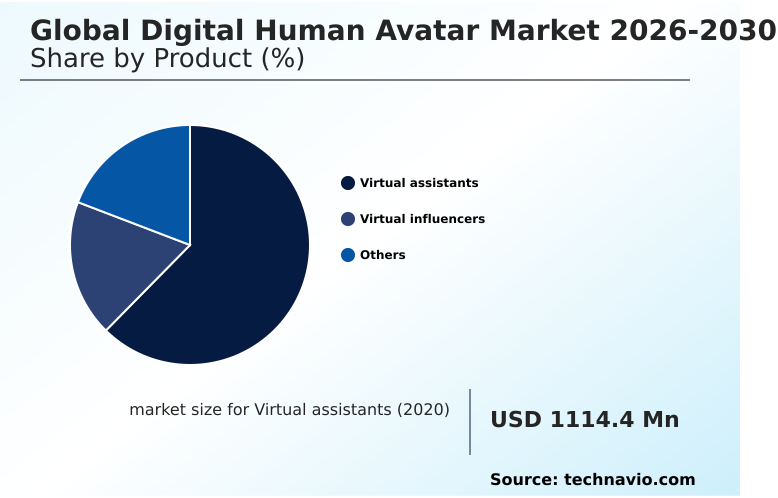
The Virtual assistants segment was valued at USD 3.30 billion in 2024 and showed a gradual increase during the forecast period.

Request Free Sample

How demand for the Digital Human Avatar market is rising in the leading region?

North America is estimated to contribute 40.5% to the growth of the global market during the forecast period.Technavio’s analysts have elaborately explained the regional trends and drivers that shape the market during the forecast period.

See How Digital Human Avatar Market demand is rising in North America Request Free Sample

The geographic landscape of the digital human avatar market is led by North America, which accounts for over 40% of the incremental growth, a lead of nearly 15% over Europe.

This dominance is driven by the United States, where a high concentration of technology providers and venture capital fuels early adoption in financial services and entertainment.

In contrast, the APAC region, projected to be the fastest-growing market, shows a different adoption pattern, with virtual influencers and social commerce applications in China and South Korea driving expansion.

The European market emphasizes ethical AI and data privacy, with regulations like GDPR influencing the development of secure digital identity and agentic AI systems.

South America and the Middle East and Africa are emerging markets, primarily adopting digital human avatars for customer service in retail and telecommunications to improve human-centric automation.

What are the key Drivers, Trends, and Challenges in the Digital Human Avatar Market?

Our researchers analyzed the data with 2025 as the base year, along with the key drivers, trends, and challenges. A holistic analysis of drivers will help companies refine their marketing strategies to gain a competitive advantage.

  • Enterprises are increasingly seeking to understand how a digital human for healthcare training can improve clinical skill development, with simulations showing a 30% increase in diagnostic accuracy compared to traditional methods.
  • The process to create a photorealistic virtual influencer is also becoming streamlined, as brands look to leverage these assets for marketing, where they can achieve engagement rates up to three times higher than human influencers. A key technical consideration is the development of real-time avatar rendering solutions that minimize latency for seamless interaction.
  • This is particularly crucial for applications that require an AI avatar for customer service, where response times directly impact user satisfaction. Furthermore, the use of generative AI for character animation is revolutionizing workflows, enabling the creation of lifelike movements and expressions with significantly less manual effort.
  • This technology allows for the creation of digital workers and sophisticated agentic AI systems capable of unscripted conversations, redefining how businesses approach automation and consumer engagement. The integration of emotional AI and affective computing further enhances these interactions, making them more natural and effective across various platforms.

What are the key market drivers leading to the rise in the adoption of Digital Human Avatar Industry?

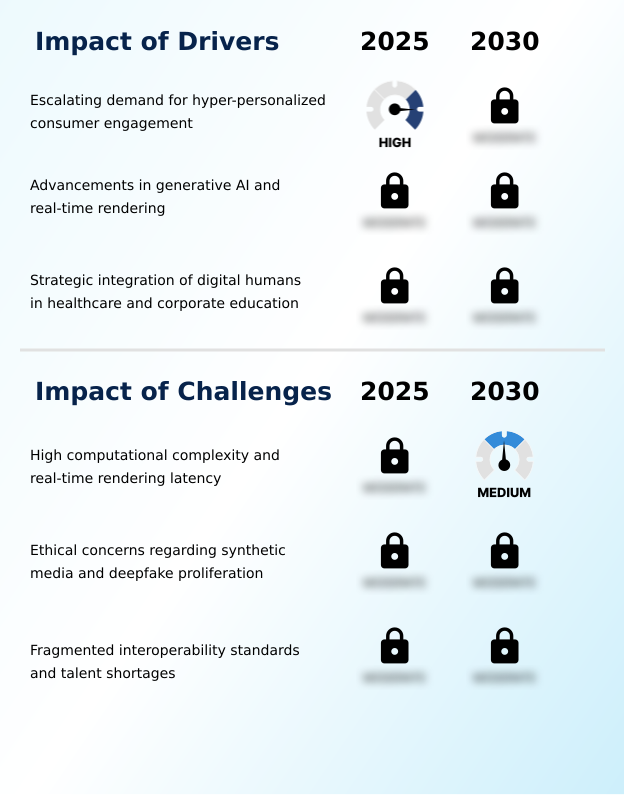
  • The escalating demand for hyper-personalized consumer engagement is a key driver fueling the adoption of digital human avatars across various industries.

  • The escalating corporate demand for hyper-personalized consumer engagement is the primary driver for the digital human avatar market, with enterprises reporting a 30% increase in customer satisfaction after implementation.
  • These AI-driven avatars provide a relatable, empathetic interface for automated services, which is critical for building brand loyalty. Advancements in generative AI and real-time rendering have democratized the creation of photorealistic entities, reducing development costs by up to 60%.
  • This technological accessibility allows for strategic integration in sectors like healthcare, where virtual health coaches offer scalable support, and corporate education, where digital tutors enhance information retention through interactive, personalized learning modules.

What are the market trends shaping the Digital Human Avatar Industry?

  • A primary trend is the market's transition toward agentic AI. This evolution enables digital human avatars to perform autonomous task execution beyond simple, scripted responses.

  • A pivotal trend in the digital human avatar market is the evolution from scripted chatbots to proactive agentic AI systems, now accounting for a 40% increase in autonomous task completion within financial services. These advanced avatars leverage large language models to execute complex workflows, such as managing insurance claims, which reduces operational overhead by over 25% compared to manual processing.
  • This transition is further accelerated by the rise of virtual influencers in social commerce, where hyper-realistic digital personas drive consumer engagement. The integration of emotional AI and multimodal sentiment analysis is also becoming standard, allowing digital tutors and virtual health coaches to provide more empathetic and effective support by recognizing non-verbal cues from users.

What challenges does the Digital Human Avatar Industry face during its growth?

  • High computational complexity and the challenge of achieving low-latency real-time rendering present significant technical hurdles to the market's growth.

  • A significant challenge confronting the digital human avatar market is the high computational complexity, which increases infrastructure costs by an estimated 45% compared to standard cloud applications. Achieving low-latency, real-time rendering for photorealistic avatars remains a technical bottleneck, particularly on mobile devices.
  • Ethical concerns surrounding synthetic media and deepfake proliferation also pose a major hurdle, with new regulations mandating strict compliance measures that can increase development timelines by 20%.
  • Furthermore, the market is constrained by a lack of interoperability standards, leading to vendor lock-in, and a global shortage of specialized talent with expertise in affective computing and AI orchestration, which drives up project costs.

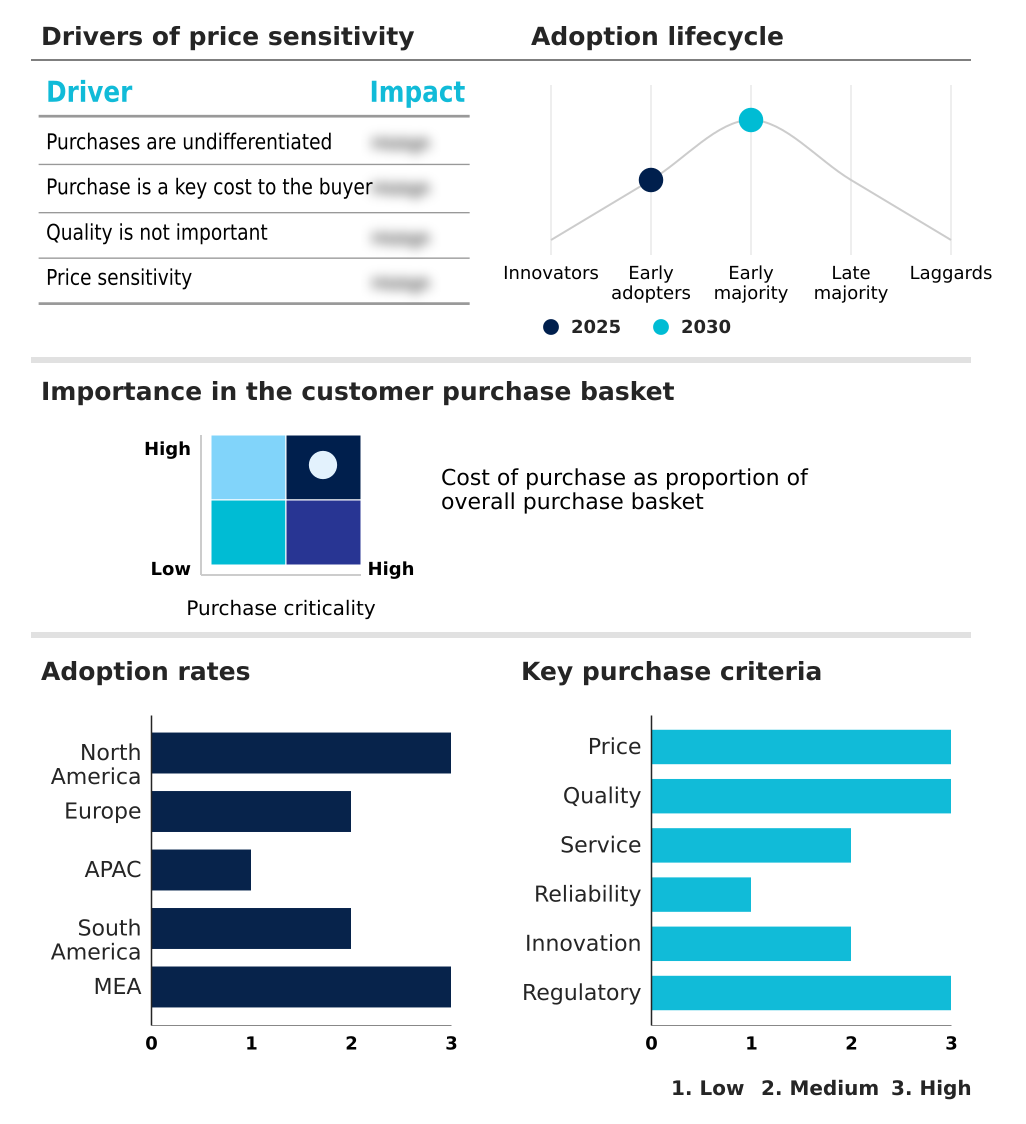
Exclusive Technavio Analysis on Customer Landscape

The digital human avatar market forecasting report includes the adoption lifecycle of the market, covering from the innovator’s stage to the laggard’s stage. It focuses on adoption rates in different regions based on penetration. Furthermore, the digital human avatar market report also includes key purchase criteria and drivers of price sensitivity to help companies evaluate and develop their market growth analysis strategies.

Customer Landscape of Digital Human Avatar Industry

Competitive Landscape

Companies are implementing various strategies, such as strategic alliances, digital human avatar market forecast, partnerships, mergers and acquisitions, geographical expansion, and product/service launches, to enhance their presence in the industry.

Alibaba Cloud - Key offerings include AI-powered digital humans, virtual assistants, and character creation platforms for enterprise, entertainment, and metaverse applications.

The industry research and growth report includes detailed analyses of the competitive landscape of the market and information about key companies, including:

  • Alibaba Cloud
  • Aww Inc.
  • Baidu Inc.
  • ByteDance Ltd.
  • Deepbrain AI
  • Didimo
  • Epic Games Inc.
  • Genies Inc.
  • Hour One AI
  • Meta Platforms Inc.
  • Microsoft Corp.
  • NVIDIA Corp.
  • Pinscreen
  • Ready Player Me
  • Reallusion Inc.
  • Soul Machines
  • Synthesia Ltd.
  • Tencent Holdings Ltd.
  • UneeQ
  • Unity Technologies Inc.

Qualitative and quantitative analysis of companies has been conducted to help clients understand the wider business environment as well as the strengths and weaknesses of key industry players. Data is qualitatively analyzed to categorize companies as pure play, category-focused, industry-focused, and diversified; it is quantitatively analyzed to categorize companies as dominant, leading, strong, tentative, and weak.

Market Intelligence Radar: High-Impact Developments & Growth Signals

  • In the IT Consulting and Other Services industry, increasing enterprise investments in upgrading legacy IT infrastructure to support advanced applications are driving demand for digital human avatars. These upgrades, often guided by IT consulting firms, create a foundation for deploying resource-intensive AI-driven avatars and immersive engagement platforms that require robust computing and network capabilities.
  • The widespread adoption of Agile and DevOps methodologies within the IT Consulting and Other Services industry has streamlined the development and deployment of digital human avatars. This approach, which emphasizes iterative development and cross-functional collaboration, allows for faster integration of agentic AI systems and emotionally intelligent avatars into enterprise workflows, reducing time-to-market for new interactive services.
  • In the IT Consulting and Other Services industry, a growing reliance on cloud computing services to handle massive data processing and storage requirements is enabling the scalability of digital human avatar platforms. Cloud infrastructure provides the necessary backbone for real-time rendering and large language model processing, making high-fidelity, interactive digital workers accessible to a broader range of businesses without prohibitive on-premise hardware costs.
  • Heightened focus on data privacy and cybersecurity within the IT Consulting and Other Services industry, driven by regulations like GDPR, is shaping the development of digital human avatars. This necessitates the integration of robust security protocols, provenance metadata, and ethical AI frameworks to mitigate risks associated with synthetic media and deepfake technology, ensuring user trust and regulatory compliance for enterprise deployments.

Dive into Technavio’s robust research methodology, blending expert interviews, extensive data synthesis, and validated models for unparalleled Digital Human Avatar Market insights. See full methodology.

Market Scope
Page number 326
Base year 2025
Historic period 2020-2024
Forecast period 2026-2030
Growth momentum & CAGR Accelerate at a CAGR of 43%
Market growth 2026-2030 USD 37154.0 million
Market structure Fragmented
YoY growth 2025-2026(%) 34.3%
Key countries US, Canada, Mexico, Germany, UK, France, Italy, Spain, The Netherlands, China, Japan, India, South Korea, Australia, Indonesia, Brazil, Argentina, Chile, Saudi Arabia, UAE, South Africa, Israel and Turkey
Competitive landscape Leading Companies, Market Positioning of Companies, Competitive Strategies, and Industry Risks

Request Free Sample

Research Analyst Overview

  • The digital human avatar market ecosystem is a complex interplay of specialized technology providers and large-scale cloud platforms, where over 60% of innovation is driven by advancements in generative AI and real-time rendering engines. At the base, semiconductor firms supply the GPUs essential for high-fidelity rendering, while cloud providers offer the scalable infrastructure for AI model processing.
  • Solution providers build upon this foundation to create emotionally intelligent avatars for specific verticals like healthcare and finance. The distribution of these solutions often occurs through direct enterprise sales or integration into broader software platforms, reaching end-users in customer service, education, and entertainment. Regulatory bodies are increasingly influential, with data privacy laws shaping the development of secure digital identity frameworks.
  • The entire value chain is supported by a growing talent pool of 3D artists and AI developers, whose scarcity presents a significant operational bottleneck.

What are the Key Data Covered in this Digital Human Avatar Market Research and Growth Report?

  • What is the expected growth of the Digital Human Avatar Market between 2026 and 2030?

    • The Digital Human Avatar Market is expected to grow by USD 37.15 billion during 2026-2030, registering a CAGR of 43%. Year-over-year growth in 2026 is estimated at 34.3%%. This acceleration is shaped by escalating demand for hyper-personalized consumer engagement, which is intensifying demand across multiple end-use verticals covered in the report.

  • What segmentation does the market report cover?

    • The report is segmented by Product (Virtual assistants, Virtual influencers, and Others), Technology (AI-based, 3D modeling and animation, Motion capture, and Emotion recognition), Type (Text-based, Voice-based, and Gesture-based), Application (Customer service, Entertainment and media, Healthcare, Education and training, and Others) and Geography (North America, Europe, APAC, South America, Middle East and Africa). Among these, the Virtual assistants segment is estimated to witness significant growth during the forecast period, driven by rising adoption across key application areas. Each segment includes detailed qualitative and quantitative analysis, along with historical data from 2020-2024 and forecasts through 2030 with year-over-year growth rates.

  • Which regions are analyzed in the report?

    • The report covers North America, Europe, APAC, South America and Middle East and Africa. North America is estimated to contribute 40.5% to market growth during the forecast period. Country-level analysis includes US, Canada, Mexico, Germany, UK, France, Italy, Spain, The Netherlands, China, Japan, India, South Korea, Australia, Indonesia, Brazil, Argentina, Chile, Saudi Arabia, UAE, South Africa, Israel and Turkey, with dedicated market size tables and year-over-year growth for each.

  • What are the key growth drivers and market challenges?

    • The primary driver is escalating demand for hyper-personalized consumer engagement, which is accelerating investment and industry demand. The main challenge is high computational complexity and real-time rendering latency, creating operational barriers for key market participants. The report quantifies the impact of each driver and challenge across 2026 and 2030 with comparative analysis.

  • Who are the major players in the Digital Human Avatar Market?

    • Key vendors include Alibaba Cloud, Aww Inc., Baidu Inc., ByteDance Ltd., Deepbrain AI, Didimo, Epic Games Inc., Genies Inc., Hour One AI, Meta Platforms Inc., Microsoft Corp., NVIDIA Corp., Pinscreen, Ready Player Me, Reallusion Inc., Soul Machines, Synthesia Ltd., Tencent Holdings Ltd., UneeQ and Unity Technologies Inc.. The report provides qualitative and quantitative analysis categorizing companies as dominant, leading, strong, tentative, and weak based on their market positioning. Company profiles include business segment analysis, SWOT assessment, key offerings, and recent strategic developments.

Market Research Insights

  • The competitive landscape of the digital human avatar market is intensely active, with the top 5 technology conglomerates investing over 70% of the total R&D funding in this space. Key players like NVIDIA Corp. and Microsoft Corp. are enhancing their foundational platforms, such as Omniverse and Azure, to support high-fidelity, real-time conversational AI. Specialized firms like Deepbrain AI and Synthesia Ltd.
  • are focusing on enterprise applications, offering AI-driven video creation and virtual presenters that reduce corporate training video production costs by up to 50%. These developments are a direct response to the enterprise demand for scalable, emotionally resonant communication tools.
  • However, the market faces a significant challenge from fragmented interoperability standards, which complicates the use of a single digital identity across platforms from different vendors like Epic Games Inc. and Unity Technologies Inc.

We can help! Our analysts can customize this digital human avatar market research report to meet your requirements.

Get in touch

1. Executive Summary

1.1 Market overview

Executive Summary - Chart on Market Overview
Executive Summary - Data Table on Market Overview
Executive Summary - Chart on Global Market Characteristics
Executive Summary - Chart on Market by Geography
Executive Summary - Chart on Market Segmentation by Product
Executive Summary - Chart on Market Segmentation by Technology
Executive Summary - Chart on Market Segmentation by Type
Executive Summary - Chart on Market Segmentation by Application
Executive Summary - Chart on Incremental Growth
Executive Summary - Data Table on Incremental Growth
Executive Summary - Chart on Company Market Positioning

2. Technavio Analysis

2.1 Analysis of price sensitivity, lifecycle, customer purchase basket, adoption rates, and purchase criteria

2.2 Criticality of inputs and Factors of differentiation

Chart on Overview on criticality of inputs and factors of differentiation

2.3 Factors of disruption

Chart on Overview on factors of disruption

2.4 Impact of drivers and challenges

Chart on Impact of drivers and challenges in 2025 and 2030

3. Market Landscape

3.1 Market ecosystem

Chart on Parent Market
Data Table on - Parent Market

3.2 Market characteristics

Chart on Market characteristics analysis

3.3 Value chain analysis

Chart on Value chain analysis

4. Market Sizing

4.1 Market definition

Data Table on Offerings of companies included in the market definition

4.2 Market segment analysis

Market segments

4.3 Market size 2025

4.4 Market outlook: Forecast for 2025-2030

Chart on Global - Market size and forecast 2025-2030 ($ million)
Data Table on Global - Market size and forecast 2025-2030 ($ million)
Chart on Global Market: Year-over-year growth 2025-2030 (%)
Data Table on Global Market: Year-over-year growth 2025-2030 (%)

5. Historic Market Size

5.1 Global Digital Human Avatar Market 2020 - 2024

Historic Market Size - Data Table on Global Digital Human Avatar Market 2020 - 2024 ($ million)

5.2 Product segment analysis 2020 - 2024

Historic Market Size - Product Segment 2020 - 2024 ($ million)

5.3 Technology segment analysis 2020 - 2024

Historic Market Size - Technology Segment 2020 - 2024 ($ million)

5.4 Type segment analysis 2020 - 2024

Historic Market Size - Type Segment 2020 - 2024 ($ million)

5.5 Application segment analysis 2020 - 2024

Historic Market Size - Application Segment 2020 - 2024 ($ million)

5.6 Geography segment analysis 2020 - 2024

Historic Market Size - Geography Segment 2020 - 2024 ($ million)

5.7 Country segment analysis 2020 - 2024

Historic Market Size - Country Segment 2020 - 2024 ($ million)

6. Qualitative Analysis

6.1 Impact of AI in Global Digital Human Avatar Market

6.2 Impact of Geopolitical Conflict for Global Digital Human Avatar Market

7. Five Forces Analysis

7.1 Five forces summary

Five forces analysis - Comparison between 2025 and 2030

7.2 Bargaining power of buyers

Bargaining power of buyers - Impact of key factors 2025 and 2030

7.3 Bargaining power of suppliers

Bargaining power of suppliers - Impact of key factors in 2025 and 2030

7.4 Threat of new entrants

Threat of new entrants - Impact of key factors in 2025 and 2030

7.5 Threat of substitutes

Threat of substitutes - Impact of key factors in 2025 and 2030

7.6 Threat of rivalry

Threat of rivalry - Impact of key factors in 2025 and 2030

7.7 Market condition

Chart on Market condition - Five forces 2025 and 2030

8. Market Segmentation by Product

8.1 Market segments

Chart on Product - Market share 2025-2030 (%)
Data Table on Product - Market share 2025-2030 (%)

8.2 Comparison by Product

Chart on Comparison by Product
Data Table on Comparison by Product

8.3 Virtual assistants - Market size and forecast 2025-2030

Chart on Virtual assistants - Market size and forecast 2025-2030 ($ million)
Data Table on Virtual assistants - Market size and forecast 2025-2030 ($ million)
Chart on Virtual assistants - Year-over-year growth 2025-2030 (%)
Data Table on Virtual assistants - Year-over-year growth 2025-2030 (%)

8.4 Virtual influencers - Market size and forecast 2025-2030

Chart on Virtual influencers - Market size and forecast 2025-2030 ($ million)
Data Table on Virtual influencers - Market size and forecast 2025-2030 ($ million)
Chart on Virtual influencers - Year-over-year growth 2025-2030 (%)
Data Table on Virtual influencers - Year-over-year growth 2025-2030 (%)

8.5 Others - Market size and forecast 2025-2030

Chart on Others - Market size and forecast 2025-2030 ($ million)
Data Table on Others - Market size and forecast 2025-2030 ($ million)
Chart on Others - Year-over-year growth 2025-2030 (%)
Data Table on Others - Year-over-year growth 2025-2030 (%)

8.6 Market opportunity by Product

Market opportunity by Product ($ million)
Data Table on Market opportunity by Product ($ million)

9. Market Segmentation by Technology

9.1 Market segments

Chart on Technology - Market share 2025-2030 (%)
Data Table on Technology - Market share 2025-2030 (%)

9.2 Comparison by Technology

Chart on Comparison by Technology
Data Table on Comparison by Technology

9.3 AI-based - Market size and forecast 2025-2030

Chart on AI-based - Market size and forecast 2025-2030 ($ million)
Data Table on AI-based - Market size and forecast 2025-2030 ($ million)
Chart on AI-based - Year-over-year growth 2025-2030 (%)
Data Table on AI-based - Year-over-year growth 2025-2030 (%)

9.4 3D modeling and animation - Market size and forecast 2025-2030

Chart on 3D modeling and animation - Market size and forecast 2025-2030 ($ million)
Data Table on 3D modeling and animation - Market size and forecast 2025-2030 ($ million)
Chart on 3D modeling and animation - Year-over-year growth 2025-2030 (%)
Data Table on 3D modeling and animation - Year-over-year growth 2025-2030 (%)

9.5 Motion capture - Market size and forecast 2025-2030

Chart on Motion capture - Market size and forecast 2025-2030 ($ million)
Data Table on Motion capture - Market size and forecast 2025-2030 ($ million)
Chart on Motion capture - Year-over-year growth 2025-2030 (%)
Data Table on Motion capture - Year-over-year growth 2025-2030 (%)

9.6 Emotion recognition - Market size and forecast 2025-2030

Chart on Emotion recognition - Market size and forecast 2025-2030 ($ million)
Data Table on Emotion recognition - Market size and forecast 2025-2030 ($ million)
Chart on Emotion recognition - Year-over-year growth 2025-2030 (%)
Data Table on Emotion recognition - Year-over-year growth 2025-2030 (%)

9.7 Market opportunity by Technology

Market opportunity by Technology ($ million)
Data Table on Market opportunity by Technology ($ million)

10. Market Segmentation by Type

10.1 Market segments

Chart on Type - Market share 2025-2030 (%)
Data Table on Type - Market share 2025-2030 (%)

10.2 Comparison by Type

Chart on Comparison by Type
Data Table on Comparison by Type

10.3 Text-based - Market size and forecast 2025-2030

Chart on Text-based - Market size and forecast 2025-2030 ($ million)
Data Table on Text-based - Market size and forecast 2025-2030 ($ million)
Chart on Text-based - Year-over-year growth 2025-2030 (%)
Data Table on Text-based - Year-over-year growth 2025-2030 (%)

10.4 Voice-based - Market size and forecast 2025-2030

Chart on Voice-based - Market size and forecast 2025-2030 ($ million)
Data Table on Voice-based - Market size and forecast 2025-2030 ($ million)
Chart on Voice-based - Year-over-year growth 2025-2030 (%)
Data Table on Voice-based - Year-over-year growth 2025-2030 (%)

10.5 Gesture-based - Market size and forecast 2025-2030

Chart on Gesture-based - Market size and forecast 2025-2030 ($ million)
Data Table on Gesture-based - Market size and forecast 2025-2030 ($ million)
Chart on Gesture-based - Year-over-year growth 2025-2030 (%)
Data Table on Gesture-based - Year-over-year growth 2025-2030 (%)

10.6 Market opportunity by Type

Market opportunity by Type ($ million)
Data Table on Market opportunity by Type ($ million)

11. Market Segmentation by Application

11.1 Market segments

Chart on Application - Market share 2025-2030 (%)
Data Table on Application - Market share 2025-2030 (%)

11.2 Comparison by Application

Chart on Comparison by Application
Data Table on Comparison by Application

11.3 Customer service - Market size and forecast 2025-2030

Chart on Customer service - Market size and forecast 2025-2030 ($ million)
Data Table on Customer service - Market size and forecast 2025-2030 ($ million)
Chart on Customer service - Year-over-year growth 2025-2030 (%)
Data Table on Customer service - Year-over-year growth 2025-2030 (%)

11.4 Entertainment and media - Market size and forecast 2025-2030

Chart on Entertainment and media - Market size and forecast 2025-2030 ($ million)
Data Table on Entertainment and media - Market size and forecast 2025-2030 ($ million)
Chart on Entertainment and media - Year-over-year growth 2025-2030 (%)
Data Table on Entertainment and media - Year-over-year growth 2025-2030 (%)

11.5 Healthcare - Market size and forecast 2025-2030

Chart on Healthcare - Market size and forecast 2025-2030 ($ million)
Data Table on Healthcare - Market size and forecast 2025-2030 ($ million)
Chart on Healthcare - Year-over-year growth 2025-2030 (%)
Data Table on Healthcare - Year-over-year growth 2025-2030 (%)

11.6 Education and training - Market size and forecast 2025-2030

Chart on Education and training - Market size and forecast 2025-2030 ($ million)
Data Table on Education and training - Market size and forecast 2025-2030 ($ million)
Chart on Education and training - Year-over-year growth 2025-2030 (%)
Data Table on Education and training - Year-over-year growth 2025-2030 (%)

11.7 Others - Market size and forecast 2025-2030

Chart on Others - Market size and forecast 2025-2030 ($ million)
Data Table on Others - Market size and forecast 2025-2030 ($ million)
Chart on Others - Year-over-year growth 2025-2030 (%)
Data Table on Others - Year-over-year growth 2025-2030 (%)

11.8 Market opportunity by Application

Market opportunity by Application ($ million)
Data Table on Market opportunity by Application ($ million)

12. Customer Landscape

12.1 Customer landscape overview

Analysis of price sensitivity, lifecycle, customer purchase basket, adoption rates, and purchase criteria

13. Geographic Landscape

13.1 Geographic segmentation

Chart on Market share by geography 2025-2030 (%)
Data Table on Market share by geography 2025-2030 (%)

13.2 Geographic comparison

Chart on Geographic comparison
Data Table on Geographic comparison

13.3 North America - Market size and forecast 2025-2030

Chart on North America - Market size and forecast 2025-2030 ($ million)
Data Table on North America - Market size and forecast 2025-2030 ($ million)
Chart on North America - Year-over-year growth 2025-2030 (%)
Data Table on North America - Year-over-year growth 2025-2030 (%)
Chart on Regional Comparison - North America
Data Table on Regional Comparison - North America

13.3.1 US - Market size and forecast 2025-2030

Chart on US - Market size and forecast 2025-2030 ($ million)
Data Table on US - Market size and forecast 2025-2030 ($ million)
Chart on US - Year-over-year growth 2025-2030 (%)
Data Table on US - Year-over-year growth 2025-2030 (%)

13.3.2 Canada - Market size and forecast 2025-2030

Chart on Canada - Market size and forecast 2025-2030 ($ million)
Data Table on Canada - Market size and forecast 2025-2030 ($ million)
Chart on Canada - Year-over-year growth 2025-2030 (%)
Data Table on Canada - Year-over-year growth 2025-2030 (%)

13.3.3 Mexico - Market size and forecast 2025-2030

Chart on Mexico - Market size and forecast 2025-2030 ($ million)
Data Table on Mexico - Market size and forecast 2025-2030 ($ million)
Chart on Mexico - Year-over-year growth 2025-2030 (%)
Data Table on Mexico - Year-over-year growth 2025-2030 (%)

13.4 Europe - Market size and forecast 2025-2030

Chart on Europe - Market size and forecast 2025-2030 ($ million)
Data Table on Europe - Market size and forecast 2025-2030 ($ million)
Chart on Europe - Year-over-year growth 2025-2030 (%)
Data Table on Europe - Year-over-year growth 2025-2030 (%)
Chart on Regional Comparison - Europe
Data Table on Regional Comparison - Europe

13.4.1 Germany - Market size and forecast 2025-2030

Chart on Germany - Market size and forecast 2025-2030 ($ million)
Data Table on Germany - Market size and forecast 2025-2030 ($ million)
Chart on Germany - Year-over-year growth 2025-2030 (%)
Data Table on Germany - Year-over-year growth 2025-2030 (%)

13.4.2 UK - Market size and forecast 2025-2030

Chart on UK - Market size and forecast 2025-2030 ($ million)
Data Table on UK - Market size and forecast 2025-2030 ($ million)
Chart on UK - Year-over-year growth 2025-2030 (%)
Data Table on UK - Year-over-year growth 2025-2030 (%)

13.4.3 France - Market size and forecast 2025-2030

Chart on France - Market size and forecast 2025-2030 ($ million)
Data Table on France - Market size and forecast 2025-2030 ($ million)
Chart on France - Year-over-year growth 2025-2030 (%)
Data Table on France - Year-over-year growth 2025-2030 (%)

13.4.4 Italy - Market size and forecast 2025-2030

Chart on Italy - Market size and forecast 2025-2030 ($ million)
Data Table on Italy - Market size and forecast 2025-2030 ($ million)
Chart on Italy - Year-over-year growth 2025-2030 (%)
Data Table on Italy - Year-over-year growth 2025-2030 (%)

13.4.5 Spain - Market size and forecast 2025-2030

Chart on Spain - Market size and forecast 2025-2030 ($ million)
Data Table on Spain - Market size and forecast 2025-2030 ($ million)
Chart on Spain - Year-over-year growth 2025-2030 (%)
Data Table on Spain - Year-over-year growth 2025-2030 (%)

13.4.6 The Netherlands - Market size and forecast 2025-2030

Chart on The Netherlands - Market size and forecast 2025-2030 ($ million)
Data Table on The Netherlands - Market size and forecast 2025-2030 ($ million)
Chart on The Netherlands - Year-over-year growth 2025-2030 (%)
Data Table on The Netherlands - Year-over-year growth 2025-2030 (%)

13.5 APAC - Market size and forecast 2025-2030

Chart on APAC - Market size and forecast 2025-2030 ($ million)
Data Table on APAC - Market size and forecast 2025-2030 ($ million)
Chart on APAC - Year-over-year growth 2025-2030 (%)
Data Table on APAC - Year-over-year growth 2025-2030 (%)
Chart on Regional Comparison - APAC
Data Table on Regional Comparison - APAC

13.5.1 China - Market size and forecast 2025-2030

Chart on China - Market size and forecast 2025-2030 ($ million)
Data Table on China - Market size and forecast 2025-2030 ($ million)
Chart on China - Year-over-year growth 2025-2030 (%)
Data Table on China - Year-over-year growth 2025-2030 (%)

13.5.2 Japan - Market size and forecast 2025-2030

Chart on Japan - Market size and forecast 2025-2030 ($ million)
Data Table on Japan - Market size and forecast 2025-2030 ($ million)
Chart on Japan - Year-over-year growth 2025-2030 (%)
Data Table on Japan - Year-over-year growth 2025-2030 (%)

13.5.3 India - Market size and forecast 2025-2030

Chart on India - Market size and forecast 2025-2030 ($ million)
Data Table on India - Market size and forecast 2025-2030 ($ million)
Chart on India - Year-over-year growth 2025-2030 (%)
Data Table on India - Year-over-year growth 2025-2030 (%)

13.5.4 South Korea - Market size and forecast 2025-2030

Chart on South Korea - Market size and forecast 2025-2030 ($ million)
Data Table on South Korea - Market size and forecast 2025-2030 ($ million)
Chart on South Korea - Year-over-year growth 2025-2030 (%)
Data Table on South Korea - Year-over-year growth 2025-2030 (%)

13.5.5 Australia - Market size and forecast 2025-2030

Chart on Australia - Market size and forecast 2025-2030 ($ million)
Data Table on Australia - Market size and forecast 2025-2030 ($ million)
Chart on Australia - Year-over-year growth 2025-2030 (%)
Data Table on Australia - Year-over-year growth 2025-2030 (%)

13.5.6 Indonesia - Market size and forecast 2025-2030

Chart on Indonesia - Market size and forecast 2025-2030 ($ million)
Data Table on Indonesia - Market size and forecast 2025-2030 ($ million)
Chart on Indonesia - Year-over-year growth 2025-2030 (%)
Data Table on Indonesia - Year-over-year growth 2025-2030 (%)

13.6 South America - Market size and forecast 2025-2030

Chart on South America - Market size and forecast 2025-2030 ($ million)
Data Table on South America - Market size and forecast 2025-2030 ($ million)
Chart on South America - Year-over-year growth 2025-2030 (%)
Data Table on South America - Year-over-year growth 2025-2030 (%)
Chart on Regional Comparison - South America
Data Table on Regional Comparison - South America

13.6.1 Brazil - Market size and forecast 2025-2030

Chart on Brazil - Market size and forecast 2025-2030 ($ million)
Data Table on Brazil - Market size and forecast 2025-2030 ($ million)
Chart on Brazil - Year-over-year growth 2025-2030 (%)
Data Table on Brazil - Year-over-year growth 2025-2030 (%)

13.6.2 Argentina - Market size and forecast 2025-2030

Chart on Argentina - Market size and forecast 2025-2030 ($ million)
Data Table on Argentina - Market size and forecast 2025-2030 ($ million)
Chart on Argentina - Year-over-year growth 2025-2030 (%)
Data Table on Argentina - Year-over-year growth 2025-2030 (%)

13.6.3 Chile - Market size and forecast 2025-2030

Chart on Chile - Market size and forecast 2025-2030 ($ million)
Data Table on Chile - Market size and forecast 2025-2030 ($ million)
Chart on Chile - Year-over-year growth 2025-2030 (%)
Data Table on Chile - Year-over-year growth 2025-2030 (%)

13.7 Middle East and Africa - Market size and forecast 2025-2030

Chart on Middle East and Africa - Market size and forecast 2025-2030 ($ million)
Data Table on Middle East and Africa - Market size and forecast 2025-2030 ($ million)
Chart on Middle East and Africa - Year-over-year growth 2025-2030 (%)
Data Table on Middle East and Africa - Year-over-year growth 2025-2030 (%)
Chart on Regional Comparison - Middle East and Africa
Data Table on Regional Comparison - Middle East and Africa

13.7.1 Saudi Arabia - Market size and forecast 2025-2030

Chart on Saudi Arabia - Market size and forecast 2025-2030 ($ million)
Data Table on Saudi Arabia - Market size and forecast 2025-2030 ($ million)
Chart on Saudi Arabia - Year-over-year growth 2025-2030 (%)
Data Table on Saudi Arabia - Year-over-year growth 2025-2030 (%)

13.7.2 UAE - Market size and forecast 2025-2030

Chart on UAE - Market size and forecast 2025-2030 ($ million)
Data Table on UAE - Market size and forecast 2025-2030 ($ million)
Chart on UAE - Year-over-year growth 2025-2030 (%)
Data Table on UAE - Year-over-year growth 2025-2030 (%)

13.7.3 South Africa - Market size and forecast 2025-2030

Chart on South Africa - Market size and forecast 2025-2030 ($ million)
Data Table on South Africa - Market size and forecast 2025-2030 ($ million)
Chart on South Africa - Year-over-year growth 2025-2030 (%)
Data Table on South Africa - Year-over-year growth 2025-2030 (%)

13.7.4 Israel - Market size and forecast 2025-2030

Chart on Israel - Market size and forecast 2025-2030 ($ million)
Data Table on Israel - Market size and forecast 2025-2030 ($ million)
Chart on Israel - Year-over-year growth 2025-2030 (%)
Data Table on Israel - Year-over-year growth 2025-2030 (%)

13.7.5 Turkey - Market size and forecast 2025-2030

Chart on Turkey - Market size and forecast 2025-2030 ($ million)
Data Table on Turkey - Market size and forecast 2025-2030 ($ million)
Chart on Turkey - Year-over-year growth 2025-2030 (%)
Data Table on Turkey - Year-over-year growth 2025-2030 (%)

13.8 Market opportunity by geography

Market opportunity by geography ($ million)
Data Tables on Market opportunity by geography ($ million)

14. Drivers, Challenges, and Opportunity

14.1 Market drivers

Escalating demand for hyper-personalized consumer engagement
Advancements in generative AI and real-time rendering
Strategic integration of digital humans in healthcare and corporate education

14.2 Market challenges

High computational complexity and real-time rendering latency
Ethical concerns regarding synthetic media and deepfake proliferation
Fragmented interoperability standards and talent shortages

14.3 Impact of drivers and challenges

Impact of drivers and challenges in 2025 and 2030

14.4 Market opportunities

Transition toward agentic AI and autonomous task execution
Rise of hyper-realistic virtual influencers and social commerce
Integration of emotional AI and multimodal sentiment recognition

15. Competitive Landscape

15.1 Overview

15.2

Overview on criticality of inputs and factors of differentiation

15.3 Landscape disruption

Overview on factors of disruption

15.4 Industry risks

Impact of key risks on business

16. Competitive Analysis

16.1 Companies profiled

Companies covered

16.2 Company ranking index

16.3 Market positioning of companies

Matrix on companies position and classification

16.4 Alibaba Cloud

Alibaba Cloud - Overview
Alibaba Cloud - Product / Service
Alibaba Cloud - Key offerings
SWOT

16.5 Baidu Inc.

Baidu Inc. - Overview
Baidu Inc. - Business segments
Baidu Inc. - Key news
Baidu Inc. - Key offerings
Baidu Inc. - Segment focus
SWOT

16.6 ByteDance Ltd.

ByteDance Ltd. - Overview
ByteDance Ltd. - Product / Service
ByteDance Ltd. - Key offerings
SWOT

16.7 Didimo

Didimo - Overview
Didimo - Product / Service
Didimo - Key offerings
SWOT

16.8 Epic Games Inc.

Epic Games Inc. - Overview
Epic Games Inc. - Product / Service
Epic Games Inc. - Key offerings
SWOT

16.9 Meta Platforms Inc.

Meta Platforms Inc. - Overview
Meta Platforms Inc. - Business segments
Meta Platforms Inc. - Key offerings
Meta Platforms Inc. - Segment focus
SWOT

16.10 Microsoft Corp.

Microsoft Corp. - Overview
Microsoft Corp. - Business segments
Microsoft Corp. - Key news
Microsoft Corp. - Key offerings
Microsoft Corp. - Segment focus
SWOT

16.11 NVIDIA Corp.

NVIDIA Corp. - Overview
NVIDIA Corp. - Business segments
NVIDIA Corp. - Key news
NVIDIA Corp. - Key offerings
NVIDIA Corp. - Segment focus
SWOT

16.12 Ready Player Me

Ready Player Me - Overview
Ready Player Me - Product / Service
Ready Player Me - Key offerings
SWOT

16.13 Reallusion Inc.

Reallusion Inc. - Overview
Reallusion Inc. - Product / Service
Reallusion Inc. - Key offerings
SWOT

16.14 Soul Machines

Soul Machines - Overview
Soul Machines - Product / Service
Soul Machines - Key offerings
SWOT

16.15 Synthesia Ltd.

Synthesia Ltd. - Overview
Synthesia Ltd. - Product / Service
Synthesia Ltd. - Key offerings
SWOT

16.16 Tencent Holdings Ltd.

Tencent Holdings Ltd. - Overview
Tencent Holdings Ltd. - Business segments
Tencent Holdings Ltd. - Key offerings
Tencent Holdings Ltd. - Segment focus
SWOT

16.17 UneeQ

UneeQ - Overview
UneeQ - Product / Service
UneeQ - Key offerings
SWOT

16.18 Unity Technologies Inc.

Unity Technologies Inc. - Overview
Unity Technologies Inc. - Business segments
Unity Technologies Inc. - Key news
Unity Technologies Inc. - Key offerings
Unity Technologies Inc. - Segment focus
SWOT

17. Appendix

17.1 Scope of the report

Market definition
Objectives
Notes and caveats

17.2 Inclusions and exclusions checklist

Inclusions checklist
Exclusions checklist

17.3 Currency conversion rates for US$

17.4 Research methodology

17.5 Data procurement

Information sources

17.6 Data validation

17.7 Validation techniques employed for market sizing

17.8 Data synthesis

17.9 360 degree market analysis

17.10 List of abbreviations

Research Methodology

Technavio presents a detailed picture of the market by way of study, synthesis, and summation of data from multiple sources. The analysts have presented the various facets of the market with a particular focus on identifying the key industry influencers. The data thus presented is comprehensive, reliable, and the result of extensive research, both primary and secondary.

INFORMATION SOURCES

Primary sources

  • Manufacturers and suppliers
  • Channel partners
  • Industry experts
  • Strategic decision makers

Secondary sources

  • Industry journals and periodicals
  • Government data
  • Financial reports of key industry players
  • Historical data
  • Press releases

DATA ANALYSIS

Data Synthesis

  • Collation of data
  • Estimation of key figures
  • Analysis of derived insights

Data Validation

  • Triangulation with data models
  • Reference against proprietary databases
  • Corroboration with industry experts

REPORT WRITING

Qualitative

  • Market drivers
  • Market challenges
  • Market trends
  • Five forces analysis

Quantitative

  • Market size and forecast
  • Market segmentation
  • Geographical insights
  • Competitive landscape

Interested in this report?

Get your sample now to see our research methodology and insights!

Download Now

Frequently Asked Questions

Digital Human Avatar market growth will increase by USD 37154.0 million during 2026-2030.

The Digital Human Avatar market is expected to grow at a CAGR of 43% during 2026-2030.

Digital Human Avatar market is segmented by Product (Virtual assistants, Virtual influencers, Others) Technology (AI-based, 3D modeling and animation, Motion capture, Emotion recognition) Type (Text-based, Voice-based, Gesture-based) Application (Customer service, Entertainment and media, Healthcare, Education and training, Others)

Alibaba Cloud, Aww Inc., Baidu Inc., ByteDance Ltd., Deepbrain AI, Didimo, Epic Games Inc., Genies Inc., Hour One AI, Meta Platforms Inc., Microsoft Corp., NVIDIA Corp., Pinscreen, Ready Player Me, Reallusion Inc., Soul Machines, Synthesia Ltd., Tencent Holdings Ltd., UneeQ, Unity Technologies Inc. are a few of the key vendors in the Digital Human Avatar market.

North America will register the highest growth rate of 40.5% among the other regions. Therefore, the Digital Human Avatar market in North America is expected to garner significant business opportunities for the vendors during the forecast period.

US, Canada, Mexico, Germany, UK, France, Italy, Spain, The Netherlands, China, Japan, India, South Korea, Australia, Indonesia, Brazil, Argentina, Chile, Saudi Arabia, UAE, South Africa, Israel, Turkey

  • Escalating demand for hyper-personalized consumer engagement is the driving factor this market.

The Digital Human Avatar market vendors should focus on grabbing business opportunities from the Product segment as it accounted for the largest market share in the base year.
RIA - Research AI Assistant
Ask RIA