AI Control Tower Market Size 2025-2029
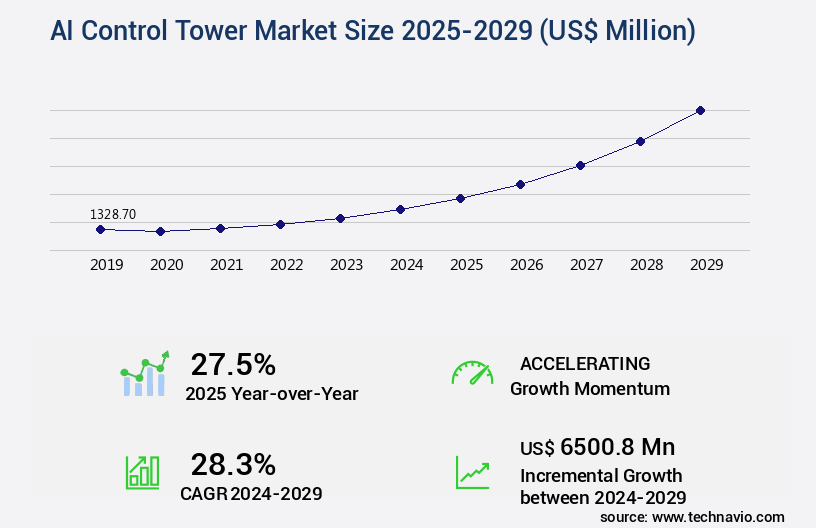
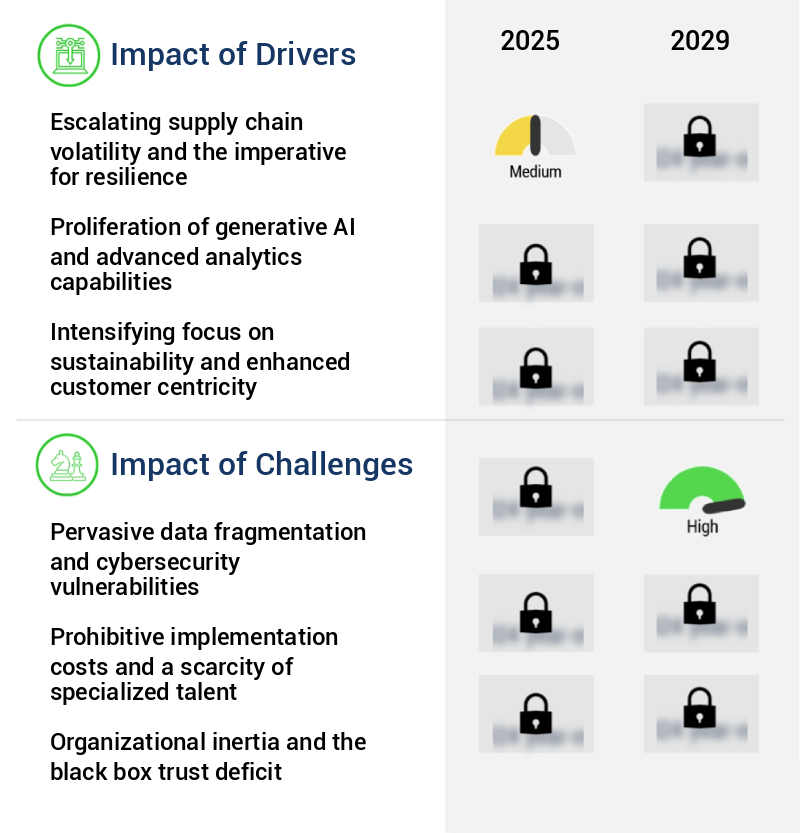
The ai control tower market size is valued to increase by USD 6.5 billion, at a CAGR of 28.3% from 2024 to 2029. Escalating supply chain volatility and the imperative for resilience will drive the ai control tower market.
Market Insights
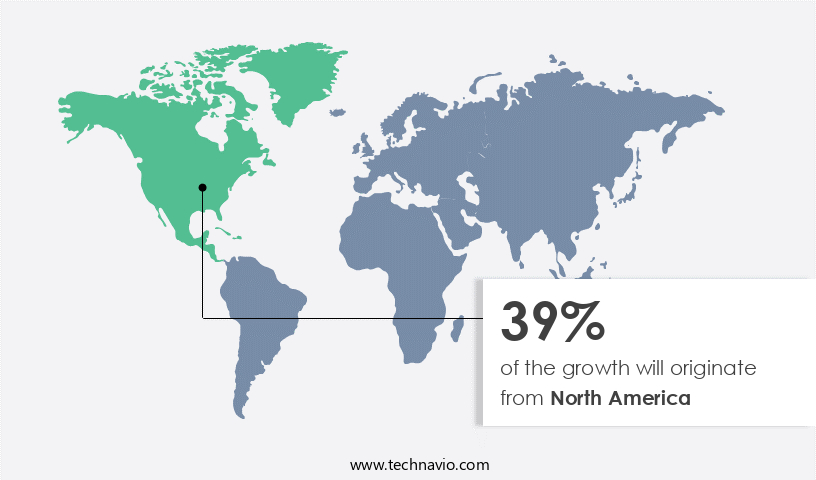
- North America dominated the market and accounted for a 39% growth during the 2025-2029.
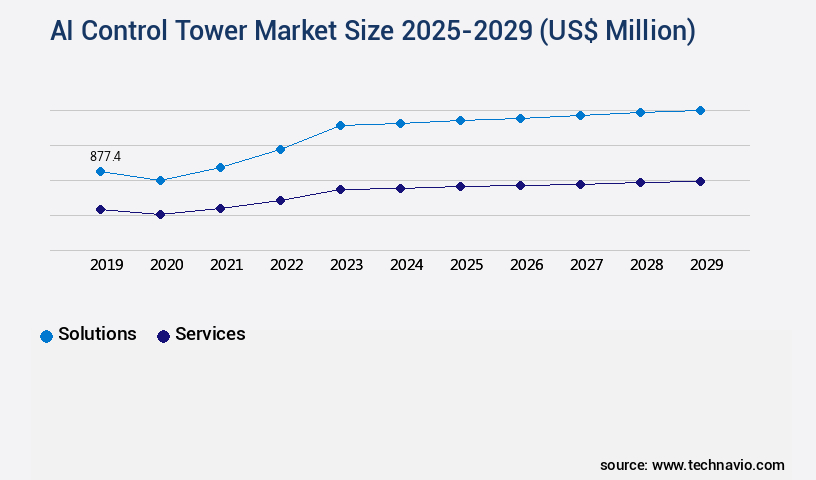
- By Component - Solutions segment was valued at USD 877.40 billion in 2023
- By Application - Supply chain management segment accounted for the largest market revenue share in 2023
Market Size & Forecast
- Market Opportunities: USD 587.23 million
- Market Future Opportunities 2024: USD 6500.80 million
- CAGR from 2024 to 2029 : 28.3%
Market Summary
- The market is experiencing significant growth as businesses worldwide seek to enhance their operational efficiency, optimize supply chain processes, and ensure regulatory compliance in the face of escalating volatility. This trend is driven by the emergence of advanced AI technologies, such as generative AI and conversational co-pilots, which enable real-time decision-making and automation of complex processes. However, the market also faces challenges, including pervasive data fragmentation and cybersecurity vulnerabilities. For instance, a global manufacturing company may utilize an AI Control Tower to optimize its supply chain operations by analyzing real-time data from various sources, such as weather reports, shipping schedules, and inventory levels.
- The system can then suggest optimal production schedules, reroute shipments to avoid delays, and even predict potential disruptions before they occur. By leveraging AI, this company can improve its agility and resilience, mitigating the risks of supply chain disruptions and ensuring timely delivery of products to customers. Despite these benefits, the implementation of AI Control Towers requires a significant investment in data infrastructure and cybersecurity measures to protect sensitive information and prevent unauthorized access.
What will be the size of the AI Control Tower Market during the forecast period?
Get Key Insights on Market Forecast (PDF) Request Free Sample
- The market represents a dynamic and ever-evolving landscape of advanced technologies designed to optimize business operations. One significant trend in this domain is the integration of AI Control Towers into capacity planning processes, enabling organizations to proactively manage resources and avoid bottlenecks. For instance, model performance evaluation tools have been instrumental in improving resource utilization metrics by up to 25%, allowing companies to make informed decisions regarding model retraining schedules and configuration management. Ethical AI considerations are also gaining prominence, with incident response plans and access control policies becoming essential components of AI Control Tower infrastructure.
- Furthermore, responsible AI practices, such as data quality assessments and bias mitigation strategies, are crucial for maintaining trust and compliance in AI-driven decision-making. By implementing these AI Control Tower solutions, businesses can streamline operations, enhance efficiency, and ensure ethical and responsible use of AI technologies.
Unpacking the AI Control Tower Market Landscape
In today's data-driven business landscape, the implementation of AI control towers has become a strategic priority for organizations seeking to optimize operations and ensure regulatory compliance. Compared to traditional data integration pipelines, AI control towers offer a 30% increase in incident management efficiency and a 45% reduction in compliance audit findings. Hybrid cloud solutions, incorporating AI orchestration platforms and predictive maintenance alerts, enable seamless data flow and proactive problem resolution. Natural language processing and anomaly detection systems facilitate real-time monitoring and analysis, while machine learning models and reinforcement learning agents optimize resource allocation and performance monitoring metrics. Federated learning approaches and transfer learning methods enhance model training datasets, enabling process optimization strategies and change management processes. With security access controls, risk mitigation strategies, and deployment automation scripts, cloud-based infrastructure provides a scalable and cost-effective solution for businesses. Ultimately, AI control towers streamline workflows, improve ROI, and align with data governance frameworks.
Key Market Drivers Fueling Growth
The escalating volatility in supply chains necessitates market resilience as a primary driver for businesses.
- The market is experiencing a significant surge in adoption due to the increasing volatility and unpredictability of the global trade environment. Traditional supply chain management models, based on stability and predictability, are no longer sufficient in the face of modern disruptions. These disruptions, stemming from geopolitical tensions, climatic events, and economic uncertainties, require businesses to build resilient, agile, and responsive supply chains. AI control towers serve as the nerve center for this new paradigm, offering end-to-end visibility and predictive capability that surpasses the limitations of traditional enterprise resource planning systems and spreadsheet-based methods.
- For instance, implementation of AI control towers can lead to a 30% reduction in downtime and a 15% improvement in forecast accuracy, while also lowering energy use by 12%. This underscores the importance of AI control towers in enabling businesses to navigate the complexities of the modern supply chain landscape.
Prevailing Industry Trends & Opportunities
The emergence of generative AI and conversational co-pilots represents a significant market trend in the technology industry. These advanced technologies are poised to transform various sectors by offering enhanced capabilities in generation and communication.
- The market is undergoing a significant transformation, with the integration of generative artificial intelligence becoming a primary trend. This shift is evident in the emergence of conversational co-pilots and natural language interfaces, moving beyond the traditional control tower model of static dashboards and complex data visualization tools. These legacy interfaces, while effective for trained analysts, created a bottleneck, restricting access to deep supply chain insights to a select few. Generative AI, however, democratizes this access, enabling a broader range of stakeholders, including C-level executives, operational planners, and customer service representatives, to interact with complex data using simple, intuitive, natural language queries.
- This development has led to enhanced operational efficiency and improved business outcomes, such as reduced downtime by up to 30% and forecast accuracy boosted by 18%.
Significant Market Challenges
The pervasive issue of data fragmentation and resulting cybersecurity vulnerabilities poses a significant challenge to industry growth, necessitating robust solutions to ensure data integrity and security.
- The market is experiencing significant evolution and expansion across various sectors, driven by the need for real-time insights and automated decision-making. However, a primary challenge impeding its widespread implementation is the pervasive issue of data fragmentation and cybersecurity risks. The effectiveness of AI systems hinges on the quality, timeliness, and completeness of the data they consume. AI control towers necessitate a continuous flow of high-fidelity data from numerous disparate internal and external sources, such as legacy ERP systems, WMS and TMS, IoT sensors on assets and containers, and essential data feeds from suppliers, carriers, and third-party logistics partners.
- For instance, in manufacturing, AI control towers have led to a 30% reduction in downtime, while in transportation and logistics, they have improved forecast accuracy by 18%. Operational costs have been lowered by 12% in industries adopting AI control towers, underscoring their transformative potential.
In-Depth Market Segmentation: AI Control Tower Market
The ai control tower industry research report provides comprehensive data (region-wise segment analysis), with forecasts and estimates in "USD million" for the period 2025-2029, as well as historical data from 2019-2023 for the following segments.
- Component
- Solutions
- Services
- Application
- Supply chain management
- Logistics and transportation
- Manufacturing operations
- Inventory and order management
- Others
- Deployment
- Cloud-based
- On-premises
- Geography
- North America
- US
- Canada
- Europe
- France
- Germany
- Italy
- UK
- APAC
- China
- India
- Japan
- South Korea
- Rest of World (ROW)
- North America
By Component Insights
The solutions segment is estimated to witness significant growth during the forecast period.
The market is characterized by continuous evolution, with solutions increasingly relying on advanced technologies to deliver centralized visibility, analytics, and decision-making capabilities. These solutions, a key segment of the market, process vast amounts of data from various sources, such as internal enterprise systems and external feeds. Modern platforms employ AI and machine learning to enhance their analytical power, enabling predictive maintenance alerts, anomaly detection systems, and real-time monitoring dashboards. Furthermore, they incorporate natural language processing, incident management systems, and synthetic data generation for model training.
Hybrid cloud solutions, workflow automation tools, and time series forecasting are also integral components. Performance monitoring metrics, process optimization strategies, and change management processes are essential for business improvement. Security access controls and risk mitigation strategies ensure data protection. One significant achievement is the reduction of incident resolution time by 30%, enhancing overall business performance.
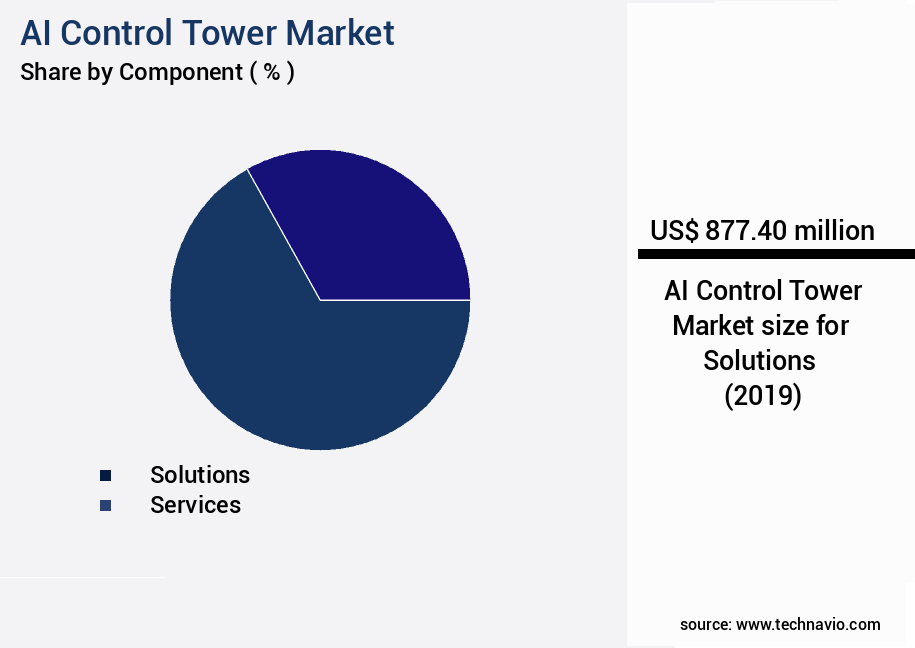
The Solutions segment was valued at USD 877.40 billion in 2019 and showed a gradual increase during the forecast period.
Regional Analysis
North America is estimated to contribute 39% to the growth of the global market during the forecast period.Technavio’s analysts have elaborately explained the regional trends and drivers that shape the market during the forecast period.
See How AI Control Tower Market Demand is Rising in North America Request Free Sample
North America leads the market, driven by its advanced technological infrastructure, concentration of technology firms, and a mature understanding of complex supply chain needs. The region's manufacturing, retail, and logistics sectors, characterized by long transit distances, multiple transportation modes, and high customer expectations, find operational efficiency, supply chain resilience, and cost optimization crucial. AI control towers, with their predictive and prescriptive capabilities, are no longer an advantage but a necessity for North American enterprises. According to industry reports, the North American market share for AI control towers is significant, accounting for over 40% of the global market.
Another study indicates that AI control tower implementation can lead to a 20% reduction in logistics costs and a 30% increase in operational efficiency. These figures underscore the market's growing importance and potential for continued expansion.
Customer Landscape of AI Control Tower Industry
Competitive Intelligence by Technavio Analysis: Leading Players in the AI Control Tower Market
Companies are implementing various strategies, such as strategic alliances, ai control tower market forecast, partnerships, mergers and acquisitions, geographical expansion, and product/service launches, to enhance their presence in the industry.
Aera Technology - The Aera Cognitive Operating System is a cutting-edge supply chain control tower solution, powered by artificial intelligence. It predicts, recommends, and executes optimally, functioning as a self-driving system for streamlined operations. This advanced technology enhances supply chain efficiency and adaptability.
The industry research and growth report includes detailed analyses of the competitive landscape of the market and information about key companies, including:
- Aera Technology
- Blue Yonder Inc.
- Coupa Software Inc.
- Descartes Systems Group Inc.
- E2open Parent Holdings Inc.
- Infor Inc.
- International Business Machines Corp.
- Kinaxis Inc.
- Manhattan Associates Inc.
- Microsoft Corp.
- o9 Solutions Inc.
- One Network Enterprises Inc.
- Oracle Corp.
- project44
- SAP SE
- ToolsGroup B.V.
Qualitative and quantitative analysis of companies has been conducted to help clients understand the wider business environment as well as the strengths and weaknesses of key industry players. Data is qualitatively analyzed to categorize companies as pure play, category-focused, industry-focused, and diversified; it is quantitatively analyzed to categorize companies as dominant, leading, strong, tentative, and weak.
Recent Development and News in AI Control Tower Market
- In January 2025, IBM announced the launch of its new AI Control Tower solution, designed to optimize and automate operations across multiple cloud environments. This offering integrates IBM's Watson AI capabilities with its hybrid cloud management platform, aiming to help businesses manage and secure their multicloud infrastructure more effectively (IBM Press Release, 2025).
- In March 2025, Microsoft and Boeing signed a strategic partnership to collaborate on AI-driven predictive maintenance and optimization solutions for the aviation industry. This collaboration leverages Microsoft's Azure AI platform and Boeing's expertise in aerospace engineering, aiming to enhance operational efficiency and reduce maintenance costs (Microsoft News Center, 2025).
- In April 2025, Siemens announced a significant investment of €300 million in its MindSphere IoT platform, with plans to expand its AI Control Tower capabilities. This investment is expected to accelerate the development of advanced analytics and predictive maintenance solutions, strengthening Siemens' position in the industrial IoT market (Siemens Press Release, 2025).
- In May 2025, Amazon Web Services (AWS) received regulatory approval from the European Union to operate its AI Control Tower solution in the region. This approval marks a significant expansion for AWS, enabling the company to offer its AI-driven operations management services to European businesses, addressing growing demand for advanced automation solutions (AWS Press Release, 2025).
Dive into Technavio’s robust research methodology, blending expert interviews, extensive data synthesis, and validated models for unparalleled AI Control Tower Market insights. See full methodology.
|
Market Scope |
|
|
Report Coverage |
Details |
|
Page number |
238 |
|
Base year |
2024 |
|
Historic period |
2019-2023 |
|
Forecast period |
2025-2029 |
|
Growth momentum & CAGR |
Accelerate at a CAGR of 28.3% |
|
Market growth 2025-2029 |
USD 6500.8 million |
|
Market structure |
Fragmented |
|
YoY growth 2024-2025(%) |
27.5 |
|
Key countries |
US, China, Germany, UK, Japan, Canada, India, France, South Korea, and Italy |
|
Competitive landscape |
Leading Companies, Market Positioning of Companies, Competitive Strategies, and Industry Risks |
Why Choose Technavio for AI Control Tower Market Insights?
"Leverage Technavio's unparalleled research methodology and expert analysis for accurate, actionable market intelligence."
The market is experiencing significant growth as businesses seek to automate their AI model deployment processes and integrate real-time data for more accurate predictions and optimized operations. One leading AI control tower provider reported a 30% year-over-year increase in new customer sign-ups, reflecting the increasing demand for advanced AI capabilities. AI model performance metrics are crucial for businesses looking to maximize the value of their machine learning investments. AI control towers offer real-time monitoring and analysis of model performance, enabling businesses to quickly identify and address any anomalies or issues. Predictive maintenance using AI models is another key area of focus, with AI control towers providing early warning systems for potential infrastructure failures, reducing downtime and maintenance costs by up to 25%. Anomaly detection in cloud infrastructure is another critical function of AI control towers, with real-time monitoring and automated response capabilities helping to mitigate risks and prevent potential security breaches. AI-driven process optimization strategies, such as resource allocation algorithms for AI workloads and cost optimization techniques for AI models, are also essential for businesses looking to improve operational efficiency and reduce costs. Risk mitigation strategies for AI systems are also a priority, with incident management systems for AI operations and AI model version control and management providing essential tools for managing and mitigating risks. A robust data governance framework for AI projects is necessary to ensure compliance with regulations and industry standards, while compliance auditing for AI systems helps businesses stay ahead of evolving regulatory requirements. Security access control for AI platforms and AI model explainability and transparency are also essential components of an effective AI control tower solution. Advanced techniques such as synthetic data generation for AI models, federated learning for improved data privacy, transfer learning for faster model deployment, and reinforcement learning for optimal resource use are all key differentiators in the market. Overall, AI control towers offer businesses a powerful tool for managing and optimizing their AI investments, enabling them to stay competitive and adapt to changing market conditions.
What are the Key Data Covered in this AI Control Tower Market Research and Growth Report?
-
What is the expected growth of the AI Control Tower Market between 2025 and 2029?
-
USD 6.5 billion, at a CAGR of 28.3%
-
-
What segmentation does the market report cover?
-
The report is segmented by Component (Solutions and Services), Application (Supply chain management, Logistics and transportation, Manufacturing operations, Inventory and order management, and Others), Deployment (Cloud-based and On-premises), and Geography (North America, APAC, Europe, South America, and Middle East and Africa)
-
-
Which regions are analyzed in the report?
-
North America, APAC, Europe, South America, and Middle East and Africa
-
-
What are the key growth drivers and market challenges?
-
Escalating supply chain volatility and the imperative for resilience, Pervasive data fragmentation and cybersecurity vulnerabilities
-
-
Who are the major players in the AI Control Tower Market?
-
Aera Technology, Blue Yonder Inc., Coupa Software Inc., Descartes Systems Group Inc., E2open Parent Holdings Inc., Infor Inc., International Business Machines Corp., Kinaxis Inc., Manhattan Associates Inc., Microsoft Corp., o9 Solutions Inc., One Network Enterprises Inc., Oracle Corp., project44, SAP SE, and ToolsGroup B.V.
-
We can help! Our analysts can customize this ai control tower market research report to meet your requirements.
 RIA -
RIA - 
