AI Data Center Power Consumption Market Size 2026-2030
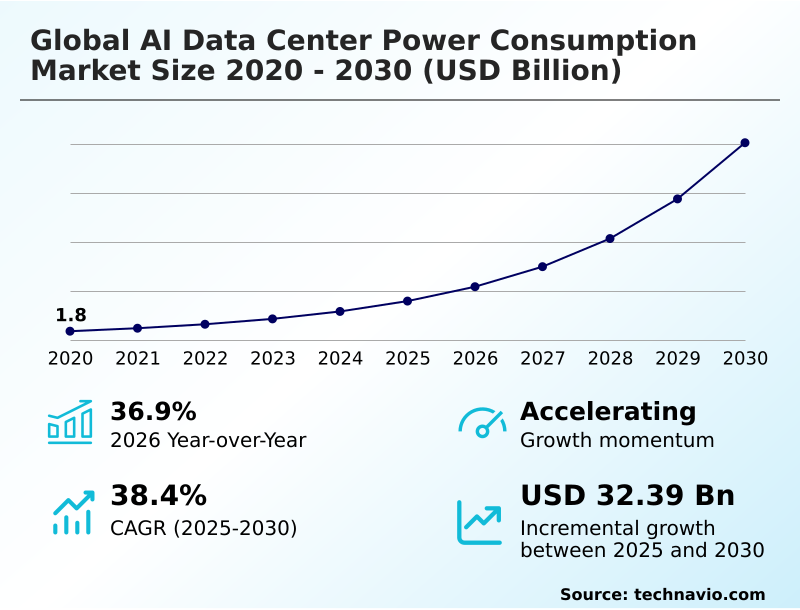
The AI Data Center Power Consumption Market size was valued at USD 7.96 billion in 2025, growing at a CAGR of 38.4% during the forecast period 2026-2030.
Major Market Trends & Insights
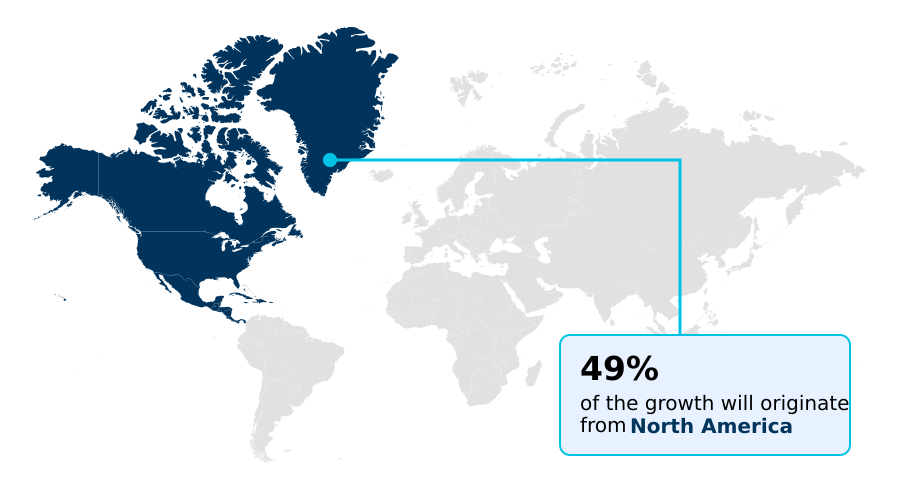
- North America dominated the market and accounted for a 48.8% growth during the forecast period.
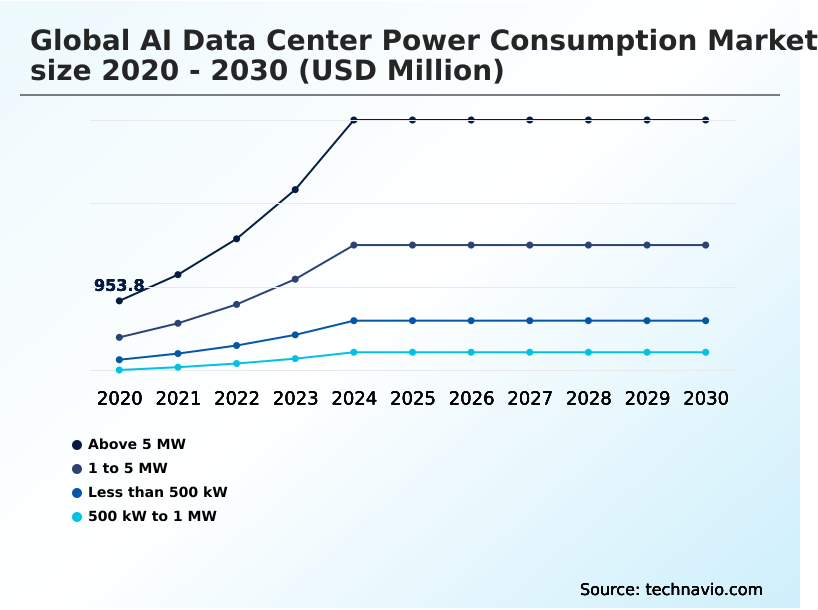
- By Capacity - Above 5 MW segment was valued at USD 3.17 billion in 2024
- By Type - Hyperscale data centers segment accounted for the largest market revenue share in 2024
Market Size & Forecast
- Historic Market Opportunities 2020-2024: USD 38.55 billion
- Market Future Opportunities 2025-2030: USD 32.39 billion
- CAGR from 2025 to 2030 : 38.4%
Market Summary
- The AI data center power consumption market is defined by intense energy requirements, with AI workloads consuming up to 30% more power than traditional computing applications. This surge has led to data center operators reporting an average of 15% higher operational costs directly attributable to AI infrastructure.
- For instance, a financial services firm deploying generative AI for real-time fraud detection must scale its power and cooling capacity, facing significant capital expenditure. This demand is primarily driven by the escalating complexity of AI models, which require exponentially more processing power for both training and inference.
- However, this growth is constrained by the limited capacity of public electrical grids, which often cannot support the multi-megawatt demands of new, high-density facilities, creating a significant bottleneck for expansion.
What will be the Size of the AI Data Center Power Consumption Market during the forecast period?
Get Key Insights on Market Forecast (PDF) Request Free Sample
How is the AI Data Center Power Consumption Market Segmented?
The ai data center power consumption industry research report provides comprehensive data (region-wise segment analysis), with forecasts and analysis for the period 2026-2030, as well as historical data from 2020-2024 for the following segments.
- Capacity
- Above 5 MW
- 1 to 5 MW
- Less than 500 kW
- 500 kW to 1 MW
- Type
- Hyperscale data centers
- Colocation data centers
- Enterprise data centers
- Edge data centers
- End-user
- IT and telecom
- BFSI
- Healthcare
- Others
- Geography
- North America
- US
- Canada
- Mexico
- APAC
- China
- Japan
- India
- Europe
- Germany
- UK
- France
- South America
- Brazil
- Argentina
- Middle East and Africa
- Saudi Arabia
- UAE
- South Africa
- Rest of World (ROW)
- North America
How is the AI Data Center Power Consumption Market Segmented by Capacity?
The above 5 mw segment is estimated to witness significant growth during the forecast period.
The above 5 MW segment is driven by hyperscale data centers, where a single facility can house over 50,000 specialized processors for large-scale AI model training.
These deployments necessitate robust electrical infrastructure modernization, including high-capacity uninterruptible power supply (UPS) systems and busway power distribution to support extreme high-density racks.
To manage the immense thermal output and reduce the total cost of ownership (TCO), operators are deploying advanced liquid cooling.
These systems, including direct-to-chip cooling, are up to 40% more effective at heat removal than legacy air cooling, significantly improving cooling system efficiency and lowering operational cost reduction.
This shift is critical as power and thermal management now represent a larger portion of a facility's budget, with sophisticated data center power monitoring managing every power distribution unit (PDU) for peak performance.
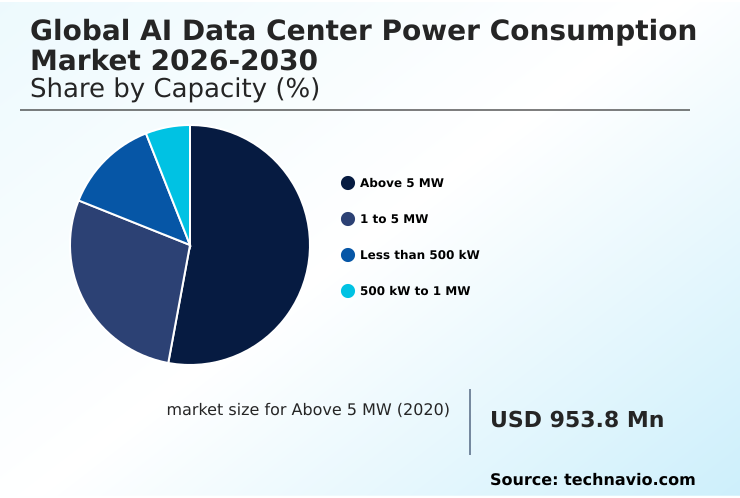
The Above 5 MW segment was valued at USD 3.17 billion in 2024 and showed a gradual increase during the forecast period.
How demand for the AI Data Center Power Consumption market is rising in the leading region?
North America is estimated to contribute 48.8% to the growth of the global market during the forecast period.Technavio’s analysts have elaborately explained the regional trends and drivers that shape the market during the forecast period.
See How AI Data Center Power Consumption Market demand is rising in North America Request Free Sample
North America dominates the geographic landscape, poised to capture 48.8% of the market's incremental growth, significantly outpacing APAC's 26.29%.
This lead is sustained by the high concentration of hyperscale data centers in the US, which benefit from established supply chains and a mature innovation ecosystem focused on AI workload optimization and improving power usage effectiveness (PUE).
In contrast, APAC's growth is driven by the rise of sovereign AI infrastructure and government-backed digital transformation initiatives.
This creates different operational challenges; North American operators focus on retrofitting existing sites with superior power delivery architecture, while APAC developers often build new, large-scale facilities, integrating data center sustainability metrics from the ground up.
This regional divergence requires vendors to tailor their thermal management system and power supply unit (PSU) efficiency strategies accordingly.
What are the key Drivers, Trends, and Challenges in the AI Data Center Power Consumption Market?
Our researchers analyzed the data with 2025 as the base year, along with the key drivers, trends, and challenges. A holistic analysis of drivers will help companies refine their marketing strategies to gain a competitive advantage.
- Operators are implementing advanced AI data center PUE improvement strategies to counteract the escalating power demands of modern AI workloads, with successful initiatives reducing operational energy waste by over 15%. A core component of this effort involves managing thermal loads in AI data centers, where traditional air cooling is insufficient.
- The adoption of liquid cooling for high-density AI servers, including direct-to-chip and immersion techniques, is becoming standard practice, as it handles heat loads over two times more effectively than air-based methods. The significant power consumption of generative AI training, which can require hundreds of megawatts for a single model, is a primary driver for these innovations.
- Consequently, the strategic development of renewable energy for AI data centers is no longer optional but a critical business requirement. Many hyperscalers are co-locating facilities with large-scale solar or wind farms, which not only improves their carbon footprint but also reduces energy transmission losses by up to 8%, providing a more reliable and cost-effective power source.
- This integrated approach is fundamental to sustaining the industry's growth trajectory.
What are the key market drivers leading to the rise in the adoption of AI Data Center Power Consumption Industry?
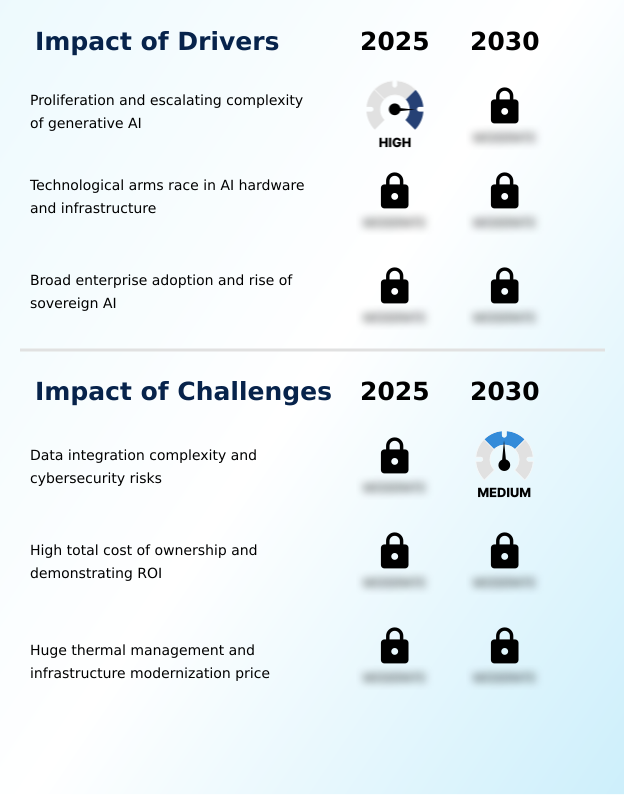
- The primary driver propelling market growth is the proliferation and escalating complexity of generative AI models, which demand exponentially more compute power and energy.
- The escalating complexity of generative AI is a primary market driver, as each new generation of AI accelerator increases power draw per rack by up to 25%.
- This technological arms race, focused on delivering more powerful high-performance computing (HPC) power, directly fuels demand for more robust power and cooling infrastructure.
- The training phase for a single large-scale model can consume multiple gigawatt-hours, an energy-intensive workload that scales with model size and complexity.
- Furthermore, the rise of sovereign AI infrastructure is driving the construction of new, power-hungry data centers in various regions, as nations prioritize domestic data processing.
- This trend ensures that the demand for silicon carbide (SiC) power devices and advanced voltage regulator modules (VRMs) remains high to support these specialized facilities.
What are the market trends shaping the AI Data Center Power Consumption Industry?
- The widespread adoption of advanced liquid cooling technologies is emerging as a defining trend, driven by the need for more efficient thermal management in high-density AI data centers.
- A primary trend is the shift toward advanced liquid cooling, as immersion cooling and direct-to-chip cooling solutions demonstrate over 30% greater heat-rejection capacity than legacy air-cooling systems. This enables higher rack power density and supports next-generation AI accelerators.
- Another significant trend is the strategic coupling of data centers with renewable energy integration, with some operators co-locating facilities next to solar or wind farms to secure green power and reduce transmission losses by up to 8%. This supports a sustainable data center model and contributes to carbon footprint reduction.
- The use of waste heat recovery systems is also growing, allowing facilities to repurpose thermal energy for district heating, further improving overall energy efficiency optimization.
What challenges does the AI Data Center Power Consumption Industry face during its growth?
- A primary challenge impacting the market is the strain on aging electrical grids, as the massive power requirements of modern AI clusters frequently exceed the capacity of existing transmission networks.
- A significant challenge is the strain on public electrical grid capacity, with wait times for new high-voltage connections in some tech hubs exceeding two years. This bottleneck directly impedes the construction of new AI facilities, forcing operators to explore costly on-site power generation.
- Another major hurdle is the high total cost of ownership (TCO) associated with thermal management, as retrofitting a legacy data center with modern liquid cooling loops can increase capital expenditure by up to 30%. The operational complexity of data center infrastructure management (DCIM) for these advanced systems also presents a challenge.
- Without predictive energy management and sophisticated power management software, operators risk inefficient power oversubscription, leading to wasted energy and higher operational costs.
Exclusive Technavio Analysis on Customer Landscape
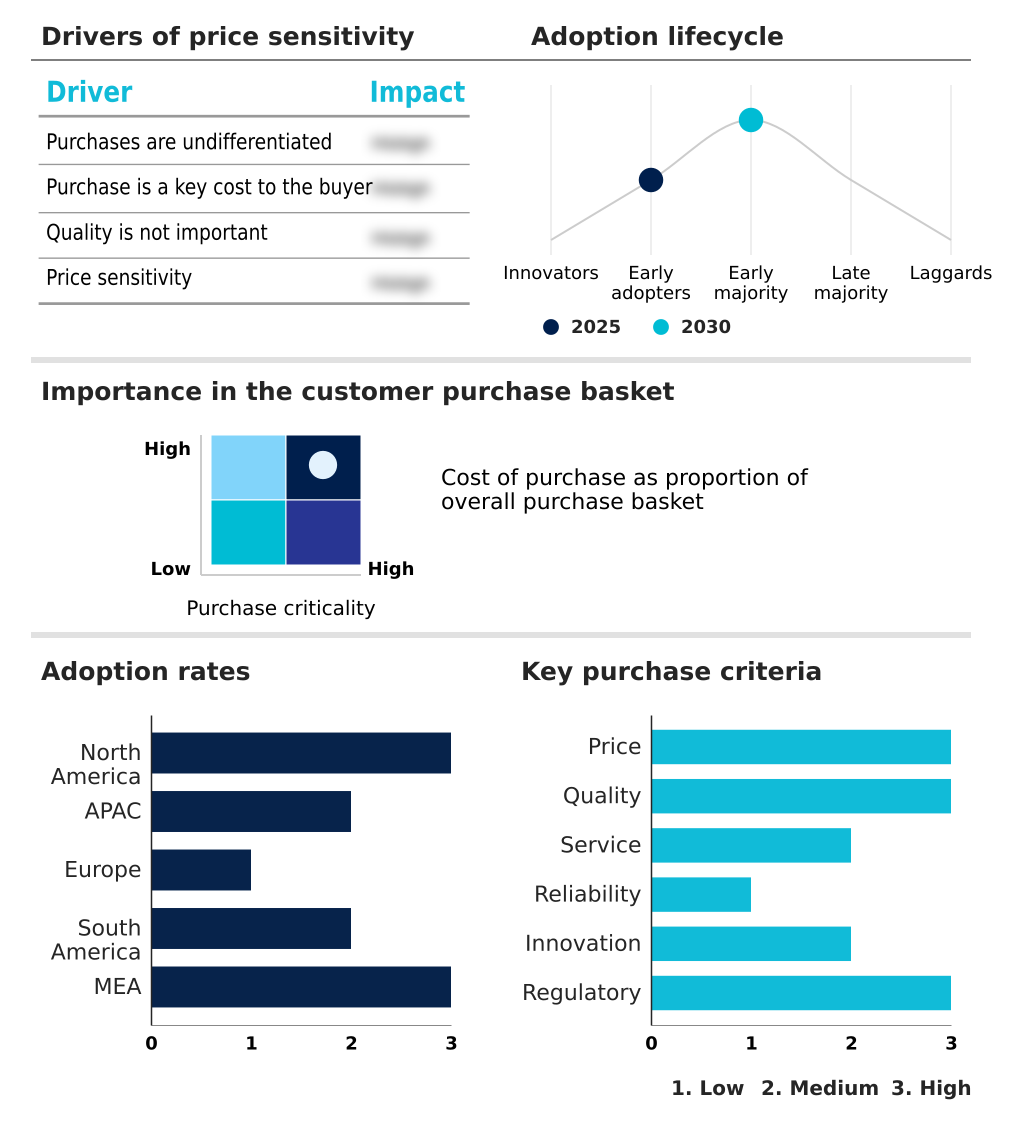
The ai data center power consumption market forecasting report includes the adoption lifecycle of the market, covering from the innovator’s stage to the laggard’s stage. It focuses on adoption rates in different regions based on penetration. Furthermore, the ai data center power consumption market report also includes key purchase criteria and drivers of price sensitivity to help companies evaluate and develop their market growth analysis strategies.
Customer Landscape of AI Data Center Power Consumption Industry
Competitive Landscape
Companies are implementing various strategies, such as strategic alliances, ai data center power consumption market forecast, partnerships, mergers and acquisitions, geographical expansion, and product/service launches, to enhance their presence in the industry.
ABB Ltd. - Offerings include advanced power distribution, uninterruptible power supply (UPS) systems, and digital monitoring technologies designed to optimize energy efficiency and reliability for large-scale AI workloads.
The industry research and growth report includes detailed analyses of the competitive landscape of the market and information about key companies, including:
- ABB Ltd.
- Bloom Energy Corp.
- Caterpillar Inc.
- Cummins Inc.
- Danfoss AS
- Delta Electronics Inc.
- Eaton Corp. Plc
- Fujitsu Ltd.
- Huawei Technologies Co. Ltd.
- Infineon Technologies AG
- Legrand SA
- Mitsubishi Electric Corp.
- nVent Electric Plc
- NVIDIA Corp.
- Rittal GmbH and Co. KG
- Schneider Electric SE
- Siemens AG
- STMicroelectronics NV
- Super Micro Computer Inc.
- Vicor Corp.
Qualitative and quantitative analysis of companies has been conducted to help clients understand the wider business environment as well as the strengths and weaknesses of key industry players. Data is qualitatively analyzed to categorize companies as pure play, category-focused, industry-focused, and diversified; it is quantitatively analyzed to categorize companies as dominant, leading, strong, tentative, and weak.
Market Intelligence Radar: High-Impact Developments & Growth Signals
- In the Application Software industry, the accelerated shift toward cloud-based subscription models has increased demand for centralized, high-density computing, directly boosting the need for power-intensive AI data centers that support scalable AI workload optimization.
- The widespread integration of process automation tools like RPA and ERP across enterprises has created a surge in data processing requirements, fueling the expansion of AI data centers designed for energy-intensive workloads and predictive energy management.
- Persistent challenges in data integration are compelling organizations to adopt unified AI platforms, which in turn necessitates more powerful and energy-hungry data center environments capable of handling complex power delivery architecture and data management tasks.
- The proliferation of AI development platforms for building machine learning models has democratized access to AI, leading to a broader user base and a corresponding increase in aggregate power consumption, demanding better data center sustainability metrics.
Dive into Technavio’s robust research methodology, blending expert interviews, extensive data synthesis, and validated models for unparalleled AI Data Center Power Consumption Market insights. See full methodology.
| Market Scope | |
|---|---|
| Page number | 314 |
| Base year | 2025 |
| Historic period | 2020-2024 |
| Forecast period | 2026-2030 |
| Growth momentum & CAGR | Accelerate at a CAGR of 38.4% |
| Market growth 2026-2030 | USD 32394.1 million |
| Market structure | Fragmented |
| YoY growth 2025-2026(%) | 36.9% |
| Key countries | US, Canada, Mexico, China, Japan, India, South Korea, Australia, Indonesia, Germany, UK, France, Italy, Spain, The Netherlands, Brazil, Argentina, Chile, Saudi Arabia, UAE, South Africa, Israel and Turkey |
| Competitive landscape | Leading Companies, Market Positioning of Companies, Competitive Strategies, and Industry Risks |
Research Analyst Overview
- The market ecosystem for AI data center power consumption involves a complex value chain, with a 10% performance gain in a new chip potentially leading to a 5% reduction in total energy for a given workload. It begins with specialized semiconductor companies providing the core AI accelerators and processors.
- These components are integrated by server OEMs, who work closely with power infrastructure providers that supply critical systems like UPS, switchgear, and advanced cooling solutions, capturing approximately 30% of the total capital expenditure for a new facility. The resulting infrastructure is then deployed by end-users, primarily hyperscale cloud providers and large enterprises, who are the ultimate consumers of the power.
- This ecosystem is supported by software vendors offering energy management tools and utility companies that must collaborate on grid modernization to meet the massive, concentrated power demands.
What are the Key Data Covered in this AI Data Center Power Consumption Market Research and Growth Report?
-
What is the expected growth of the AI Data Center Power Consumption Market between 2026 and 2030?
-
The AI Data Center Power Consumption Market is expected to grow by USD 32.39 billion during 2026-2030, registering a CAGR of 38.4%. Year-over-year growth in 2026 is estimated at 36.9%%. This acceleration is shaped by proliferation and escalating complexity of generative ai, which is intensifying demand across multiple end-use verticals covered in the report.
-
-
What segmentation does the market report cover?
-
The report is segmented by Capacity (Above 5 MW, 1 to 5 MW, Less than 500 kW, and 500 kW to 1 MW), Type (Hyperscale data centers, Colocation data centers, Enterprise data centers, and Edge data centers), End-user (IT and telecom, BFSI, Healthcare, and Others) and Geography (North America, APAC, Europe, South America, Middle East and Africa). Among these, the Above 5 MW segment is estimated to witness significant growth during the forecast period, driven by rising adoption across key application areas. Each segment includes detailed qualitative and quantitative analysis, along with historical data from 2020-2024 and forecasts through 2030 with year-over-year growth rates.
-
-
Which regions are analyzed in the report?
-
The report covers North America, APAC, Europe, South America and Middle East and Africa. North America is estimated to contribute 48.8% to market growth during the forecast period. Country-level analysis includes US, Canada, Mexico, China, Japan, India, South Korea, Australia, Indonesia, Germany, UK, France, Italy, Spain, The Netherlands, Brazil, Argentina, Chile, Saudi Arabia, UAE, South Africa, Israel and Turkey, with dedicated market size tables and year-over-year growth for each.
-
-
What are the key growth drivers and market challenges?
-
The primary driver is proliferation and escalating complexity of generative ai, which is accelerating investment and industry demand. The main challenge is data integration complexity and cybersecurity risks, creating operational barriers for key market participants. The report quantifies the impact of each driver and challenge across 2026 and 2030 with comparative analysis.
-
-
Who are the major players in the AI Data Center Power Consumption Market?
-
Key vendors include ABB Ltd., Bloom Energy Corp., Caterpillar Inc., Cummins Inc., Danfoss AS, Delta Electronics Inc., Eaton Corp. Plc, Fujitsu Ltd., Huawei Technologies Co. Ltd., Infineon Technologies AG, Legrand SA, Mitsubishi Electric Corp., nVent Electric Plc, NVIDIA Corp., Rittal GmbH and Co. KG, Schneider Electric SE, Siemens AG, STMicroelectronics NV, Super Micro Computer Inc. and Vicor Corp.. The report provides qualitative and quantitative analysis categorizing companies as dominant, leading, strong, tentative, and weak based on their market positioning. Company profiles include business segment analysis, SWOT assessment, key offerings, and recent strategic developments.
-
Market Research Insights
- The competitive landscape is increasingly concentrated, with the top five power and cooling vendors accounting for over 60% of infrastructure sales for new AI deployments. Key players such as NVIDIA Corp.
- continue to push hardware limits, with new GPU architectures increasing thermal design power and demanding more robust power delivery systems from partners like Schneider Electric SE, who respond with modular power and cooling solutions. These innovations directly address the enterprise need for scalable and efficient infrastructure.
- This rapid technological evolution, however, faces significant supply chain constraints for specialized components like high-capacity transformers and switchgear, which can delay new data center projects by an average of six months, impacting the pace of market expansion.
We can help! Our analysts can customize this ai data center power consumption market research report to meet your requirements.
 RIA -
RIA - 
