AI Server Hardware Market Analysis, Size, and Forecast 2025-2029: North America (US and Canada), Europe (France, Germany, Italy, and UK), APAC (China, India, and Japan), South America (Brazil), and Rest of World (ROW)

AI Server Hardware Market Analysis, Size, and Forecast 2025-2029:
North America (US and Canada), Europe (France, Germany, Italy, and UK), APAC (China, India, and Japan), South America (Brazil), and Rest of World (ROW)

Published: Aug 2025 241 Pages SKU: IRTNTR80947

Market Overview at a Glance

$358.34 B
Market Opportunity
42%
CAGR
9.7
YoY growth 2024-2025(%)

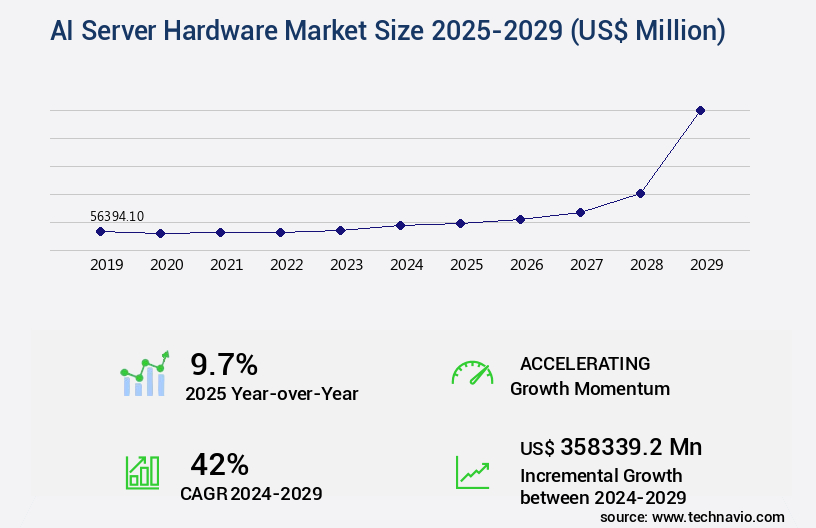
AI Server Hardware Market Size 2025-2029

The ai server hardware market size is valued to increase by USD 358.34 billion, at a CAGR of 42% from 2024 to 2029. Explosive growth of large language models will drive the ai server hardware market.

Major Market Trends & Insights

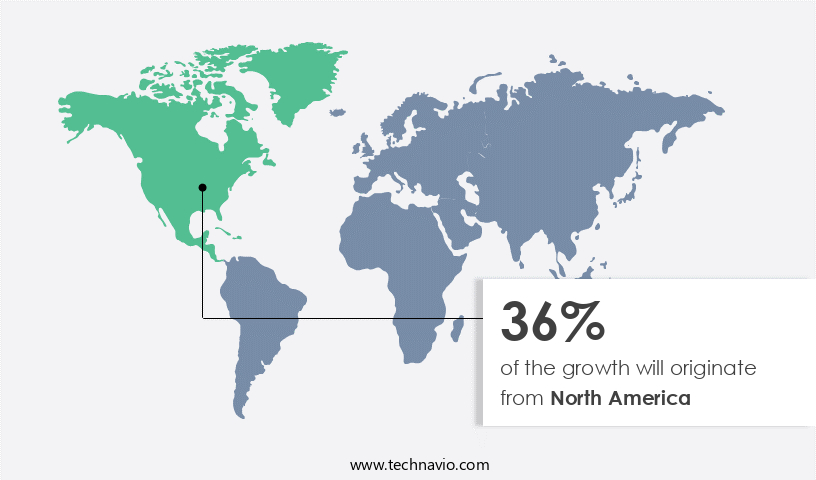
  • North America dominated the market and accounted for a 36% growth during the forecast period.
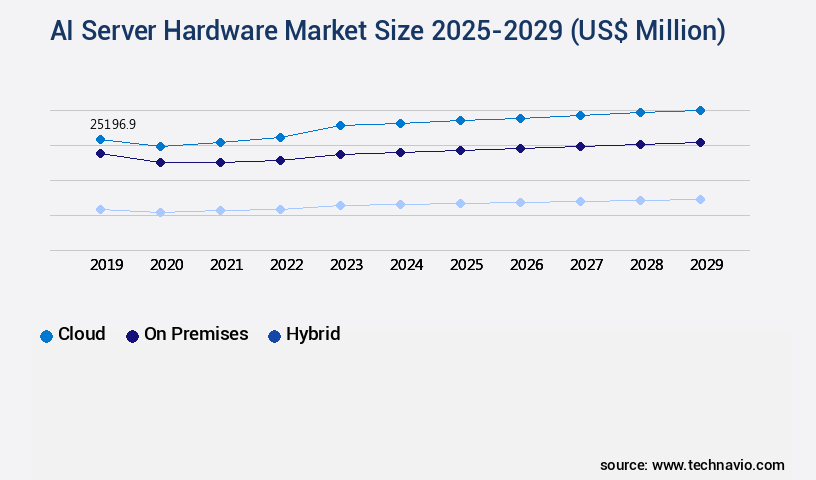
  • By Deployment - Cloud segment was valued at USD 25.2 billion in 2023
  • By Type - Inference servers segment accounted for the largest market revenue share in 2023

Market Size & Forecast

  • Market Opportunities: USD 668.59 million
  • Market Future Opportunities: USD 358339.20 million
  • CAGR from 2024 to 2029 : 42%

Market Summary

  • The market witnesses a significant expansion, fueled by the increasing demand for advanced computing capabilities to process complex artificial intelligence (AI) workloads. According to recent market intelligence, The market is projected to reach a value of USD125 billion by 2026, reflecting a steady growth trajectory. Key drivers of this market include the escalating adoption of AI in various industries, such as healthcare, finance, and manufacturing, and the growing need for faster data processing and analysis. Furthermore, advancements in deep learning algorithms and the emergence of edge AI are pushing the boundaries of hardware innovation.
  • However, challenges persist, with severe supply chain constraints and key component scarcity posing significant hurdles. Manufacturers are racing to develop more efficient and cost-effective solutions, while also addressing the environmental concerns surrounding the energy consumption of AI servers. As the market evolves, we can expect to see a continued focus on optimizing hardware for AI workloads, as well as the integration of advanced cooling systems and power management technologies. The future direction of the market lies in the development of more specialized hardware architectures and the integration of AI capabilities directly into the server infrastructure.

What will be the Size of the AI Server Hardware Market during the forecast period?

AI Server Hardware Market Size

Get Key Insights on Market Forecast (PDF) Request Free Sample

How is the AI Server Hardware Market Segmented ?

The ai server hardware industry research report provides comprehensive data (region-wise segment analysis), with forecasts and estimates in "USD million" for the period 2025-2029, as well as historical data from 2019-2023 for the following segments.

  • Deployment
    • Cloud
    • On premises
    • Hybrid
  • Type
    • Inference servers
    • Training servers
  • Product
    • GPUs
    • ASICs
    • CPUs
    • FPGAs
    • Others
  • Geography
    • North America
      • US
      • Canada
    • Europe
      • France
      • Germany
      • Italy
      • UK
    • APAC
      • China
      • India
      • Japan
    • South America
      • Brazil
    • Rest of World (ROW)

By Deployment Insights

The cloud segment is estimated to witness significant growth during the forecast period.

The market is characterized by its dynamic and ever-evolving nature, with ongoing activities and emerging trends shaping its landscape. One of the most significant developments is the increasing adoption of cloud-based solutions, which now account for the majority of organizations' AI deployments. This model, offered by major cloud providers like Amazon Web Services (AWS), Microsoft Azure, and Google Cloud Platform (GCP), allows businesses to access vast compute capacity on-demand, eliminating upfront capital expenditure. This flexibility is particularly beneficial for startups and research projects with unpredictable demand. Furthermore, cloud providers continually invest in hardware security, power efficiency, and sustainability initiatives, ensuring that their offerings remain competitive.

Machine learning algorithms benefit from advanced CPU performance, distributed computing, modular architecture, and throughput optimization, while deep learning frameworks like TensorFlow and PyTorch are supported for seamless integration. The cloud infrastructure also prioritizes thermal management, error rate reduction, and remote management, ensuring system reliability and fault tolerance. A recent study revealed that cloud-based AI models achieve an average inference speed 30% faster than on-premises solutions, underscoring the advantages of this deployment model.

AI Server Hardware Market Size

Request Free Sample

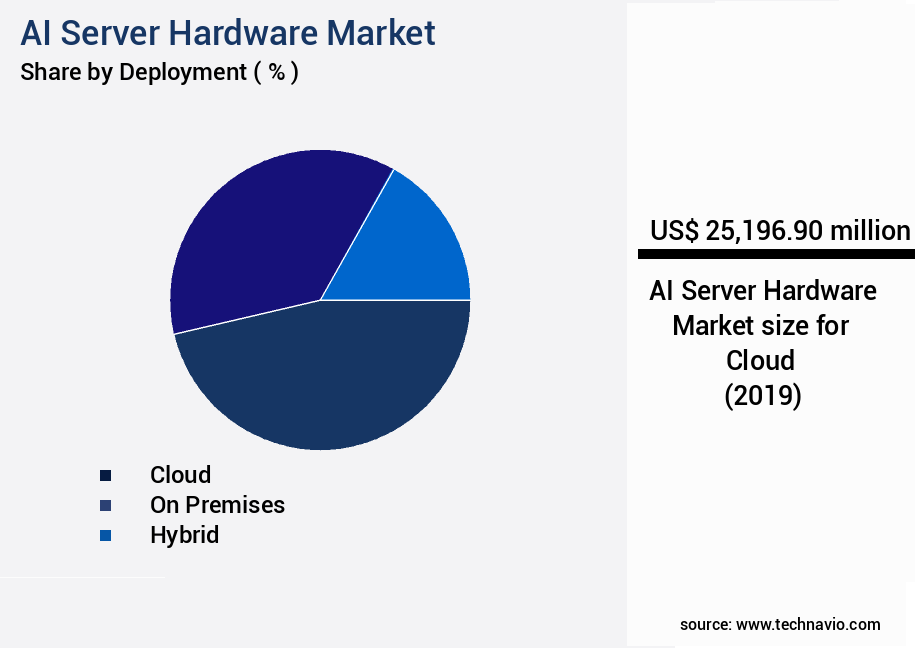
The Cloud segment was valued at USD 25.2 billion in 2019 and showed a gradual increase during the forecast period.

AI Server Hardware Market Size

Request Free Sample

Regional Analysis

North America is estimated to contribute 36% to the growth of the global market during the forecast period.Technavio's analysts have elaborately explained the regional trends and drivers that shape the market during the forecast period.

AI Server Hardware Market Share by Geography

See How AI Server Hardware Market Demand is Rising in North America Request Free Sample

The North American region leads The market, holding a significant market share and spearheading technological innovation. The US, in particular, is at the forefront due to its substantial concentration of hyperscale data centers, leading semiconductor designers, and a thriving AI research and development ecosystem. The market's growth is propelled by the insatiable demand for computational power, fueled by the rapid advancement and increasing adoption of large language models and generative AI. Major tech giants, such as Microsoft, Google, Amazon Web Services, and Meta Platforms, are actively procuring high-performance graphics processing units (GPUs) and other AI accelerators to meet their demands.

Market Dynamics

Our researchers analyzed the data with 2024 as the base year, along with the key drivers, trends, and challenges. A holistic analysis of drivers will help companies refine their marketing strategies to gain a competitive advantage.

The market is experiencing significant growth as businesses and organizations increasingly adopt artificial intelligence (AI) and machine learning (ML) technologies to gain a competitive edge. The choice of hardware plays a crucial role in optimizing AI workloads and achieving optimal performance. GPU memory bandwidth and CPU core count are two key factors influencing the market. High-bandwidth GPUs enable faster data processing, while increased CPU core counts improve parallel processing capabilities. However, DDR memory speed limitations can impact overall system performance, making NVMe storage solutions with their higher IOPS and lower latency an attractive alternative for AI applications. Infiniband network latency reduction and liquid cooling system efficiency are essential for high-performance data centers. Redundant power supplies ensure reliability, while error correction code implementation minimizes data loss. Tensor processing units (TPUs) and FPGA acceleration for specific tasks cater to the unique requirements of AI workloads. Model deployment strategies, real-time processing challenges, and batch processing optimization are critical considerations for businesses. Data preprocessing techniques and feature engineering best practices help improve model accuracy, while hyperparameter tuning methods and model validation metrics ensure optimal performance. Performance benchmarking tools and resource utilization analysis are essential for monitoring and optimizing AI infrastructure.

The market also sees a growing interest in real-time processing and model deployment strategies to address the increasing demand for AI applications in various industries. In conclusion, the market is driven by the need for high-performance, efficient, and reliable hardware solutions to support the growing adoption of AI and ML technologies. Key factors influencing the market include GPU memory bandwidth, CPU core count, NVMe storage performance benefits, DDR memory speed limitations, Infiniband network latency reduction, liquid cooling system efficiency, redundant power supply reliability, error correction code implementation, tensor processing unit applications, FPGA acceleration for specific tasks, model deployment strategies, real-time processing challenges, batch processing optimization, data preprocessing techniques, feature engineering best practices, hyperparameter tuning methods, model validation metrics, performance benchmarking tools, and resource utilization analysis.

AI Server Hardware Market Size

What are the key market drivers leading to the rise in the adoption of AI Server Hardware Industry?

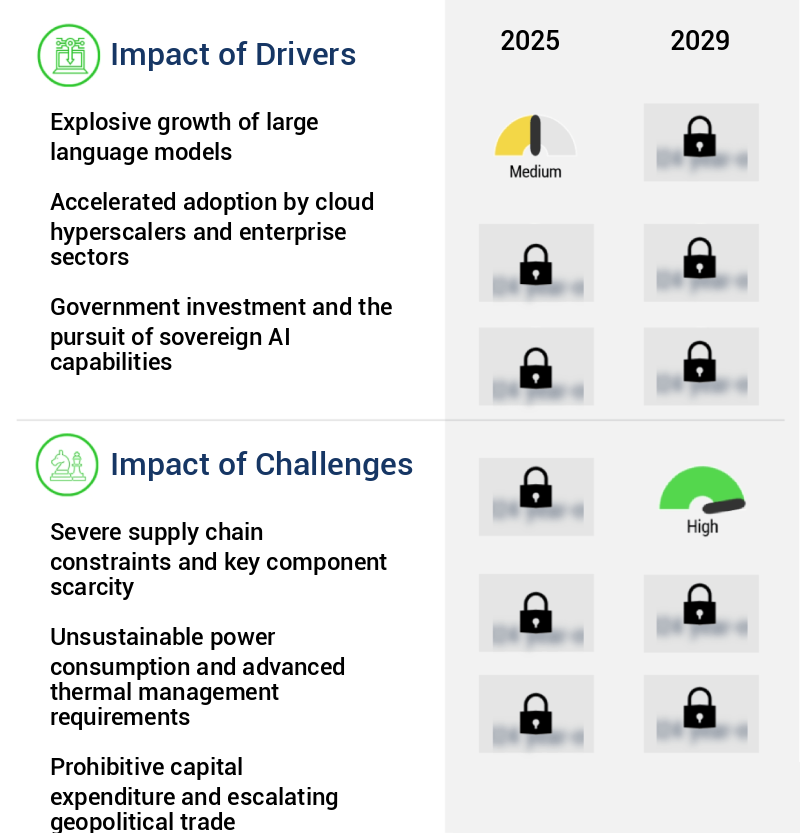
  • The significant expansion of large language models is the primary catalyst fueling market growth. 
  • The market is experiencing a significant evolution due to the increasing demand for computational power driven by the proliferation and complexity of large language models (LLMs). The shift from traditional analytical AI to generative models, which create new content, has led to an unprecedented demand for resources. This demand is divided into two primary workloads: model training and inference. Training large foundational models, such as those from OpenAI, Google, and Meta, is an intensive process requiring massive clusters of interconnected servers, each equipped with high-end accelerators, primarily Graphics Processing Units (GPUs), operating in parallel for extended periods.
  • Inference, on the other hand, involves using trained models to make predictions or generate responses in real-time, necessitating powerful servers optimized for machine learning algorithms. This surge in demand for AI server hardware is observed across various sectors, including healthcare, finance, and manufacturing, where AI is increasingly being employed for predictive analytics, fraud detection, and automation.

What are the market trends shaping the AI Server Hardware Industry?

  • The trend in the market involves the exponential growth of generative AI. Generative AI is experiencing significant expansion in various industries.
  • The market experiences continuous growth due to the increasing demand for advanced artificial intelligence applications. The computational needs for training and deploying sophisticated generative AI models are significantly greater than those for traditional AI, leading to a surge in the requirement for specialized, high-performance server infrastructure. These models, such as foundation models, often contain hundreds of billions or even trillions of parameters.
  • Training these models necessitates massive parallel processing capabilities, extensive memory bandwidth, and high-speed interconnects to manage the distribution of workloads across numerous accelerator chips. Consequently, substantial capital expenditure on AI servers is observed among cloud service providers, large enterprises, and well-funded research laboratories. This technical requirement directly fuels the market's expansion.

What challenges does the AI Server Hardware Industry face during its growth?

  • The industry's growth is significantly impeded by severe supply chain constraints and the scarcity of crucial components. 
  • The market experiences a burgeoning demand due to the increasing adoption of artificial intelligence (AI) and machine learning (ML) technologies across various sectors, including healthcare, finance, and manufacturing. However, the market faces a significant challenge from persistent supply chain constraints, specifically for high-performance components. The intricate and highly concentrated semiconductor supply chain creates bottlenecks that directly impact the production and delivery of AI servers. The most acute scarcity exists for advanced AI accelerators, such as high-end GPUs manufactured by Nvidia, and the specialized High Bandwidth Memory (HBM) required for these processors to function optimally.
  • The global capacity to produce these components has not kept pace with the demand, resulting in extended lead times, allocation-based sales, and inflated costs. Despite these challenges, the market continues to grow, driven by the increasing need for faster data processing and advanced analytics capabilities.

Exclusive Technavio Analysis on Customer Landscape

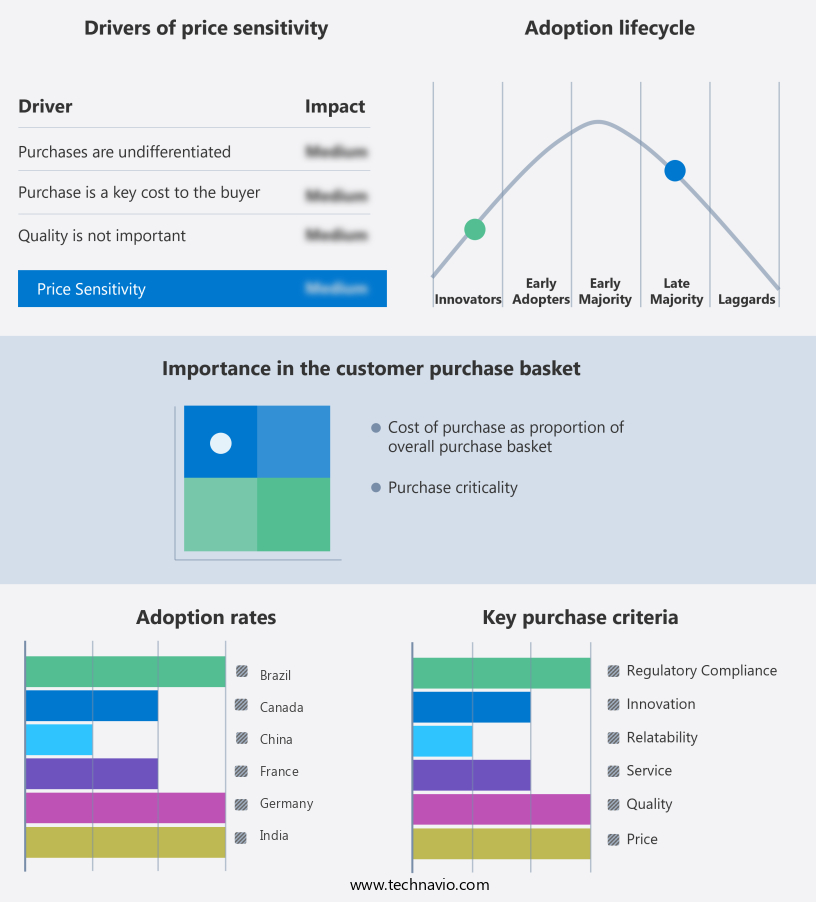
The ai server hardware market forecasting report includes the adoption lifecycle of the market, covering from the innovator's stage to the laggard's stage. It focuses on adoption rates in different regions based on penetration. Furthermore, the ai server hardware market report also includes key purchase criteria and drivers of price sensitivity to help companies evaluate and develop their market growth analysis strategies.

AI Server Hardware Market Share by Geography

 Customer Landscape of AI Server Hardware Industry

Competitive Landscape

Companies are implementing various strategies, such as strategic alliances, ai server hardware market forecast, partnerships, mergers and acquisitions, geographical expansion, and product/service launches, to enhance their presence in the industry.

Advanced Micro Devices Inc. - The Instinct MI300X/MI300A GPUs from an unspecified technology provider present a competitive alternative to NVIDIA GPUs and AMD EPYC CPUs, commonly utilized in artificial intelligence servers. These GPUs offer comparable performance and functionality.

The industry research and growth report includes detailed analyses of the competitive landscape of the market and information about key companies, including:

  • Advanced Micro Devices Inc.
  • Baidu Inc.
  • Broadcom Inc.
  • Cerebras
  • Cisco Systems Inc.
  • Dell Technologies Inc.
  • Google Cloud
  • Graphcore Ltd.
  • Hewlett Packard Enterprise Co.
  • Inspur Group.
  • Intel Corp.
  • International Business Machines Corp.
  • Lenovo Group Ltd.
  • Microsoft Corp.
  • NVIDIA Corp.
  • SambaNova Systems Inc.
  • Super Micro Computer Inc.
  • Tenstorrent Inc.

Qualitative and quantitative analysis of companies has been conducted to help clients understand the wider business environment as well as the strengths and weaknesses of key industry players. Data is qualitatively analyzed to categorize companies as pure play, category-focused, industry-focused, and diversified; it is quantitatively analyzed to categorize companies as dominant, leading, strong, tentative, and weak.

Recent Development and News in AI Server Hardware Market

  • In January 2024, Intel unveiled its new Neural Compute Server, designed specifically for artificial intelligence (AI) workloads. The server, featuring Intel's latest processors, aimed to deliver improved performance and energy efficiency for data centers (Intel Press Release, 2024).
  • In March 2024, NVIDIA and Microsoft announced a strategic partnership to develop and deploy AI solutions using NVIDIA's GPUs on Microsoft's Azure cloud platform. This collaboration was expected to accelerate AI innovation and adoption across industries (NVIDIA Press Release, 2024).
  • In May 2024, Google announced a USD1 billion investment in its data centers to support its AI and machine learning initiatives. This significant investment was aimed at expanding its computing capacity and improving its AI capabilities (Google Press Release, 2024).
  • In January 2025, IBM and NEC Corporation entered into a strategic partnership to develop AI servers using IBM Power Systems and NEC's supercomputing technologies. The collaboration aimed to address the growing demand for AI solutions in various industries (IBM Press Release, 2025).

Dive into Technavio's robust research methodology, blending expert interviews, extensive data synthesis, and validated models for unparalleled AI Server Hardware Market insights. See full methodology.

Market Scope

Report Coverage

Details

Page number

241

Base year

2024

Historic period

2019-2023

Forecast period

2025-2029

Growth momentum & CAGR

Accelerate at a CAGR of 42%

Market growth 2025-2029

USD 358339.2 million

Market structure

Fragmented

YoY growth 2024-2025(%)

9.7

Key countries

US, China, Germany, UK, Japan, France, Canada, Brazil, Italy, and India

Competitive landscape

Leading Companies, Market Positioning of Companies, Competitive Strategies, and Industry Risks

Request Free Sample

Research Analyst Overview

  • The market continues to evolve, driven by advancements in machine learning algorithms and the increasing demand for high-performance computing across various sectors. Recall metrics and hardware security are becoming increasingly important, with power efficiency being a key consideration for data centers. CPU performance and throughput optimization are essential for handling complex machine learning workloads, while sustainability initiatives, such as cooling systems and energy consumption reduction, are gaining traction. For instance, a leading technology company reported a 30% reduction in training time by implementing a modular architecture with distributed computing and GPU acceleration. The industry is expected to grow at a robust pace, with estimates suggesting a 20% annual increase in deep learning framework usage.
  • Hardware security, thermal management, and error rate reduction are critical components of AI server hardware, ensuring system reliability and fault tolerance. Inference speed and parallel processing are crucial for real-time applications, while network bandwidth and storage latency optimization are essential for handling large datasets. Furthermore, server virtualization, RAM capacity, and lifecycle management are becoming increasingly important for managing and scaling AI infrastructure. Data encryption, precision metrics, and model accuracy are essential for maintaining data security and ensuring the effectiveness of AI applications. In conclusion, the market is a dynamic and evolving landscape, with continuous innovation in areas such as hardware security, power efficiency, and machine learning algorithms driving growth and shaping the future of AI infrastructure.

What are the Key Data Covered in this AI Server Hardware Market Research and Growth Report?

  • What is the expected growth of the AI Server Hardware Market between 2025 and 2029?

    • USD 358.34 billion, at a CAGR of 42%

  • What segmentation does the market report cover?

    • The report is segmented by Deployment (Cloud, On premises, and Hybrid), Type (Inference servers and Training servers), Product (GPUs, ASICs, CPUs, FPGAs, and Others), and Geography (North America, Europe, APAC, South America, and Middle East and Africa)

  • Which regions are analyzed in the report?

    • North America, Europe, APAC, South America, and Middle East and Africa

  • What are the key growth drivers and market challenges?

    • Explosive growth of large language models, Severe supply chain constraints and key component scarcity

  • Who are the major players in the AI Server Hardware Market?

    • Advanced Micro Devices Inc., Baidu Inc., Broadcom Inc., Cerebras, Cisco Systems Inc., Dell Technologies Inc., Google Cloud, Graphcore Ltd., Hewlett Packard Enterprise Co., Inspur Group., Intel Corp., International Business Machines Corp., Lenovo Group Ltd., Microsoft Corp., NVIDIA Corp., SambaNova Systems Inc., Super Micro Computer Inc., and Tenstorrent Inc.

Market Research Insights

  • The market is a dynamic and ever-evolving landscape, with continuous advancements in technology driving innovation. Two significant trends characterize this market. First, the increasing demand for AI applications in various industries has led to a surge in the deployment of AI models, requiring substantial hardware upgrades. For instance, the adoption of AI in healthcare has resulted in a 30% increase in the use of virtual machines for model deployment. Second, industry growth expectations remain strong, with a projected industry-wide growth rate of 25% annually. This growth is fueled by the increasing need for operational efficiency, with organizations seeking to optimize resource utilization and improve performance benchmarking through the use of advanced hardware solutions, such as DDR memory, liquid cooling, and redundant power supplies.
  • Additionally, the integration of tensor processing units and FPGA acceleration has led to significant improvements in real-time processing capabilities. These advancements are crucial in enabling organizations to effectively manage large datasets and complex workloads, such as batch processing and feature engineering, while maintaining security protocols and ensuring access control.

We can help! Our analysts can customize this ai server hardware market research report to meet your requirements.

Get in touch

1 Executive Summary

  • 1.1 Market overview
    • Executive Summary - Chart on Market Overview
    • Executive Summary - Data Table on Market Overview
    • Executive Summary - Chart on Global Market Characteristics
    • Executive Summary - Chart on Market by Geography
    • Executive Summary - Chart on Market Segmentation by Deployment
    • Executive Summary - Chart on Market Segmentation by Type
    • Executive Summary - Chart on Market Segmentation by Product
    • Executive Summary - Chart on Incremental Growth
    • Executive Summary - Data Table on Incremental Growth
    • Executive Summary - Chart on Company Market Positioning

2 Technavio Analysis

  • 2.1 Analysis of price sensitivity, lifecycle, customer purchase basket, adoption rates, and purchase criteria
    • Analysis of price sensitivity, lifecycle, customer purchase basket, adoption rates, and purchase criteria
  • 2.2 Criticality of inputs and Factors of differentiation
    • Overview on criticality of inputs and factors of differentiation
  • 2.3 Factors of disruption
    • Overview on factors of disruption
  • 2.4 Impact of drivers and challenges
    • Impact of drivers and challenges in 2024 and 2029

3 Market Landscape

  • 3.1 Market ecosystem
    • Parent Market
    • Data Table on - Parent Market
  • 3.2 Market characteristics
    • Market characteristics analysis
  • 3.3 Value chain analysis
    • Value chain analysis

4 Market Sizing

  • 4.1 Market definition
    • Offerings of companies included in the market definition
  • 4.2 Market segment analysis
    • Market segments
  • 4.3 Market size 2024
    • 4.4 Market outlook: Forecast for 2024-2029
      • Chart on Global - Market size and forecast 2024-2029 ($ million)
      • Data Table on Global - Market size and forecast 2024-2029 ($ million)
      • Chart on Global Market: Year-over-year growth 2024-2029 (%)
      • Data Table on Global Market: Year-over-year growth 2024-2029 (%)

    5 Historic Market Size

    • 5.1 Global AI Server Hardware Market 2019 - 2023
      • Historic Market Size - Data Table on Global AI Server Hardware Market 2019 - 2023 ($ million)
    • 5.2 Deployment segment analysis 2019 - 2023
      • Historic Market Size - Deployment Segment 2019 - 2023 ($ million)
    • 5.3 Type segment analysis 2019 - 2023
      • Historic Market Size - Type Segment 2019 - 2023 ($ million)
    • 5.4 Product segment analysis 2019 - 2023
      • Historic Market Size - Product Segment 2019 - 2023 ($ million)
    • 5.5 Geography segment analysis 2019 - 2023
      • Historic Market Size - Geography Segment 2019 - 2023 ($ million)
    • 5.6 Country segment analysis 2019 - 2023
      • Historic Market Size - Country Segment 2019 - 2023 ($ million)

    6 Five Forces Analysis

    • 6.1 Five forces summary
      • Five forces analysis - Comparison between 2024 and 2029
    • 6.2 Bargaining power of buyers
      • Bargaining power of buyers - Impact of key factors 2024 and 2029
    • 6.3 Bargaining power of suppliers
      • Bargaining power of suppliers - Impact of key factors in 2024 and 2029
    • 6.4 Threat of new entrants
      • Threat of new entrants - Impact of key factors in 2024 and 2029
    • 6.5 Threat of substitutes
      • Threat of substitutes - Impact of key factors in 2024 and 2029
    • 6.6 Threat of rivalry
      • Threat of rivalry - Impact of key factors in 2024 and 2029
    • 6.7 Market condition
      • Chart on Market condition - Five forces 2024 and 2029

    7 Market Segmentation by Deployment

    • 7.1 Market segments
      • Chart on Deployment - Market share 2024-2029 (%)
      • Data Table on Deployment - Market share 2024-2029 (%)
    • 7.2 Comparison by Deployment
      • Chart on Comparison by Deployment
      • Data Table on Comparison by Deployment
    • 7.3 Cloud - Market size and forecast 2024-2029
      • Chart on Cloud - Market size and forecast 2024-2029 ($ million)
      • Data Table on Cloud - Market size and forecast 2024-2029 ($ million)
      • Chart on Cloud - Year-over-year growth 2024-2029 (%)
      • Data Table on Cloud - Year-over-year growth 2024-2029 (%)
    • 7.4 On premises - Market size and forecast 2024-2029
      • Chart on On premises - Market size and forecast 2024-2029 ($ million)
      • Data Table on On premises - Market size and forecast 2024-2029 ($ million)
      • Chart on On premises - Year-over-year growth 2024-2029 (%)
      • Data Table on On premises - Year-over-year growth 2024-2029 (%)
    • 7.5 Hybrid - Market size and forecast 2024-2029
      • Chart on Hybrid - Market size and forecast 2024-2029 ($ million)
      • Data Table on Hybrid - Market size and forecast 2024-2029 ($ million)
      • Chart on Hybrid - Year-over-year growth 2024-2029 (%)
      • Data Table on Hybrid - Year-over-year growth 2024-2029 (%)
    • 7.6 Market opportunity by Deployment
      • Market opportunity by Deployment ($ million)
      • Data Table on Market opportunity by Deployment ($ million)

    8 Market Segmentation by Type

    • 8.1 Market segments
      • Chart on Type - Market share 2024-2029 (%)
      • Data Table on Type - Market share 2024-2029 (%)
    • 8.2 Comparison by Type
      • Chart on Comparison by Type
      • Data Table on Comparison by Type
    • 8.3 Inference servers - Market size and forecast 2024-2029
      • Chart on Inference servers - Market size and forecast 2024-2029 ($ million)
      • Data Table on Inference servers - Market size and forecast 2024-2029 ($ million)
      • Chart on Inference servers - Year-over-year growth 2024-2029 (%)
      • Data Table on Inference servers - Year-over-year growth 2024-2029 (%)
    • 8.4 Training servers - Market size and forecast 2024-2029
      • Chart on Training servers - Market size and forecast 2024-2029 ($ million)
      • Data Table on Training servers - Market size and forecast 2024-2029 ($ million)
      • Chart on Training servers - Year-over-year growth 2024-2029 (%)
      • Data Table on Training servers - Year-over-year growth 2024-2029 (%)
    • 8.5 Market opportunity by Type
      • Market opportunity by Type ($ million)
      • Data Table on Market opportunity by Type ($ million)

    9 Market Segmentation by Product

    • 9.1 Market segments
      • Chart on Product - Market share 2024-2029 (%)
      • Data Table on Product - Market share 2024-2029 (%)
    • 9.2 Comparison by Product
      • Chart on Comparison by Product
      • Data Table on Comparison by Product
    • 9.3 GPUs - Market size and forecast 2024-2029
      • Chart on GPUs - Market size and forecast 2024-2029 ($ million)
      • Data Table on GPUs - Market size and forecast 2024-2029 ($ million)
      • Chart on GPUs - Year-over-year growth 2024-2029 (%)
      • Data Table on GPUs - Year-over-year growth 2024-2029 (%)
    • 9.4 ASICs - Market size and forecast 2024-2029
      • Chart on ASICs - Market size and forecast 2024-2029 ($ million)
      • Data Table on ASICs - Market size and forecast 2024-2029 ($ million)
      • Chart on ASICs - Year-over-year growth 2024-2029 (%)
      • Data Table on ASICs - Year-over-year growth 2024-2029 (%)
    • 9.5 CPUs - Market size and forecast 2024-2029
      • Chart on CPUs - Market size and forecast 2024-2029 ($ million)
      • Data Table on CPUs - Market size and forecast 2024-2029 ($ million)
      • Chart on CPUs - Year-over-year growth 2024-2029 (%)
      • Data Table on CPUs - Year-over-year growth 2024-2029 (%)
    • 9.6 FPGAs - Market size and forecast 2024-2029
      • Chart on FPGAs - Market size and forecast 2024-2029 ($ million)
      • Data Table on FPGAs - Market size and forecast 2024-2029 ($ million)
      • Chart on FPGAs - Year-over-year growth 2024-2029 (%)
      • Data Table on FPGAs - Year-over-year growth 2024-2029 (%)
    • 9.7 Others - Market size and forecast 2024-2029
      • Chart on Others - Market size and forecast 2024-2029 ($ million)
      • Data Table on Others - Market size and forecast 2024-2029 ($ million)
      • Chart on Others - Year-over-year growth 2024-2029 (%)
      • Data Table on Others - Year-over-year growth 2024-2029 (%)
    • 9.8 Market opportunity by Product
      • Market opportunity by Product ($ million)
      • Data Table on Market opportunity by Product ($ million)

    10 Customer Landscape

    • 10.1 Customer landscape overview
      • Analysis of price sensitivity, lifecycle, customer purchase basket, adoption rates, and purchase criteria

    11 Geographic Landscape

    • 11.1 Geographic segmentation
      • Chart on Market share by geography 2024-2029 (%)
      • Data Table on Market share by geography 2024-2029 (%)
    • 11.2 Geographic comparison
      • Chart on Geographic comparison
      • Data Table on Geographic comparison
    • 11.3 North America - Market size and forecast 2024-2029
      • Chart on North America - Market size and forecast 2024-2029 ($ million)
      • Data Table on North America - Market size and forecast 2024-2029 ($ million)
      • Chart on North America - Year-over-year growth 2024-2029 (%)
      • Data Table on North America - Year-over-year growth 2024-2029 (%)
    • 11.4 Europe - Market size and forecast 2024-2029
      • Chart on Europe - Market size and forecast 2024-2029 ($ million)
      • Data Table on Europe - Market size and forecast 2024-2029 ($ million)
      • Chart on Europe - Year-over-year growth 2024-2029 (%)
      • Data Table on Europe - Year-over-year growth 2024-2029 (%)
    • 11.5 APAC - Market size and forecast 2024-2029
      • Chart on APAC - Market size and forecast 2024-2029 ($ million)
      • Data Table on APAC - Market size and forecast 2024-2029 ($ million)
      • Chart on APAC - Year-over-year growth 2024-2029 (%)
      • Data Table on APAC - Year-over-year growth 2024-2029 (%)
    • 11.6 South America - Market size and forecast 2024-2029
      • Chart on South America - Market size and forecast 2024-2029 ($ million)
      • Data Table on South America - Market size and forecast 2024-2029 ($ million)
      • Chart on South America - Year-over-year growth 2024-2029 (%)
      • Data Table on South America - Year-over-year growth 2024-2029 (%)
    • 11.7 Middle East and Africa - Market size and forecast 2024-2029
      • Chart on Middle East and Africa - Market size and forecast 2024-2029 ($ million)
      • Data Table on Middle East and Africa - Market size and forecast 2024-2029 ($ million)
      • Chart on Middle East and Africa - Year-over-year growth 2024-2029 (%)
      • Data Table on Middle East and Africa - Year-over-year growth 2024-2029 (%)
    • 11.8 US - Market size and forecast 2024-2029
      • Chart on US - Market size and forecast 2024-2029 ($ million)
      • Data Table on US - Market size and forecast 2024-2029 ($ million)
      • Chart on US - Year-over-year growth 2024-2029 (%)
      • Data Table on US - Year-over-year growth 2024-2029 (%)
    • 11.9 China - Market size and forecast 2024-2029
      • Chart on China - Market size and forecast 2024-2029 ($ million)
      • Data Table on China - Market size and forecast 2024-2029 ($ million)
      • Chart on China - Year-over-year growth 2024-2029 (%)
      • Data Table on China - Year-over-year growth 2024-2029 (%)
    • 11.10 Germany - Market size and forecast 2024-2029
      • Chart on Germany - Market size and forecast 2024-2029 ($ million)
      • Data Table on Germany - Market size and forecast 2024-2029 ($ million)
      • Chart on Germany - Year-over-year growth 2024-2029 (%)
      • Data Table on Germany - Year-over-year growth 2024-2029 (%)
    • 11.11 UK - Market size and forecast 2024-2029
      • Chart on UK - Market size and forecast 2024-2029 ($ million)
      • Data Table on UK - Market size and forecast 2024-2029 ($ million)
      • Chart on UK - Year-over-year growth 2024-2029 (%)
      • Data Table on UK - Year-over-year growth 2024-2029 (%)
    • 11.12 Japan - Market size and forecast 2024-2029
      • Chart on Japan - Market size and forecast 2024-2029 ($ million)
      • Data Table on Japan - Market size and forecast 2024-2029 ($ million)
      • Chart on Japan - Year-over-year growth 2024-2029 (%)
      • Data Table on Japan - Year-over-year growth 2024-2029 (%)
    • 11.13 France - Market size and forecast 2024-2029
      • Chart on France - Market size and forecast 2024-2029 ($ million)
      • Data Table on France - Market size and forecast 2024-2029 ($ million)
      • Chart on France - Year-over-year growth 2024-2029 (%)
      • Data Table on France - Year-over-year growth 2024-2029 (%)
    • 11.14 Canada - Market size and forecast 2024-2029
      • Chart on Canada - Market size and forecast 2024-2029 ($ million)
      • Data Table on Canada - Market size and forecast 2024-2029 ($ million)
      • Chart on Canada - Year-over-year growth 2024-2029 (%)
      • Data Table on Canada - Year-over-year growth 2024-2029 (%)
    • 11.15 Brazil - Market size and forecast 2024-2029
      • Chart on Brazil - Market size and forecast 2024-2029 ($ million)
      • Data Table on Brazil - Market size and forecast 2024-2029 ($ million)
      • Chart on Brazil - Year-over-year growth 2024-2029 (%)
      • Data Table on Brazil - Year-over-year growth 2024-2029 (%)
    • 11.16 India - Market size and forecast 2024-2029
      • Chart on India - Market size and forecast 2024-2029 ($ million)
      • Data Table on India - Market size and forecast 2024-2029 ($ million)
      • Chart on India - Year-over-year growth 2024-2029 (%)
      • Data Table on India - Year-over-year growth 2024-2029 (%)
    • 11.17 Italy - Market size and forecast 2024-2029
      • Chart on Italy - Market size and forecast 2024-2029 ($ million)
      • Data Table on Italy - Market size and forecast 2024-2029 ($ million)
      • Chart on Italy - Year-over-year growth 2024-2029 (%)
      • Data Table on Italy - Year-over-year growth 2024-2029 (%)
    • 11.18 Market opportunity by geography
      • Market opportunity by geography ($ million)
      • Data Tables on Market opportunity by geography ($ million)

    12 Drivers, Challenges, and Opportunity/Restraints

    • 12.1 Market drivers
      • 12.2 Market challenges
        • 12.3 Impact of drivers and challenges
          • Impact of drivers and challenges in 2024 and 2029
        • 12.4 Market opportunities/restraints

          13 Competitive Landscape

          • 13.1 Overview
            • 13.2 Competitive Landscape
              • Overview on criticality of inputs and factors of differentiation
            • 13.3 Landscape disruption
              • Overview on factors of disruption
            • 13.4 Industry risks
              • Impact of key risks on business

            14 Competitive Analysis

            • 14.1 Companies profiled
              • Companies covered
            • 14.2 Company ranking index
              • Company ranking index
            • 14.3 Market positioning of companies
              • Matrix on companies position and classification
            • 14.4 Advanced Micro Devices Inc.
              • Advanced Micro Devices Inc. - Overview
              • Advanced Micro Devices Inc. - Business segments
              • Advanced Micro Devices Inc. - Key news
              • Advanced Micro Devices Inc. - Key offerings
              • Advanced Micro Devices Inc. - Segment focus
              • SWOT
            • 14.5 Broadcom Inc.
              • Broadcom Inc. - Overview
              • Broadcom Inc. - Business segments
              • Broadcom Inc. - Key news
              • Broadcom Inc. - Key offerings
              • Broadcom Inc. - Segment focus
              • SWOT
            • 14.6 Cisco Systems Inc.
              • Cisco Systems Inc. - Overview
              • Cisco Systems Inc. - Business segments
              • Cisco Systems Inc. - Key news
              • Cisco Systems Inc. - Key offerings
              • Cisco Systems Inc. - Segment focus
              • SWOT
            • 14.7 Dell Technologies Inc.
              • Dell Technologies Inc. - Overview
              • Dell Technologies Inc. - Business segments
              • Dell Technologies Inc. - Key news
              • Dell Technologies Inc. - Key offerings
              • Dell Technologies Inc. - Segment focus
              • SWOT
            • 14.8 Google Cloud
              • Google Cloud - Overview
              • Google Cloud - Product / Service
              • Google Cloud - Key offerings
              • SWOT
            • 14.9 Graphcore Ltd.
              • Graphcore Ltd. - Overview
              • Graphcore Ltd. - Product / Service
              • Graphcore Ltd. - Key offerings
              • SWOT
            • 14.10 Hewlett Packard Enterprise Co.
              • Hewlett Packard Enterprise Co. - Overview
              • Hewlett Packard Enterprise Co. - Business segments
              • Hewlett Packard Enterprise Co. - Key news
              • Hewlett Packard Enterprise Co. - Key offerings
              • Hewlett Packard Enterprise Co. - Segment focus
              • SWOT
            • 14.11 Inspur Group.
              • Inspur Group. - Overview
              • Inspur Group. - Product / Service
              • Inspur Group. - Key offerings
              • SWOT
            • 14.12 Intel Corp.
              • Intel Corp. - Overview
              • Intel Corp. - Business segments
              • Intel Corp. - Key news
              • Intel Corp. - Key offerings
              • Intel Corp. - Segment focus
              • SWOT
            • 14.13 International Business Machines Corp.
              • International Business Machines Corp. - Overview
              • International Business Machines Corp. - Business segments
              • International Business Machines Corp. - Key news
              • International Business Machines Corp. - Key offerings
              • International Business Machines Corp. - Segment focus
              • SWOT
            • 14.14 Microsoft Corp.
              • Microsoft Corp. - Overview
              • Microsoft Corp. - Business segments
              • Microsoft Corp. - Key news
              • Microsoft Corp. - Key offerings
              • Microsoft Corp. - Segment focus
              • SWOT
            • 14.15 NVIDIA Corp.
              • NVIDIA Corp. - Overview
              • NVIDIA Corp. - Business segments
              • NVIDIA Corp. - Key news
              • NVIDIA Corp. - Key offerings
              • NVIDIA Corp. - Segment focus
              • SWOT
            • 14.16 SambaNova Systems Inc.
              • SambaNova Systems Inc. - Overview
              • SambaNova Systems Inc. - Product / Service
              • SambaNova Systems Inc. - Key offerings
              • SWOT
            • 14.17 Super Micro Computer Inc.
              • Super Micro Computer Inc. - Overview
              • Super Micro Computer Inc. - Business segments
              • Super Micro Computer Inc. - Key news
              • Super Micro Computer Inc. - Key offerings
              • Super Micro Computer Inc. - Segment focus
              • SWOT
            • 14.18 Tenstorrent Inc.
              • Tenstorrent Inc. - Overview
              • Tenstorrent Inc. - Product / Service
              • Tenstorrent Inc. - Key offerings
              • SWOT

            15 Appendix

            • 15.1 Scope of the report
              • 15.2 Inclusions and exclusions checklist
                • Inclusions checklist
                • Exclusions checklist
              • 15.3 Currency conversion rates for US$
                • Currency conversion rates for US$
              • 15.4 Research methodology
                • Research methodology
              • 15.5 Data procurement
                • Information sources
              • 15.6 Data validation
                • Data validation
              • 15.7 Validation techniques employed for market sizing
                • Validation techniques employed for market sizing
              • 15.8 Data synthesis
                • Data synthesis
              • 15.9 360 degree market analysis
                • 360 degree market analysis
              • 15.10 List of abbreviations
                • List of abbreviations

              Research Methodology

              Technavio presents a detailed picture of the market by way of study, synthesis, and summation of data from multiple sources. The analysts have presented the various facets of the market with a particular focus on identifying the key industry influencers. The data thus presented is comprehensive, reliable, and the result of extensive research, both primary and secondary.

              INFORMATION SOURCES

              Primary sources

              • Manufacturers and suppliers
              • Channel partners
              • Industry experts
              • Strategic decision makers

              Secondary sources

              • Industry journals and periodicals
              • Government data
              • Financial reports of key industry players
              • Historical data
              • Press releases

              DATA ANALYSIS

              Data Synthesis

              • Collation of data
              • Estimation of key figures
              • Analysis of derived insights

              Data Validation

              • Triangulation with data models
              • Reference against proprietary databases
              • Corroboration with industry experts

              REPORT WRITING

              Qualitative

              • Market drivers
              • Market challenges
              • Market trends
              • Five forces analysis

              Quantitative

              • Market size and forecast
              • Market segmentation
              • Geographical insights
              • Competitive landscape

              Interested in this report?

              Get your sample now to see our research methodology and insights!

              Download Now

              Frequently Asked Questions

              Ai Server Hardware market growth will increase by $ 358339.2 mn during 2025-2029 .

              The Ai Server Hardware market is expected to grow at a CAGR of 42% during 2025-2029 .

              Ai Server Hardware market is segmented by Deployment( Cloud, On premises, Hybrid) Type( Inference servers, Training servers) Product( GPUs, ASICs, CPUs, FPGAs, Others)

              Advanced Micro Devices Inc., Baidu Inc., Broadcom Inc., Cerebras, Cisco Systems Inc., Dell Technologies Inc., Google Cloud, Graphcore Ltd., Hewlett Packard Enterprise Co., Inspur Group., Intel Corp., International Business Machines Corp., Lenovo Group Ltd., Microsoft Corp., NVIDIA Corp., SambaNova Systems Inc., Super Micro Computer Inc., Tenstorrent Inc. are a few of the key vendors in the Ai Server Hardware market.

              North America will register the highest growth rate of 36% among the other regions. Therefore, the Ai Server Hardware market in North America is expected to garner significant business opportunities for the vendors during the forecast period.

              US, China, Germany, UK, Japan, France, Canada, Brazil, Italy, India

              • Explosive growth of large language modelsThe single most potent driver propelling the global AI server hardware market is the exponential proliferation and escalating complexity of large language models (LLMs). The paradigm shift from traditional analytical AI to generative models is the driving factor this market.
              • which create new content is the driving factor this market.
              • has precipitated an unprecedented demand for computational power that far exceeds previous requirements. This demand is bifurcated into two distinct but equally critical workloads: model training and inference. Training large foundational models is the driving factor this market.
              • such as those developed by OpenAI is the driving factor this market.
              • Google is the driving factor this market.
              • and Meta is the driving factor this market.
              • is an immensely capital and compute intensive process is the driving factor this market.
              • requiring vast clusters of interconnected servers equipped with top tier accelerators is the driving factor this market.
              • primarily Graphics Processing Units (GPUs) is the driving factor this market.
              • operating in parallel for weeks or months. The subsequent and more widespread workload is the driving factor this market.
              • inference is the driving factor this market.
              • involves running these trained models to generate responses for end users. While a single inference query is less intensive than training is the driving factor this market.
              • the sheer volume of queries from millions of users necessitates a massive is the driving factor this market.
              • globally distributed fleet of inference optimized servers. This dual-sided demand creates a continuous and escalating procurement cycle for advanced AI hardware. Several recent instances underscore this trend. In March 2023 is the driving factor this market.
              • OpenAI released GPT-4 is the driving factor this market.
              • a large multimodal model exhibiting a significant leap in complexity and capability over its predecessor. The successful training and deployment of such a model relied on a bespoke supercomputing infrastructure is the driving factor this market.
              • reportedly comprising tens of thousands of high performance GPUs. This event not only set a new benchmark for AI capabilities but also signaled to the market the immense hardware investment required to remain at the leading edge of AI development. Similarly is the driving factor this market.
              • in December 2023 is the driving factor this market.
              • Google introduced its Gemini family of models is the driving factor this market.
              • including the highly capable Gemini Ultra is the driving factor this market.
              • which was explicitly designed to compete with and surpass GPT-4. Googles ability to develop Gemini is directly tied to its extensive internal hardware ecosystem is the driving factor this market.
              • including its custom Tensor Processing Units (TPUs) and large scale GPU deployments is the driving factor this market.
              • highlighting that participation in the top tier of AI research is predicated on access to massive computational resources. A further catalyst is the open source movement within the LLM space. In July 2023 is the driving factor this market.
              • Meta released Llama 2 as a largely open source model available for commercial use. This strategic move democratized access to powerful foundational models is the driving factor this market.
              • enabling a far broader range of companies is the driving factor this market.
              • startups is the driving factor this market.
              • and academic institutions to build their own specialized AI applications. This has ignited a secondary wave of hardware demand is the driving factor this market.
              • as these entities now require their own server infrastructure is the driving factor this market.
              • whether on premises or through cloud providers is the driving factor this market.
              • to fine tune and serve these models. The subsequent release of the even more capable Llama 3 model in April 2024 further amplified this effect is the driving factor this market.
              • creating a robust market segment beyond the handful of hyperscale AI laboratories. This software-driven demand cycle directly fuels hardware innovation and sales. In response to this insatiable need for more powerful processors is the driving factor this market.
              • Nvidia is the driving factor this market.
              • the dominant market leader is the driving factor this market.
              • unveiled its Blackwell GPU architecture in March 2024. The B200 GPU is the driving factor this market.
              • the flagship of this platform is the driving factor this market.
              • promises a substantial increase in both training and inference performance over its already sought after predecessor is the driving factor this market.
              • the H100. The immediate and overwhelming interest from all major cloud providers and AI companies for the Blackwell platform serves as a clear indicator that the demand for increasingly powerful AI server hardware is not only sustained but is is the driving factor this market.
              • in fact is the driving factor this market.
              • accelerating is the driving factor this market.
              • with no apparent ceiling in the near term. is the driving factor this market.

              The Ai Server Hardware market vendors should focus on grabbing business opportunities from the Cloud segment as it accounted for the largest market share in the base year.