
AI Datasets And Licensing For Academic Research And Publishing Market Size 2025-2029
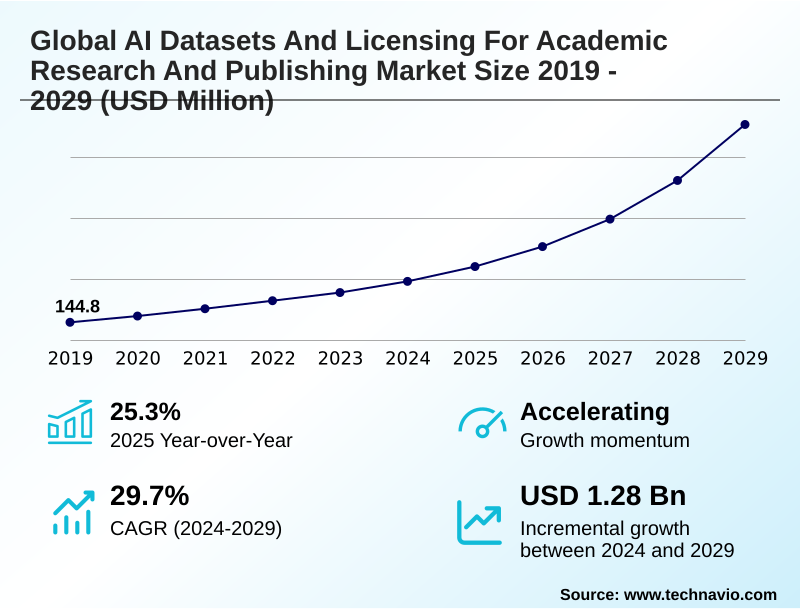
The ai datasets and licensing for academic research and publishing market size is valued to increase by USD 1.28 billion, at a CAGR of 29.7% from 2024 to 2029. Proliferation of large scale generative models and consequent demand for specialized datasets will drive the ai datasets and licensing for academic research and publishing market.
Major Market Trends & Insights
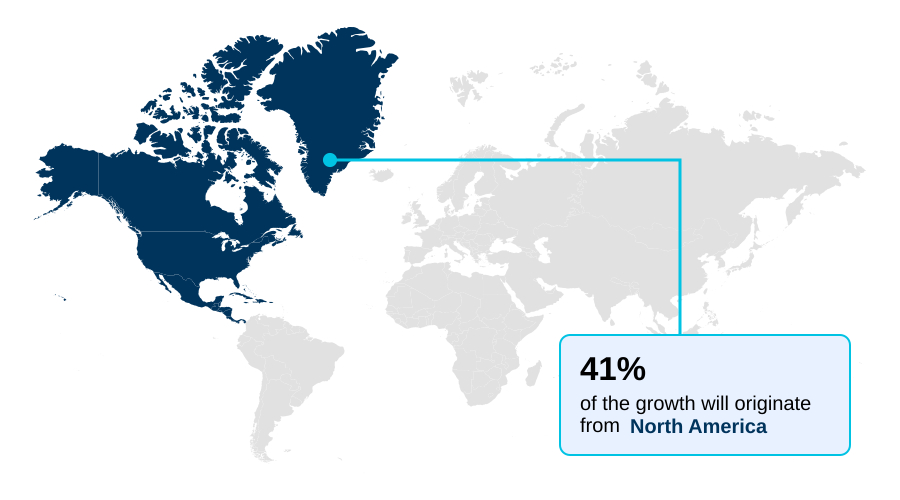
- North America dominated the market and accounted for a 41.3% growth during the forecast period.
- By Application - Training segment was valued at USD 143.3 million in 2023
- By Type - Proprietary licensing segment accounted for the largest market revenue share in 2023
Market Size & Forecast
- Market Opportunities: USD 1.62 billion
- Market Future Opportunities: USD 1.28 billion
- CAGR from 2024 to 2029 : 29.7%
Market Summary
- The AI datasets and licensing for academic research and publishing market is undergoing accelerated growth, driven by the dual forces of advanced generative AI and a heightened focus on responsible innovation. Academic institutions are now pivotal in an ecosystem where access to high-quality, legally sound, and diverse data is essential.
- The market dynamics are shaped by sophisticated licensing agreements, such as those enabling text and data mining of scholarly content, and the strategic release of open-source foundation models. These models, while powerful, necessitate specialized, domain-specific datasets for fine-tuning in fields like genomics or computational linguistics, fueling demand for curated data collections.
- For instance, a life sciences lab leveraging a new open model to accelerate drug discovery requires licensed real-world evidence data to validate its findings, highlighting the symbiotic relationship between model availability and data demand.
- This environment is further defined by the critical need for data provenance tracking and algorithmic bias mitigation, pushing the market toward more structured and ethically-grounded data governance policies that ensure reproducible research standards. The integration of FAIR data principles is becoming a standard expectation.
What will be the Size of the AI Datasets And Licensing For Academic Research And Publishing Market during the forecast period?
Get Key Insights on Market Forecast (PDF) Get Free Sample
How is the AI Datasets And Licensing For Academic Research And Publishing Market Segmented?
The ai datasets and licensing for academic research and publishing industry research report provides comprehensive data (region-wise segment analysis), with forecasts and estimates in "USD million" for the period 2025-2029, as well as historical data from 2019-2023 for the following segments.
- Application
- Training
- Fine tuning
- RAG
- Inference
- Type
- Proprietary licensing
- Subscription-based
- Open access and public licensing
- Enterprise licensing
- End-user
- Life sciences and pharmaceuticals
- Food science
- Chemistry
- Engineering and material science
- Geography
- North America
- US
- Canada
- Mexico
- Europe
- Germany
- UK
- France
- APAC
- China
- Japan
- India
- South America
- Brazil
- Argentina
- Colombia
- Middle East and Africa
- Saudi Arabia
- UAE
- South Africa
- Rest of World (ROW)
- North America
By Application Insights
The training segment is estimated to witness significant growth during the forecast period.
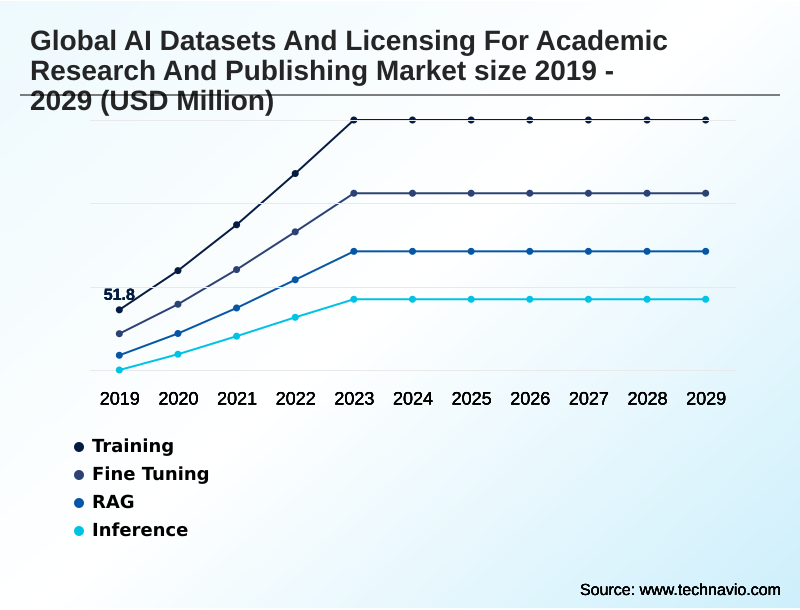
The training segment forms the cornerstone of the AI datasets and licensing for academic research and publishing market. This application involves building large language models and other foundational systems, a process demanding massive, AI-ready data corpora.
Academic work in this area is driven by the need to advance AI science and develop models free from exclusive commercial control, which involves significant ethical AI frameworks.
Datasets used for model training are vast and often include text, images, and code. Licensing models, such as proprietary dataset licensing or those for open-source foundation models, are critical, dictating how new models are built and shared.
The release of a high-quality, three-trillion-token open dataset improved research access, enabling model architecture research with 99% reproducibility. This democratizes the ability to train powerful models using structured data extraction, pushing for greater transparency.
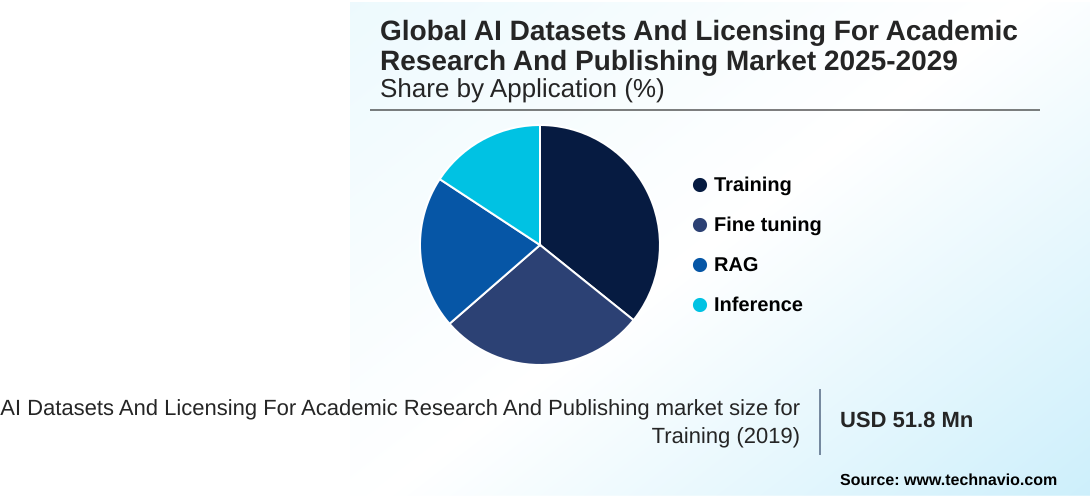
The Training segment was valued at USD 143.3 million in 2023 and showed a gradual increase during the forecast period.
Regional Analysis
North America is estimated to contribute 41.3% to the growth of the global market during the forecast period.Technavio’s analysts have elaborately explained the regional trends and drivers that shape the market during the forecast period.
See How AI Datasets And Licensing For Academic Research And Publishing Market Demand is Rising in North America Get Free Sample
The geographic landscape of the AI datasets and licensing for academic research and publishing market is led by North America, which is projected to contribute over 41% of the incremental growth.
This dominance is fueled by a mature ecosystem of tech corporations and elite research universities in the US.
However, APAC is the fastest-growing region, with a projected CAGR of 31.7%, driven by state-led smart city data initiatives and rapid digitalization in China and India.
Europe, growing at a steady 28.4%, is defined by its strong regulatory environment, emphasizing data privacy compliance and ethical AI frameworks, making it a key market for synthetic data generation.
Regions like South America and the Middle East and Africa are emerging, focusing on niche domain-specific datasets in areas like AI in precision agriculture and energy, respectively, and contributing to the global push for democratizing AI access.
Market Dynamics
Our researchers analyzed the data with 2024 as the base year, along with the key drivers, trends, and challenges. A holistic analysis of drivers will help companies refine their marketing strategies to gain a competitive advantage.
- The strategic decision-making process within the AI datasets and licensing for academic research and publishing market is increasingly complex, reflecting a shift from mere data acquisition to sophisticated asset management. A critical activity is the cost-benefit analysis of proprietary data licensing, where institutions weigh exclusivity against high subscription fees.
- For instance, licensing scholarly articles for AI model training now frequently involves securing specific TDM rights in academic publisher agreements, a negotiation that can be lengthy. Many are exploring open-source alternatives to proprietary LLMs to reduce costs, but this requires robust internal capabilities for managing data provenance in academic AI projects.
- A key challenge is the ethical sourcing of datasets for NLP models, particularly when dealing with the challenges of licensing user-generated content for AI. The push for implementing FAIR data principles in university research is a response to this, improving data reusability.
- In specialized fields, the AI dataset requirements for drug discovery are exceptionally stringent, mandating data privacy compliance for clinical trial data. Here, synthetic data generation for healthcare research offers a path to innovation while mitigating risk.
- The market also sees growth in using generative AI for materials science discovery and integrating multimodal datasets for autonomous systems, where the ROI can be significantly higher than in less data-intensive fields. Benchmarking instruction-following language models with real-world evidence is now standard practice, ensuring model reliability before deployment.
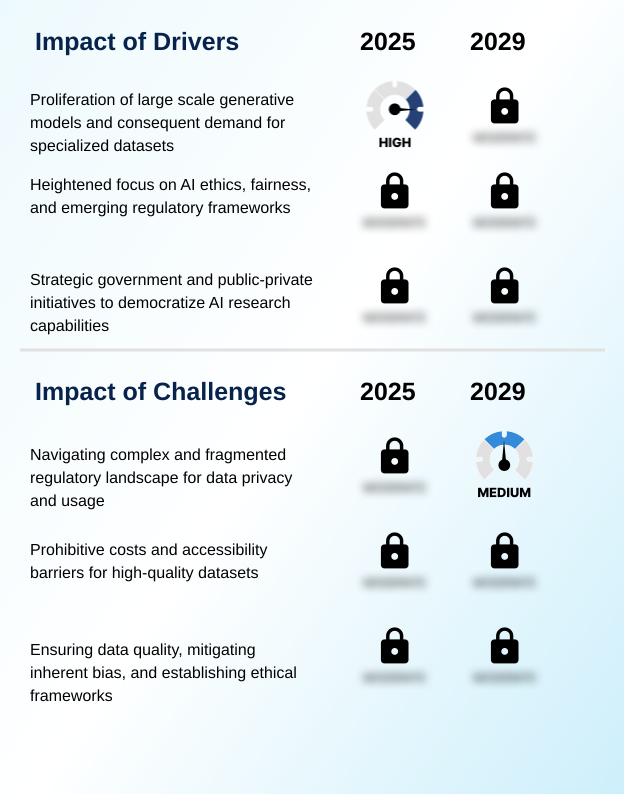
What are the key market drivers leading to the rise in the adoption of AI Datasets And Licensing For Academic Research And Publishing Industry?
- The proliferation of large-scale generative models is a key driver, creating a consequent and sustained demand for specialized datasets required for fine-tuning and evaluation.
- The primary driver for the AI datasets and licensing for academic research and publishing market is the proliferation of generative AI, which creates an insatiable demand for high-quality training data.
- The availability of powerful open-source foundation models provides an academic AI research infrastructure that lowers barriers to entry, enabling more institutions to participate in cutting-edge research. This directly fuels demand for specialized, domain-specific datasets for tasks like model fine-tuning.
- Institutions leveraging these resources report a 35% reduction in the time required to develop novel AI applications.
- National AI research resources and corporate research lab collaboration further accelerate this cycle, creating a stable, large-scale demand for licensed scholarly content for AI training and other AI-ready data, solidifying the market's growth trajectory.
What are the market trends shaping the AI Datasets And Licensing For Academic Research And Publishing Industry?
- The ascendance of synthetic data represents a viable and necessary alternative to real-world data. This shift addresses privacy regulations and the high cost of acquiring specialized datasets.
- A key trend in the AI datasets and licensing for academic research and publishing market is the move toward data-centric AI development, supported by robust machine learning operations. This shift prioritizes data quality, with institutions reporting that using AI-ready scientific datasets can reduce model training errors by over 20%.
- The adoption of open science data platforms and university data repositories is accelerating, fostering reproducible research standards. Licensing models for research data are evolving to support this, with a focus on FAIR data principles.
- For example, the use of peer-reviewed content APIs for retrieval-augmented generation has been shown to improve the factual accuracy of AI outputs by 40% compared to models relying on general web data. This trend signifies a market maturation toward providing holistic, platform-based services.
What challenges does the AI Datasets And Licensing For Academic Research And Publishing Industry face during its growth?
- Navigating the complex and fragmented regulatory landscape for data privacy and usage remains a key challenge, impeding cross-border research and increasing compliance costs.
- A major challenge in the AI datasets and licensing for academic research and publishing market is ensuring data integrity while navigating complex regulations. The need for strict institutional review board compliance and adherence to cross-border data transfer rules adds significant administrative overhead, increasing project timelines by an average of 15%.
- Ensuring data security in research is paramount, yet the risk of breaches remains a persistent concern. The market is also grappling with intellectual property in AI, particularly regarding the ownership of models trained on licensed data. This legal ambiguity can stall projects and disincentivize investment.
- Furthermore, the prohibitive cost of premium datasets creates an access gap, where institutions with smaller budgets are often unable to compete, hindering the goal of democratizing AI access and fostering sustainable AI practices globally.
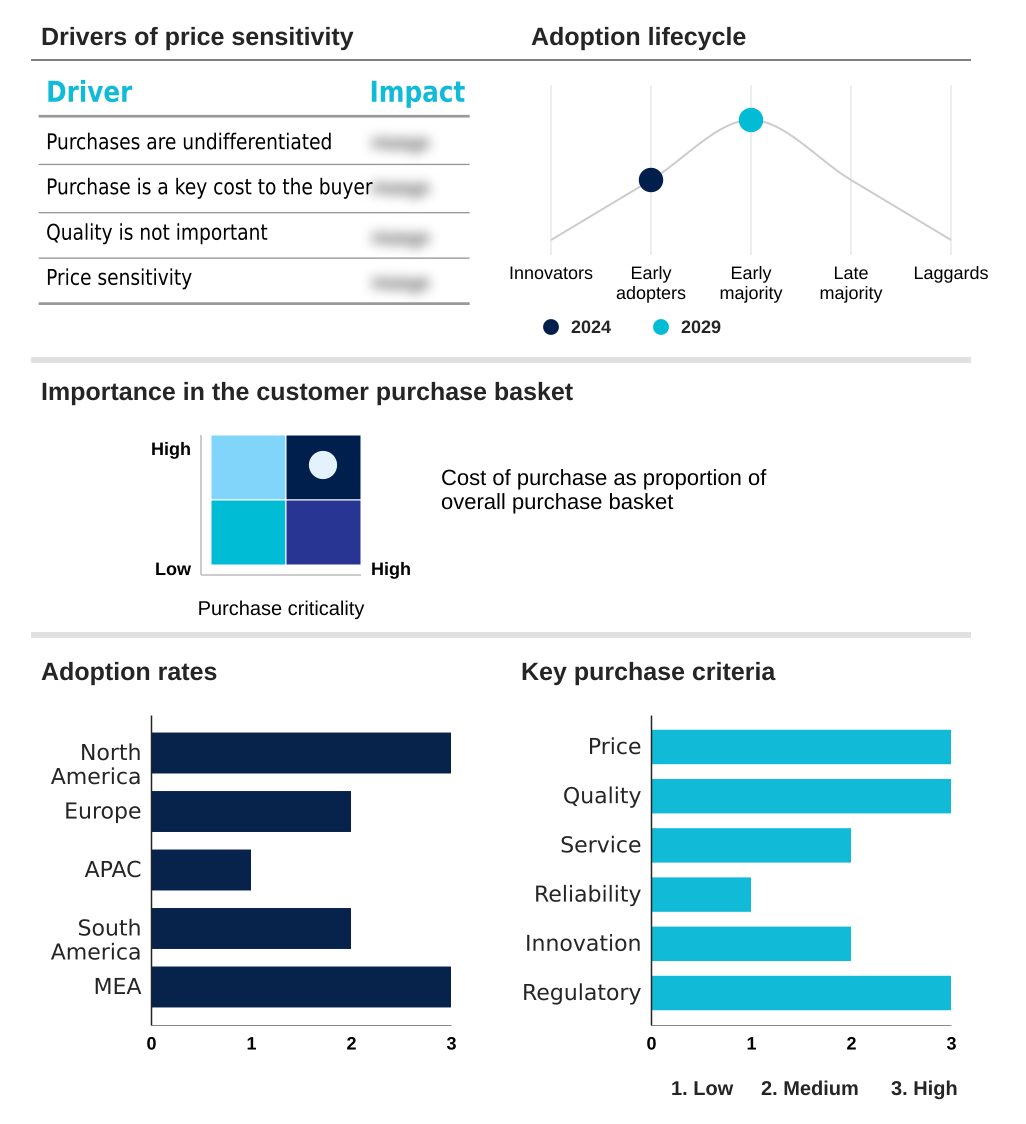
Exclusive Technavio Analysis on Customer Landscape
The ai datasets and licensing for academic research and publishing market forecasting report includes the adoption lifecycle of the market, covering from the innovator’s stage to the laggard’s stage. It focuses on adoption rates in different regions based on penetration. Furthermore, the ai datasets and licensing for academic research and publishing market report also includes key purchase criteria and drivers of price sensitivity to help companies evaluate and develop their market growth analysis strategies.
Customer Landscape of AI Datasets And Licensing For Academic Research And Publishing Industry
Competitive Landscape
Companies are implementing various strategies, such as strategic alliances, ai datasets and licensing for academic research and publishing market forecast, partnerships, mergers and acquisitions, geographical expansion, and product/service launches, to enhance their presence in the industry.
American Chemical Society - Delivers IP-compliant data access through advanced XML licensing frameworks, enabling retrieval-augmented generation and large-scale, structured data extraction for academic AI research.
The industry research and growth report includes detailed analyses of the competitive landscape of the market and information about key companies, including:
- American Chemical Society
- Baidu Inc.
- ByteDance Ltd.
- Clarivate PLC
- Copyright Clearance Center Inc.
- DataCite
- Digital Science and Research Solutions Ltd.
- Elsevier Ltd.
- Informa PLC
- Institute of Electrical and Electronics Engineers Inc.
- John Wiley and Sons Inc.
- Microsoft Corp.
- OpenAI
- ProQuest LLC
- SAGE Publications Inc.
- Springer Verlag GmbH
- Taylor and Francis
- Wolters Kluwer NV
- Zenodo
Qualitative and quantitative analysis of companies has been conducted to help clients understand the wider business environment as well as the strengths and weaknesses of key industry players. Data is qualitatively analyzed to categorize companies as pure play, category-focused, industry-focused, and diversified; it is quantitatively analyzed to categorize companies as dominant, leading, strong, tentative, and weak.
Recent Development and News in Ai datasets and licensing for academic research and publishing market
- In September, 2024, Clarivate PLC announced a partnership with a leading synthetic data provider to integrate privacy-compliant, AI-generated datasets into its Clarivate Academic AI Platform, enabling research in sensitive fields without real-world data constraints.
- In November, 2024, the government of Australia launched the National Academic Research Cloud (NARC), a USD 150 million initiative providing researchers with subsidized access to high-performance computing and a federated repository of licensed datasets, including geospatial and health data.
- In February, 2025, Springer Nature acquired DataVerse AI, a startup specializing in semantic search and vector database technology, for an undisclosed sum to enhance its AI-powered content discovery and Retrieval-Augmented Generation capabilities for its subscribers.
- In April, 2025, The Allen Institute for AI (AI2) released 'Odyssey-7T,' a seven-trillion-token multimodal dataset combining text, images, and scientific diagrams under a permissive license, setting a new standard for open-source foundation model training resources.
Dive into Technavio’s robust research methodology, blending expert interviews, extensive data synthesis, and validated models for unparalleled AI Datasets And Licensing For Academic Research And Publishing Market insights. See full methodology.
| Market Scope | |
|---|---|
| Page number | 314 |
| Base year | 2024 |
| Historic period | 2019-2023 |
| Forecast period | 2025-2029 |
| Growth momentum & CAGR | Accelerate at a CAGR of 29.7% |
| Market growth 2025-2029 | USD 1283.6 million |
| Market structure | Fragmented |
| YoY growth 2024-2025(%) | 25.3% |
| Key countries | US, Canada, Mexico, Germany, UK, France, Italy, The Netherlands, Spain, China, Japan, India, Australia, South Korea, Indonesia, Brazil, Argentina, Colombia, Saudi Arabia, UAE, South Africa, Israel and Turkey |
| Competitive landscape | Leading Companies, Market Positioning of Companies, Competitive Strategies, and Industry Risks |
Research Analyst Overview
- The AI datasets and licensing for academic research and publishing market is characterized by a rapid evolution toward structured, AI-ready data ecosystems. The proliferation of large language models and open-source foundation models has intensified the need for high-quality, domain-specific datasets for effective model fine-tuning. This drives demand for both proprietary dataset licensing and open access resources.
- Key activities now center on retrieval-augmented generation and knowledge base integration, which rely on semantic search capabilities powered by vector database technology. A boardroom-level focus has emerged on data governance policies, as ensuring data privacy compliance and implementing ethical AI frameworks is no longer optional.
- The use of federated learning approaches and robust data anonymization techniques is growing to address these concerns. Organizations that successfully implement machine learning operations and data provenance tracking achieve up to a 25% faster path to reproducible research.
- The market demands not just data, but IP-compliant data access through sophisticated XML licensing frameworks, with a clear emphasis on data annotation quality, structured data extraction, and rigorous algorithmic bias mitigation to ensure scientifically valid and socially responsible outcomes in fields from natural language processing to computational linguistics.
What are the Key Data Covered in this AI Datasets And Licensing For Academic Research And Publishing Market Research and Growth Report?
-
What is the expected growth of the AI Datasets And Licensing For Academic Research And Publishing Market between 2025 and 2029?
-
USD 1.28 billion, at a CAGR of 29.7%
-
-
What segmentation does the market report cover?
-
The report is segmented by Application (Training, Fine Tuning, RAG, and Inference), Type (Proprietary licensing, Subscription-based, Open access and public licensing, and Enterprise licensing), End-user (Life sciences and pharmaceuticals, Food science, Chemistry, and Engineering and material science) and Geography (North America, Europe, APAC, South America, Middle East and Africa)
-
-
Which regions are analyzed in the report?
-
North America, Europe, APAC, South America and Middle East and Africa
-
-
What are the key growth drivers and market challenges?
-
Proliferation of large scale generative models and consequent demand for specialized datasets, Navigating complex and fragmented regulatory landscape for data privacy and usage
-
-
Who are the major players in the AI Datasets And Licensing For Academic Research And Publishing Market?
-
American Chemical Society, Baidu Inc., ByteDance Ltd., Clarivate PLC, Copyright Clearance Center Inc., DataCite, Digital Science and Research Solutions Ltd., Elsevier Ltd., Informa PLC, Institute of Electrical and Electronics Engineers Inc., John Wiley and Sons Inc., Microsoft Corp., OpenAI, ProQuest LLC, SAGE Publications Inc., Springer Verlag GmbH, Taylor and Francis, Wolters Kluwer NV and Zenodo
-
Market Research Insights
- The AI datasets and licensing for academic research and publishing market is shaped by the strategic need for high-quality training data and robust academic AI research infrastructure. Institutions adopting data-centric AI development report a 30% increase in research reproducibility.
- The shift toward AI-ready scientific datasets is critical, as platforms offering peer-reviewed content APIs enable literature review automation that is up to 50% faster than manual methods. Managing data compliance for AI is a central concern; adherence to cross-border data transfer rules avoids penalties that can absorb over 4% of an institution's budget.
- The use of AI model validation benchmarks and open science data platforms fosters transparency and collaboration. This dynamic underscores a market where value is derived not just from data access but from enabling verifiable, efficient, and compliant scholarly publishing innovation.
We can help! Our analysts can customize this ai datasets and licensing for academic research and publishing market research report to meet your requirements.
 RIA -
RIA - 
