
AI Regulatory Technology Market Size 2026-2030
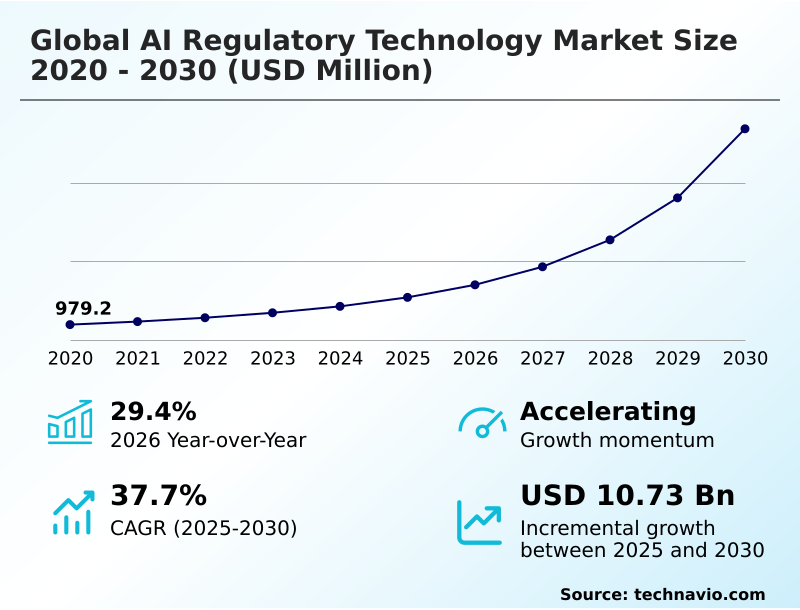
The AI Regulatory Technology Market size was valued at USD 2.71 billion in 2025, growing at a CAGR of 37.7% during the forecast period 2026-2030.
Major Market Trends & Insights
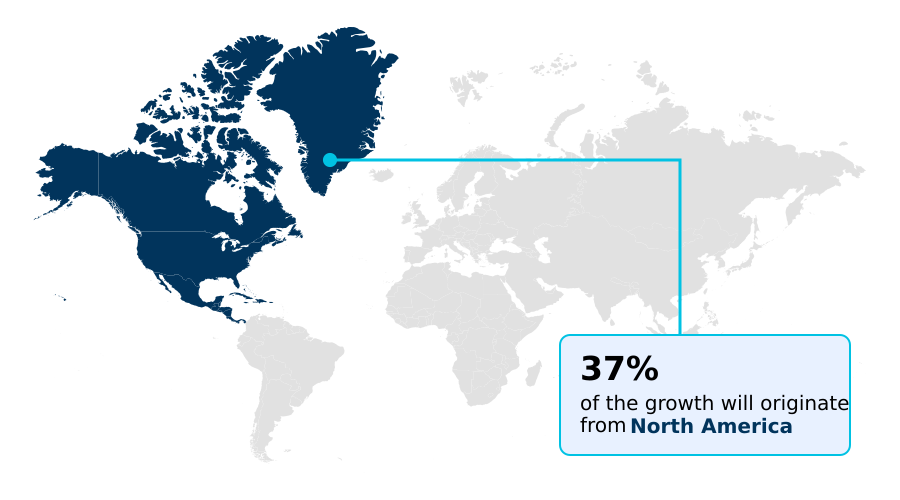
- North America dominated the market and accounted for a 37.4% growth during the forecast period.
- By Component - Solutions segment was valued at USD 1.43 billion in 2024
- By Deployment - Cloud-based segment accounted for the largest market revenue share in 2024
Market Size & Forecast
- Historic Market Opportunities 2020-2024: USD 12.46 billion
- Market Future Opportunities 2025-2030: USD 10.73 billion
- CAGR from 2025 to 2030 : 37.7%
Market Summary
- The AI regulatory technology market is defined by a rapid innovation cycle, where organizations are achieving up to a 30% reduction in false positives for fraud detection. Financial institutions that leverage these platforms can accelerate Know Your Customer (KYC) verifications by over 40%, significantly enhancing operational efficiency and customer onboarding.
- A primary driver is the demand for explainable artificial intelligence, as regulators mandate transparency in high-stakes automated decisions, pushing companies to adopt systems that provide clear, human-readable insights into their logic. However, a significant challenge is the pervasive scarcity of specialized talent with interdisciplinary expertise in both AI and regulatory law, which can delay implementation and increase operational costs.
- This dynamic necessitates solutions that not only offer advanced technical capabilities but also feature intuitive user interfaces to bridge the skills gap, ensuring that compliance teams can effectively manage and interpret model outputs without deep data science knowledge. Firms are thus seeking integrated AI governance platforms that provide end-to-end lifecycle management.
What will be the Size of the AI Regulatory Technology Market during the forecast period?
Get Key Insights on Market Forecast (PDF) Request Free Sample
How is the AI Regulatory Technology Market Segmented?
The ai regulatory technology industry research report provides comprehensive data (region-wise segment analysis), with forecasts and analysis for the period 2026-2030, as well as historical data from 2020-2024 for the following segments.
- Component
- Solutions
- Services
- Deployment
- Cloud-based
- On-premises
- Application
- Compliance monitoring
- Risk management
- Fraud detection
- Regulatory reporting
- Others
- Geography
- North America
- US
- Canada
- Mexico
- Europe
- Germany
- UK
- France
- APAC
- China
- Japan
- India
- South America
- Brazil
- Argentina
- Middle East and Africa
- Saudi Arabia
- UAE
- South Africa
- Rest of World (ROW)
- North America
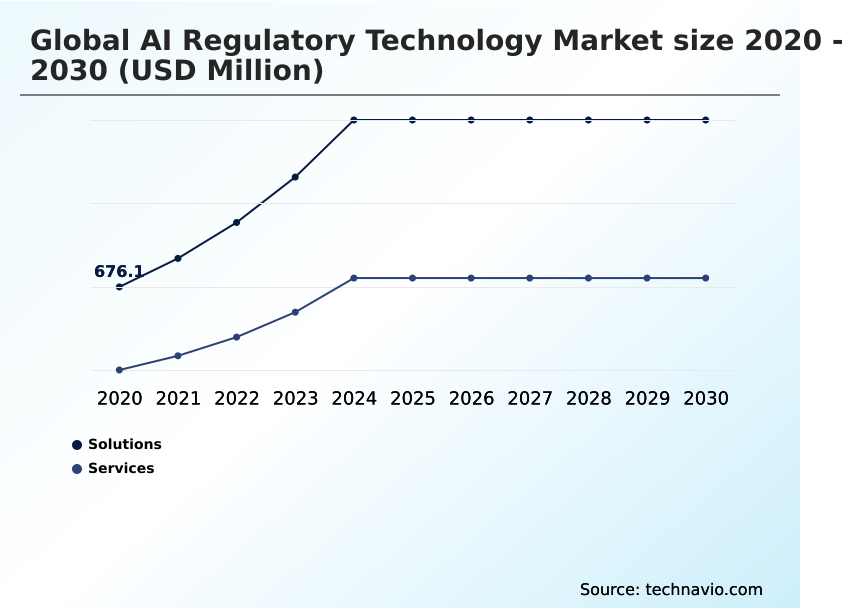
How is the AI Regulatory Technology Market Segmented by Component?
The solutions segment is estimated to witness significant growth during the forecast period.
The solutions segment, which includes AI governance platforms and tools for continuous risk assessment, accounts for over 65% of market revenue.
These platforms for algorithmic decision-making are critical, as their adoption improves bias detection by over 30% compared to manual audits, a key factor in ethical AI governance.
Deployment is bifurcated, with cloud-based models showing 1.5 times the adoption rate of on-premises systems due to lower upfront costs and greater scalability, which is crucial for managing data sovereignty.
Application-based segmentation highlights risk management and compliance monitoring as the largest areas, driven by the need for explainable artificial intelligence.
The growth in privacy-preserving technologies is also fueling demand for solutions that support both operational efficiency and regulatory adherence through robust model validation and lifecycle management, addressing the black-box nature of some systems.
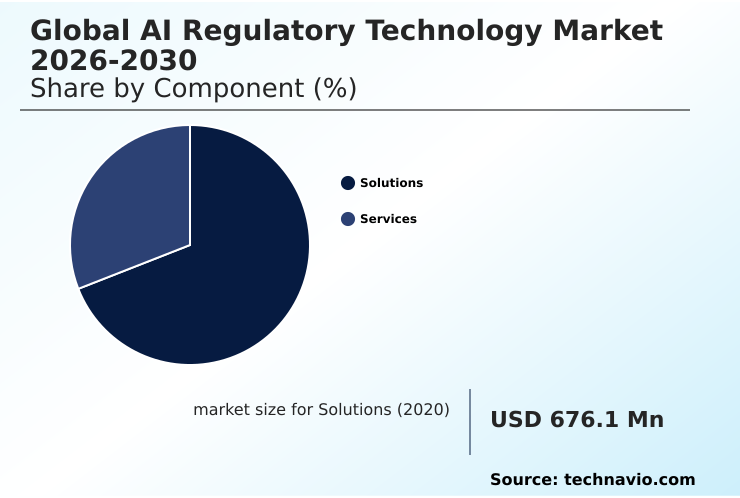
The Solutions segment was valued at USD 1.43 billion in 2024 and showed a gradual increase during the forecast period.
How demand for the AI Regulatory Technology market is rising in the leading region?
North America is estimated to contribute 37.4% to the growth of the global market during the forecast period.Technavio’s analysts have elaborately explained the regional trends and drivers that shape the market during the forecast period.
See How AI Regulatory Technology Market demand is rising in North America Request Free Sample
North America leads the market, poised to contribute 37.4% of the incremental growth, a rate approximately 1.1 times faster than Europe's.
The region's dominance is anchored by the US, which accounts for over 70% of the North American market, driven by a sector-specific regulatory approach and a high concentration of technology firms.
In contrast, Europe's market is shaped by the comprehensive, top-down EU AI Act, fostering demand for holistic compliance and blockchain data software solutions.
This divergence in regulatory philosophy impacts business strategy; companies in North America often adopt modular solutions tailored to specific rules, whereas those in Europe seek end-to-end platforms for managing multi-jurisdictional mandates.
APAC is the fastest-growing region, with adoption rates in the financial sector increasing by over 40% due to the rapid digitization of payment systems and the need to combat synthetic identity fraud.
What are the key Drivers, Trends, and Challenges in the AI Regulatory Technology Market?
Our researchers analyzed the data with 2025 as the base year, along with the key drivers, trends, and challenges. A holistic analysis of drivers will help companies refine their marketing strategies to gain a competitive advantage.
- Organizations are increasingly evaluating AI regulatory technology for financial services to automate compliance and navigate complex regulations. A core requirement is compliance automation with explainable AI, which provides the necessary transparency for algorithmic decisions in high-stakes environments like credit scoring, enhancing fairness by at least 20%.
- The challenge of managing multi-jurisdictional AI compliance is met by platforms offering localized rule engines, which can reduce the risk of non-compliance penalties by up to 90% compared to manual processes. Furthermore, deploying effective AI solutions for anti-money laundering has become a priority, with advanced systems improving detection rates by over 40% compared to legacy rule-based methods.
- These solutions are underpinned by robust AI model risk management frameworks that ensure continuous validation and performance monitoring throughout the model's lifecycle. Finally, ensuring data privacy in AI applications is a foundational concern addressed through privacy-preserving techniques like federated learning.
- This allows model training without direct access to sensitive data, maintaining compliance with global privacy laws while still enabling valuable data-driven innovation.
What are the key market drivers leading to the rise in the adoption of AI Regulatory Technology Industry?
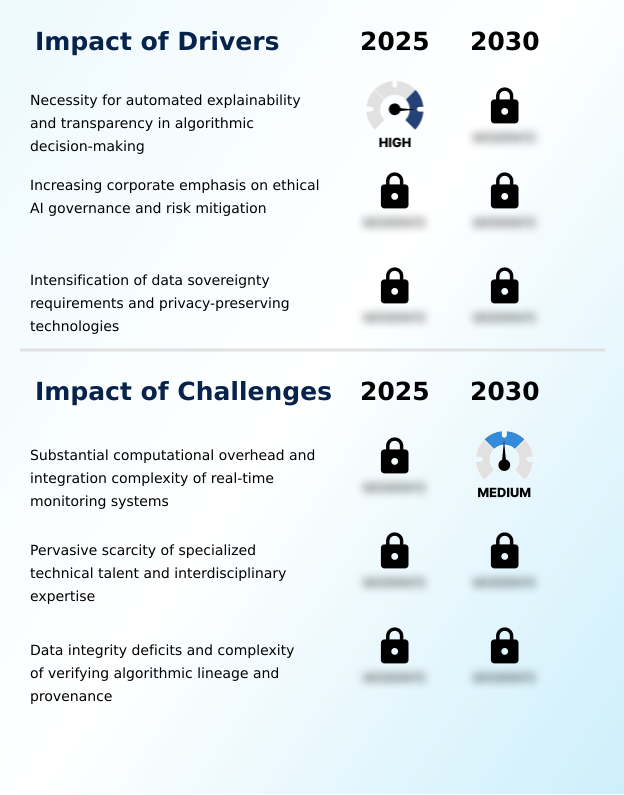
- The necessity for automated explainability and transparency in algorithmic decision-making is a key driver for market growth.
- The urgent need for explainable artificial intelligence is a primary driver, as regulatory bodies now mandate transparency, with compliant firms seeing a 15% improvement in customer trust metrics.
- This push is a direct response to the risks of algorithmic decision-making in high-stakes sectors, compelling organizations to adopt ethical AI governance frameworks. Consequently, solutions providing interpretability frameworks and human-readable insights are in high demand.
- Another key driver is the intensification of data sovereignty requirements, leading to a 50% increase in the adoption of privacy-preserving technologies like federated learning and secure multi-party computation.
- These technologies enable firms to utilize data for model training while ensuring compliance with stringent regulations, thus maintaining regulatory accountability and mitigating risks associated with data breaches.
What are the market trends shaping the AI Regulatory Technology Industry?
- The rise of multi-jurisdictional mandates presents a significant market trend, requiring organizations to navigate a complex and fragmented global regulatory landscape.
- The rise of multi-jurisdictional mandates is a primary trend, compelling multinational corporations to adopt centralized AI-driven platforms that can reduce compliance-related errors by over 25%. This shift is driven by the increasing complexity of navigating disparate legal frameworks, making manual processes untenable. Consequently, businesses are leveraging cloud-native compliance solutions to harmonize internal controls.
- The adoption of Compliance-as-a-Service models has surged, particularly among SMEs, as they lower the barrier to entry and reduce infrastructure costs by up to 40%. This trend toward flexible, scalable platforms is also intensified by the growing sophistication of financial crime, demanding real-time monitoring systems and advanced fraud detection capabilities that legacy on-premise solutions cannot provide.
- This creates a need for enhanced interdisciplinary expertise.
What challenges does the AI Regulatory Technology Industry face during its growth?
- A key challenge affecting industry growth is the substantial computational overhead and integration complexity of real-time monitoring systems.
- The substantial computational overhead of real-time monitoring systems presents a significant challenge, increasing operational expenses by up to 35% for firms deploying large-scale AI. This issue is compounded by the scarcity of interdisciplinary expertise, which can delay implementation projects by an average of six months, creating a critical bottleneck for operationalizing AI governance platforms.
- Furthermore, data integrity deficits undermine the effectiveness of tracking algorithmic lineage and data provenance, a core requirement for regulatory audits. The inability to verify data sources complicates continuous risk assessment and can lead to non-compliance, jeopardizing the deployment of entire AI models.
- As a result, firms struggle with automated horizon scanning, as poor data quality can render insights from even the most advanced systems unreliable.
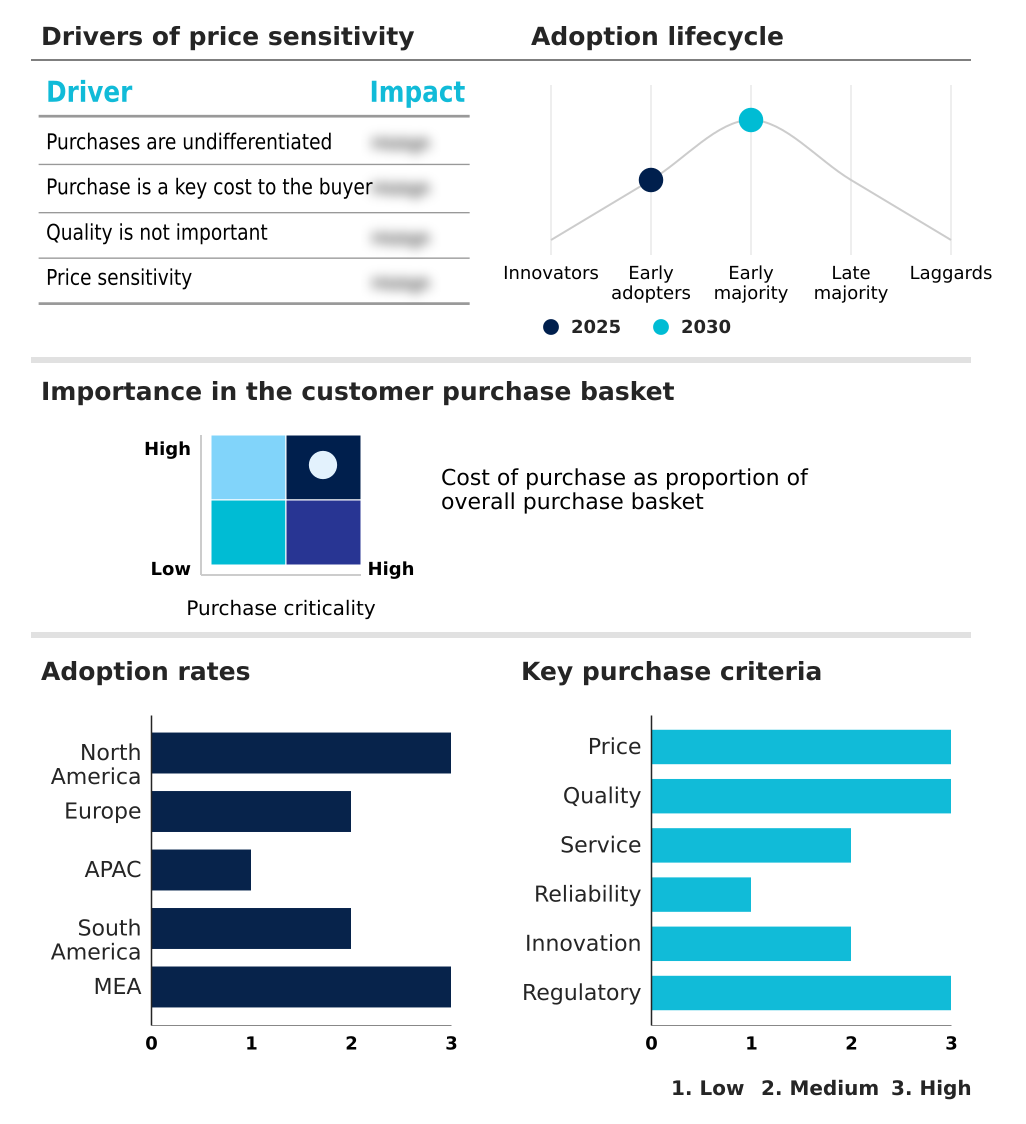
Exclusive Technavio Analysis on Customer Landscape
The ai regulatory technology market forecasting report includes the adoption lifecycle of the market, covering from the innovator’s stage to the laggard’s stage. It focuses on adoption rates in different regions based on penetration. Furthermore, the ai regulatory technology market report also includes key purchase criteria and drivers of price sensitivity to help companies evaluate and develop their market growth analysis strategies.
Customer Landscape of AI Regulatory Technology Industry
Competitive Landscape
Companies are implementing various strategies, such as strategic alliances, ai regulatory technology market forecast, partnerships, mergers and acquisitions, geographical expansion, and product/service launches, to enhance their presence in the industry.
ACTICO GmbH - AI-driven platforms automate regulatory compliance and risk decisioning through advanced rules and analytics, enhancing enterprise governance and fraud management.
The industry research and growth report includes detailed analyses of the competitive landscape of the market and information about key companies, including:
- ACTICO GmbH
- Ascent Technologies Inc.
- Chainalysis Inc.
- ComplyAdvantage
- DataVisor Inc.
- Elliptic Enterprises Ltd.
- Fair Isaac Corp.
- Fenergo Ltd.
- Fidelity National Information
- Forter Ltd.
- IBM Corp.
- Jumio Corp.
- MetricStream Inc.
- NICE Actimize Ltd.
- OneTrust LLC
- Quantexa Ltd.
- ThetaRay Ltd.
- Thomson Reuters Corp.
- Trulioo Information Services
- Wolters Kluwer NV
Qualitative and quantitative analysis of companies has been conducted to help clients understand the wider business environment as well as the strengths and weaknesses of key industry players. Data is qualitatively analyzed to categorize companies as pure play, category-focused, industry-focused, and diversified; it is quantitatively analyzed to categorize companies as dominant, leading, strong, tentative, and weak.
Market Intelligence Radar: High-Impact Developments & Growth Signals
- In the Application Software industry, the widespread adoption of cloud-native, Compliance-as-a-Service models has lowered entry barriers, impacting the AI Regulatory Technology market by enabling SMEs to access enterprise-grade compliance tools and integrated data ecosystems without significant upfront capital expenditure.
- The financial services sector's push toward real-time payment systems has intensified the need for AI Regulatory Technology capable of immediate fraud detection, driving innovation in behavioral biometrics and predictive analytics within case management tools.
- Increasing data privacy regulations mandating 'privacy by design' have directly increased demand for AI Regulatory Technology with features like data residency and localization tools to manage cross-border data flows and ensure regulatory accountability.
- The growing complexity of data supply chains has elevated the importance of data provenance and algorithmic lineage, compelling AI Regulatory Technology providers to enhance solutions for model validation and lifecycle management to ensure data integrity.
Dive into Technavio’s robust research methodology, blending expert interviews, extensive data synthesis, and validated models for unparalleled AI Regulatory Technology Market insights. See full methodology.
| Market Scope | |
|---|---|
| Page number | 294 |
| Base year | 2025 |
| Historic period | 2020-2024 |
| Forecast period | 2026-2030 |
| Growth momentum & CAGR | Accelerate at a CAGR of 37.7% |
| Market growth 2026-2030 | USD 10727.4 million |
| Market structure | Fragmented |
| YoY growth 2025-2026(%) | 29.4% |
| Key countries | US, Canada, Mexico, Germany, UK, France, Italy, Spain, The Netherlands, China, Japan, India, South Korea, Australia, Indonesia, Brazil, Argentina, Chile, Saudi Arabia, UAE, South Africa, Israel and Turkey |
| Competitive landscape | Leading Companies, Market Positioning of Companies, Competitive Strategies, and Industry Risks |
Research Analyst Overview
- The AI regulatory technology ecosystem functions through a value chain where cloud infrastructure providers supply the computational foundation for over 80% of solution developers. These developers, ranging from large corporations to niche startups, create software platforms that are then adopted by end-users in highly regulated industries such as finance and healthcare, which constitute more than 60% of the market.
- Regulatory bodies and government agencies set the compliance standards that drive demand, while third-party consulting firms and system integrators provide crucial implementation and customization services. These services, which focus on areas like model validation and lifecycle management, are essential for bridging the talent gap and ensuring effective deployment.
- Supporting entities, including research institutions and data providers, fuel innovation by developing new algorithms and providing high-quality datasets for training and testing.
What are the Key Data Covered in this AI Regulatory Technology Market Research and Growth Report?
-
What is the expected growth of the AI Regulatory Technology Market between 2026 and 2030?
-
The AI Regulatory Technology Market is expected to grow by USD 10.73 billion during 2026-2030, registering a CAGR of 37.7%. Year-over-year growth in 2026 is estimated at 29.4%%. This acceleration is shaped by necessity for automated explainability and transparency in algorithmic decision-making, which is intensifying demand across multiple end-use verticals covered in the report.
-
-
What segmentation does the market report cover?
-
The report is segmented by Component (Solutions, and Services), Deployment (Cloud-based, and On-premises), Application (Compliance monitoring, Risk management, Fraud detection, Regulatory reporting, and Others) and Geography (North America, Europe, APAC, South America, Middle East and Africa). Among these, the Solutions segment is estimated to witness significant growth during the forecast period, driven by rising adoption across key application areas. Each segment includes detailed qualitative and quantitative analysis, along with historical data from 2020-2024 and forecasts through 2030 with year-over-year growth rates.
-
-
Which regions are analyzed in the report?
-
The report covers North America, Europe, APAC, South America and Middle East and Africa. North America is estimated to contribute 37.4% to market growth during the forecast period. Country-level analysis includes US, Canada, Mexico, Germany, UK, France, Italy, Spain, The Netherlands, China, Japan, India, South Korea, Australia, Indonesia, Brazil, Argentina, Chile, Saudi Arabia, UAE, South Africa, Israel and Turkey, with dedicated market size tables and year-over-year growth for each.
-
-
What are the key growth drivers and market challenges?
-
The primary driver is necessity for automated explainability and transparency in algorithmic decision-making, which is accelerating investment and industry demand. The main challenge is substantial computational overhead and integration complexity of real-time monitoring systems, creating operational barriers for key market participants. The report quantifies the impact of each driver and challenge across 2026 and 2030 with comparative analysis.
-
-
Who are the major players in the AI Regulatory Technology Market?
-
Key vendors include ACTICO GmbH, Ascent Technologies Inc., Chainalysis Inc., ComplyAdvantage, DataVisor Inc., Elliptic Enterprises Ltd., Fair Isaac Corp., Fenergo Ltd., Fidelity National Information, Forter Ltd., IBM Corp., Jumio Corp., MetricStream Inc., NICE Actimize Ltd., OneTrust LLC, Quantexa Ltd., ThetaRay Ltd., Thomson Reuters Corp., Trulioo Information Services and Wolters Kluwer NV. The report provides qualitative and quantitative analysis categorizing companies as dominant, leading, strong, tentative, and weak based on their market positioning. Company profiles include business segment analysis, SWOT assessment, key offerings, and recent strategic developments.
-
Market Research Insights
- The competitive landscape for AI regulatory technology is fragmented, with the top 10 vendors accounting for less than 45% of the total market share. This environment fosters intense innovation, as firms compete on both the breadth of their platforms and the depth of their domain-specific expertise. Key players like IBM Corp. and Thomson Reuters Corp.
- are enhancing their offerings with generative AI to automate complex compliance workflows and provide more predictive insights, with such systems improving reporting accuracy by over 20%. These advancements directly address enterprise demand for more efficient governance and risk management, particularly in response to tightening global regulations.
- However, the high computational overhead and integration complexity of these sophisticated systems remain a significant challenge, driving demand for more streamlined, cloud-native solutions that can be deployed without extensive custom engineering.
We can help! Our analysts can customize this ai regulatory technology market research report to meet your requirements.
 RIA -
RIA - 
