
Legal AI Software Market Size 2026-2030
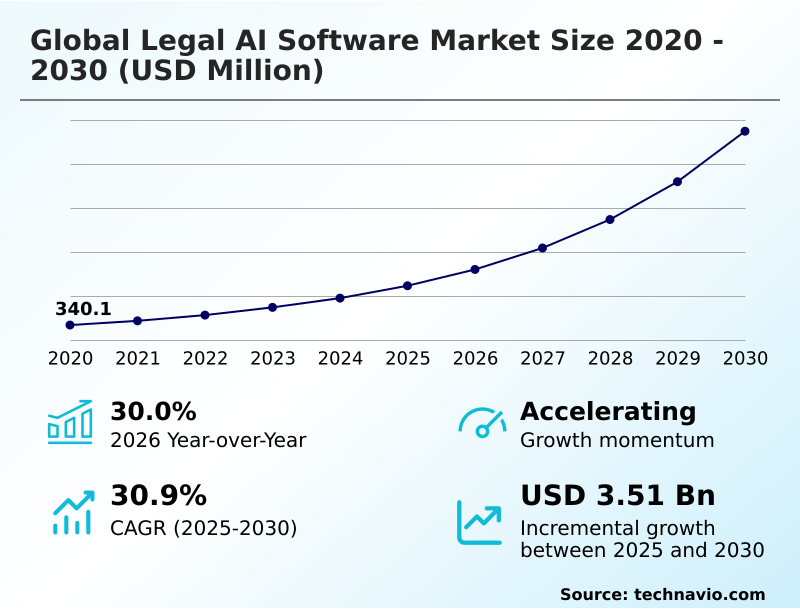
The legal ai software market size is valued to increase by USD 3.51 billion, at a CAGR of 30.9% from 2025 to 2030. Exponential growth in legal data volumes and necessity for advanced processing will drive the legal ai software market.
Major Market Trends & Insights
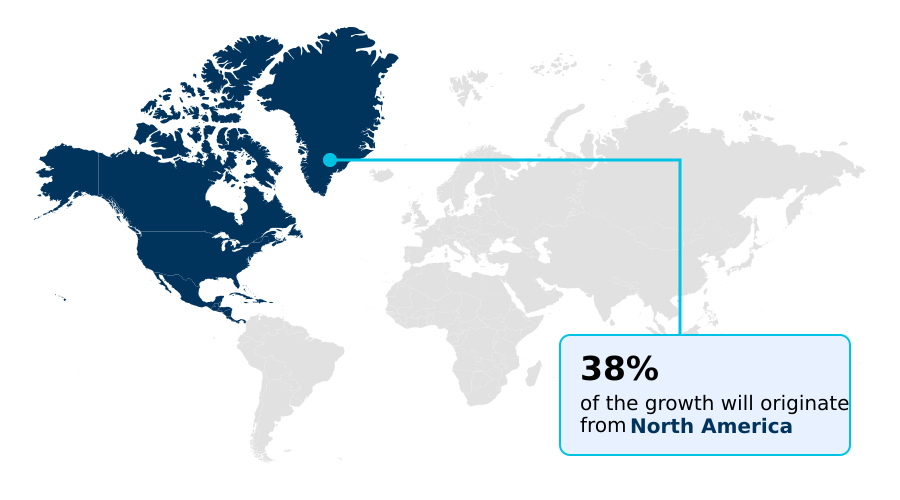
- North America dominated the market and accounted for a 38.2% growth during the forecast period.
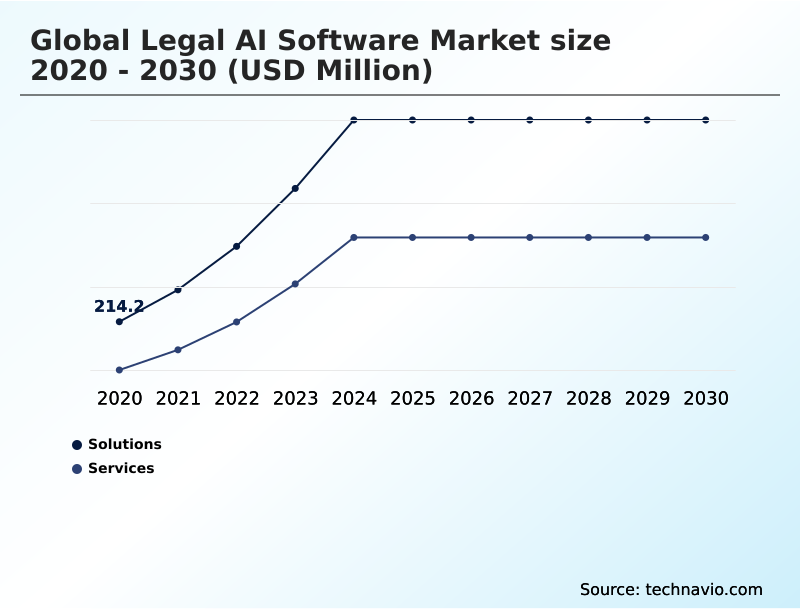
- By Type - Solutions segment was valued at USD 583.3 million in 2024
- By Application - Contract analysis segment accounted for the largest market revenue share in 2024
Market Size & Forecast
- Market Opportunities: USD 4.40 billion
- Market Future Opportunities: USD 3.51 billion
- CAGR from 2025 to 2030 : 30.9%
Market Summary
- The legal AI software market is undergoing a significant transformation, driven by the need to manage vast amounts of digital information and improve operational efficiency. AI platforms are becoming essential for automating tasks like e-discovery and contract lifecycle management.
- These tools utilize natural language processing and machine learning algorithms to analyze complex documents, providing insights that were previously unattainable through manual review. A key application is in due diligence automation, where firms can analyze thousands of contracts in hours, a process that once took weeks. This enhances productivity and allows legal professionals to focus on high-value strategic work.
- The adoption of generative AI models is further accelerating this shift, enabling automated legal drafting and AI-powered negotiation. However, the industry grapples with challenges related to algorithmic accountability and data security. The development of explainable artificial intelligence is crucial for building trust.
- As firms move toward data-driven decision-making, AI-powered legal analytics and judicial behavior analysis are becoming standard, fundamentally altering litigation strategy and client service delivery. These technologies are no longer a luxury but a competitive necessity for modern legal practice.
What will be the Size of the Legal AI Software Market during the forecast period?
Get Key Insights on Market Forecast (PDF) Get Free Sample
How is the Legal AI Software Market Segmented?
The legal ai software industry research report provides comprehensive data (region-wise segment analysis), with forecasts and estimates in "USD million" for the period 2026-2030, as well as historical data from 2020-2024 for the following segments.
- Type
- Solutions
- Services
- Application
- Contract analysis
- Legal research
- Compliance management
- E-discovery
- Case management
- End-user
- Corporate legal departments
- Law firms
- Others
- Geography
- North America
- US
- Canada
- Mexico
- Europe
- Germany
- UK
- France
- APAC
- China
- Japan
- India
- South America
- Brazil
- Argentina
- Middle East and Africa
- Saudi Arabia
- UAE
- South Africa
- Rest of World (ROW)
- North America
By Type Insights
The solutions segment is estimated to witness significant growth during the forecast period.
The solutions segment is the technology-driven core of the legal AI software market, offering platforms that automate complex legal work. These systems use natural language processing and generative AI models for tasks from document summarization to advanced analytics.
AI-powered legal analytics capabilities enable a data-driven litigation strategy, moving beyond simple automation.
As the core of AI for legal operations, these tools provide legal workflow automation and AI-driven legal analytics to both AI software for law firms and AI for legal departments.
The AI for contract review function has demonstrated its ability to improve accuracy in anomaly detection and reduce manual review effort by up to 80%.
This focus on AI for legal risk assessment is crucial for firms adopting AI and alternative fee arrangements.
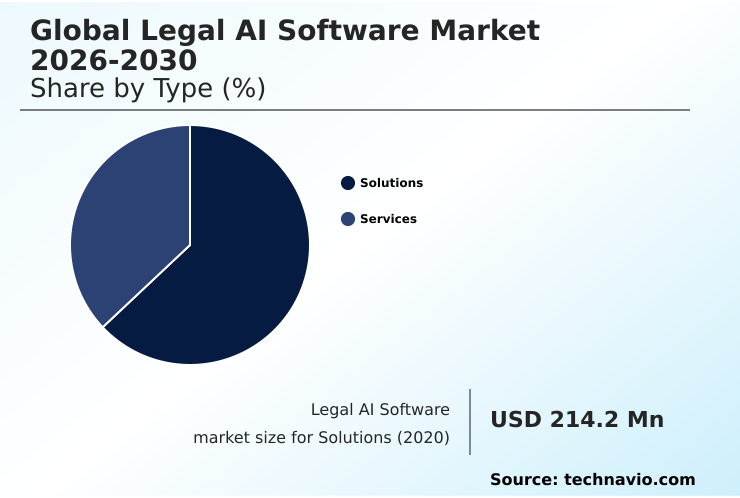
The Solutions segment was valued at USD 583.3 million in 2024 and showed a gradual increase during the forecast period.
Regional Analysis
North America is estimated to contribute 38.2% to the growth of the global market during the forecast period.Technavio’s analysts have elaborately explained the regional trends and drivers that shape the market during the forecast period.
See How Legal AI Software Market Demand is Rising in North America Get Free Sample
The geographic landscape of the legal AI software market is led by North America, which accounts for over 38% of the incremental growth, driven by a highly litigious environment and a mature tech ecosystem.
AI in litigation support and compliance monitoring tools are standard in this region. Europe follows, with a strong focus on AI-based compliance management due to stringent data privacy regulations.
The APAC region is the fastest-growing market, with nations investing heavily in legal practice management AI to modernize their judicial systems. The adoption of AI document analysis and AI for case management is surging.
South America is also an emerging market, focusing on cloud-based legal AI to improve access to justice.
The global distribution shows a clear pattern: mature markets focus on advanced litigation outcome prediction and risk scoring algorithms, while emerging regions prioritize foundational legal research automation and AI for legal process outsourcing to build efficiency.
Market Dynamics
Our researchers analyzed the data with 2025 as the base year, along with the key drivers, trends, and challenges. A holistic analysis of drivers will help companies refine their marketing strategies to gain a competitive advantage.
- The practical application of artificial intelligence in the legal sector is becoming increasingly specialized, moving beyond general platforms to address specific, high-value tasks. For instance, firms are now focused on using generative AI for contract negotiation, where AI assistants suggest alternative clauses in real time.
- The benefits of AI in e-discovery review are well-documented, with some platforms achieving accuracy rates that surpass human teams by over 15% on first-pass reviews. Understanding how AI automates legal research tasks is crucial for improving associate efficiency. Similarly, AI software for corporate compliance tracking provides continuous monitoring of regulatory changes, mitigating risk.
- Advanced firms are leveraging predictive analytics for case outcome modeling to inform litigation strategy. The process of implementing AI in contract lifecycle management creates end-to-end visibility, while AI tools for automating due diligence drastically shorten M&A timelines. A key goal for many is reducing legal costs with AI software, which is achieved by optimizing workflows.
- The challenge of AI for managing complex litigation data is met by platforms designed for massive data ingestion and analysis. The core of this is automating document review with machine learning. Furthermore, AI-powered risk analysis for contracts and AI platforms for regulatory change alerts are essential for proactive legal work.
- AI-driven case management for legal teams centralizes information, while natural language processing in legal documents enables deeper contextual understanding. This technology also facilitates AI solutions for cross-border compliance. However, it is vital to be assessing algorithmic bias in legal AI.
- The ROI of AI in corporate legal departments is a key metric, often tied to integrating AI with legal practice management. Finally, new frontiers like AI for intellectual property portfolio analysis are opening up, further proving the technology’s strategic value.
What are the key market drivers leading to the rise in the adoption of Legal AI Software Industry?
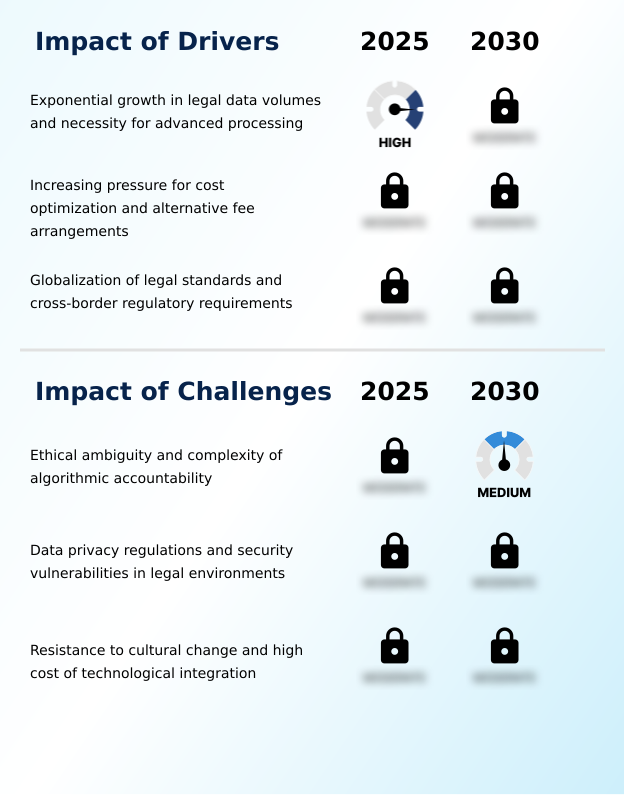
- The exponential growth in legal data volumes, coupled with the necessity for advanced processing capabilities, serves as a primary driver for market expansion.
- Market growth is primarily driven by the need to manage immense data volumes and client pressure for cost efficiency.
- The adoption of e-discovery platforms is a direct response, with firms reporting that technology assisted review can cut review costs by more than 70%.
- The move toward alternative fee arrangements compels the use of AI in legal billing and tools for legal spend management, making legal practice management AI essential for profitability.
- The globalization of business necessitates sophisticated AI for cross-border legal work and compliance monitoring tools to navigate complex regulations.
- The demand for AI-assisted document drafting and due diligence automation is also rising, with some M&A teams completing due diligence 40% faster.
- This push for efficiency is seen across the board, from AI in due diligence to AI for legal process outsourcing.
What are the market trends shaping the Legal AI Software Industry?
- The integration of generative artificial intelligence into contract lifecycle management systems is a key trend. This shift moves beyond simple document storage to automated drafting, review, and negotiation.
- A primary trend shaping the legal AI software market is the deep integration of generative AI models into core workflows, particularly AI-driven contract management. Firms leveraging this technology report a 50% faster turnaround on contract drafting. The rise of predictive analytics in litigation is another key development, with platforms improving the accuracy of case outcome forecasting by over 20%.
- AI for legal research is also evolving, moving beyond simple keyword matching to contextual understanding, which can reduce research time by up to 60%. These trends reflect a shift toward legal tech automation that provides strategic insights, not just efficiency.
- AI for regulatory intelligence and matter tracking software are becoming indispensable for proactive risk management, while the focus on ethics of AI in law ensures responsible innovation within both AI software for law firms and large corporate legal teams.
What challenges does the Legal AI Software Industry face during its growth?
- The ethical ambiguities and complexities surrounding algorithmic accountability present a significant challenge to the market's growth and widespread adoption.
- Significant challenges temper market growth, primarily algorithmic accountability and data privacy concerns. The 'black box' nature of some machine learning algorithms creates resistance, with surveys showing that over 60% of senior partners cite lack of transparency as a barrier to adoption.
- The high cost of implementation is another hurdle; integration projects can exceed initial software licensing fees by up to 200%. Cultural resistance within a traditionally conservative profession also slows the uptake of AI-powered legal services. Security remains paramount, as a single data breach can have catastrophic consequences, making firms cautious about adopting cloud-based legal AI for sensitive matters.
- Overcoming these requires a focus on explainable artificial intelligence, clear ROI demonstrations for AI for legal operations, and robust security protocols for AI in litigation support and other unified legal platforms.
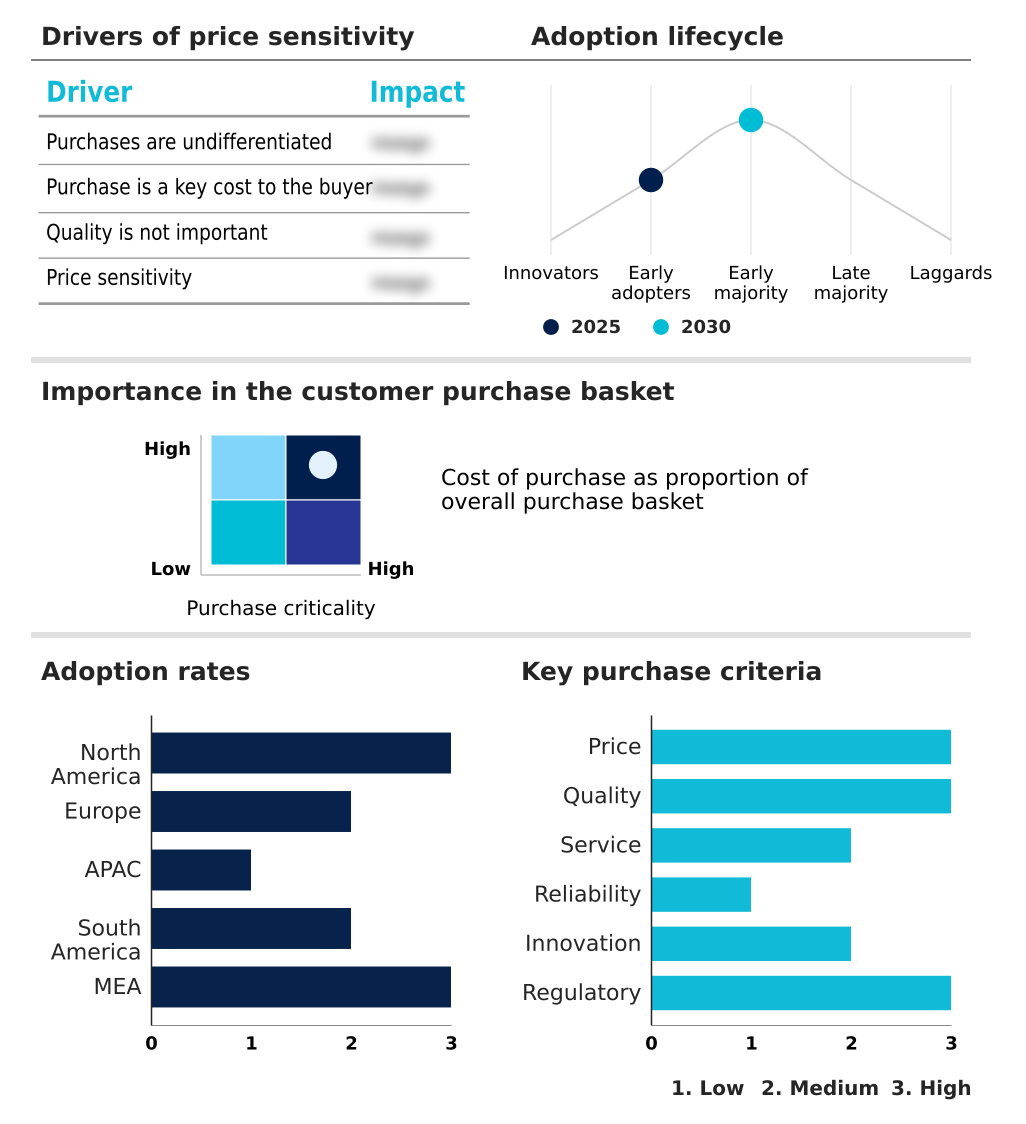
Exclusive Technavio Analysis on Customer Landscape
The legal ai software market forecasting report includes the adoption lifecycle of the market, covering from the innovator’s stage to the laggard’s stage. It focuses on adoption rates in different regions based on penetration. Furthermore, the legal ai software market report also includes key purchase criteria and drivers of price sensitivity to help companies evaluate and develop their market growth analysis strategies.
Customer Landscape of Legal AI Software Industry
Competitive Landscape
Companies are implementing various strategies, such as strategic alliances, legal ai software market forecast, partnerships, mergers and acquisitions, geographical expansion, and product/service launches, to enhance their presence in the industry.
Brightflag - Offers a comprehensive suite of AI tools for advanced legal research, case law analysis, and document drafting, leveraging proprietary generative AI to enhance professional workflows.
The industry research and growth report includes detailed analyses of the competitive landscape of the market and information about key companies, including:
- Brightflag
- Casetext Inc.
- ContractPod Technologies Ltd.
- Counsel AI Corp.
- CS Disco Inc.
- Diligen Inc.
- DoNotPay Inc.
- Everlaw Inc.
- Evisort Inc.
- Ironclad Inc.
- Kira Systems
- Legalogic Ltd.
- LexisNexis Legal and Professional
- Luminance Technologies Ltd.
- Robin AI Ltd.
- Spellbook
- Themis Solutions Inc.
- Thomson Reuters Corp.
- ThoughtRiver Ltd.
- Wolters Kluwer NV
Qualitative and quantitative analysis of companies has been conducted to help clients understand the wider business environment as well as the strengths and weaknesses of key industry players. Data is qualitatively analyzed to categorize companies as pure play, category-focused, industry-focused, and diversified; it is quantitatively analyzed to categorize companies as dominant, leading, strong, tentative, and weak.
Recent Development and News in Legal ai software market
- In August, 2025, ReguTech Innovations announced its AI-driven compliance platform is fully compliant with the EU AI Act's new regulations for high-risk systems, ensuring algorithmic transparency for financial services clients.
- In January, 2025, LexisNexis launched its Lexis+ AI platform globally, integrating generative AI capabilities for conversational search, summarization, and legal drafting directly into its core research products.
- In August, 2025, the government of the United Arab Emirates launched a multi-million dollar fund to accelerate local legal AI software startups, aiming to establish the nation as a regional legal tech hub.
- In May, 2025, Ironclad Inc. announced a strategic partnership with a major consulting firm to integrate its AI-powered contract lifecycle management platform, responding to industry reports showing a 45% increase in AI adoption among corporate legal departments.
Dive into Technavio’s robust research methodology, blending expert interviews, extensive data synthesis, and validated models for unparalleled Legal AI Software Market insights. See full methodology.
| Market Scope | |
|---|---|
| Page number | 296 |
| Base year | 2025 |
| Historic period | 2020-2024 |
| Forecast period | 2026-2030 |
| Growth momentum & CAGR | Accelerate at a CAGR of 30.9% |
| Market growth 2026-2030 | USD 3511.6 million |
| Market structure | Fragmented |
| YoY growth 2025-2026(%) | 30.0% |
| Key countries | US, Canada, Mexico, Germany, UK, France, Italy, Spain, The Netherlands, China, Japan, India, South Korea, Australia, Indonesia, Brazil, Argentina, Chile, Saudi Arabia, UAE, South Africa, Israel and Turkey |
| Competitive landscape | Leading Companies, Market Positioning of Companies, Competitive Strategies, and Industry Risks |
Research Analyst Overview
- The legal AI software market is defined by a rapid evolution from basic automation to sophisticated cognitive tools. AI-powered e-billing, legal spend management, and matter tracking software are now foundational, but the competitive edge lies in advanced applications. Generative AI models are at the forefront, revolutionizing automated legal drafting and enabling AI-powered negotiation.
- In litigation, the combination of technology assisted review, predictive coding, and e-discovery platforms has become standard practice, with systems demonstrating a 75% reduction in non-relevant documents requiring human review. AI-powered search and semantic search capabilities within knowledge management systems are transforming legal research automation. For transactional work, contract lifecycle management platforms use clause extraction and automated redlining to accelerate deals.
- Due diligence automation and contract risk analysis powered by risk scoring algorithms are critical. AI-native contract analysis provides deep insights, while anomaly detection and compliance monitoring tools ensure regulatory adherence. The strategic focus is shifting toward data-driven litigation strategy, informed by litigation outcome prediction and judicial behavior analysis. To ensure trust, explainable artificial intelligence is key to addressing algorithmic accountability.
- Unified legal platforms that combine case management automation with AI-powered legal analytics and document summarization are setting new industry benchmarks, supported by underlying machine learning algorithms and robotic process automation.
What are the Key Data Covered in this Legal AI Software Market Research and Growth Report?
-
What is the expected growth of the Legal AI Software Market between 2026 and 2030?
-
USD 3.51 billion, at a CAGR of 30.9%
-
-
What segmentation does the market report cover?
-
The report is segmented by Type (Solutions, and Services), Application (Contract analysis, Legal research, Compliance management, E-discovery, and Case management), End-user (Corporate legal departments, Law firms, and Others) and Geography (North America, Europe, APAC, South America, Middle East and Africa)
-
-
Which regions are analyzed in the report?
-
North America, Europe, APAC, South America and Middle East and Africa
-
-
What are the key growth drivers and market challenges?
-
Exponential growth in legal data volumes and necessity for advanced processing, Ethical ambiguity and complexity of algorithmic accountability
-
-
Who are the major players in the Legal AI Software Market?
-
Brightflag, Casetext Inc., ContractPod Technologies Ltd., Counsel AI Corp., CS Disco Inc., Diligen Inc., DoNotPay Inc., Everlaw Inc., Evisort Inc., Ironclad Inc., Kira Systems, Legalogic Ltd., LexisNexis Legal and Professional, Luminance Technologies Ltd., Robin AI Ltd., Spellbook, Themis Solutions Inc., Thomson Reuters Corp., ThoughtRiver Ltd. and Wolters Kluwer NV
-
Market Research Insights
- The dynamics of the legal AI software market are shaped by intense pressure on AI for legal departments to reduce costs and on AI software for law firms to deliver more value. The adoption of legal tech automation is accelerating, with firms reporting up to a 40% reduction in time spent on discovery tasks by using AI in e-discovery.
- The rise of AI-driven contract management is critical, as it allows for a 90% faster initial review of standard agreements compared to manual methods. This shift is particularly evident in AI in corporate compliance, where automated monitoring can reduce the risk of regulatory penalties.
- Predictive analytics in litigation offers a strategic edge, improving case outcome forecast accuracy by over 25% in some applications. The focus on legal workflow automation and AI-powered legal services is redefining how legal work is performed, priced, and delivered across the industry.
We can help! Our analysts can customize this legal ai software market research report to meet your requirements.
 RIA -
RIA - 
