
AI Direct Selling Market Size 2025-2029
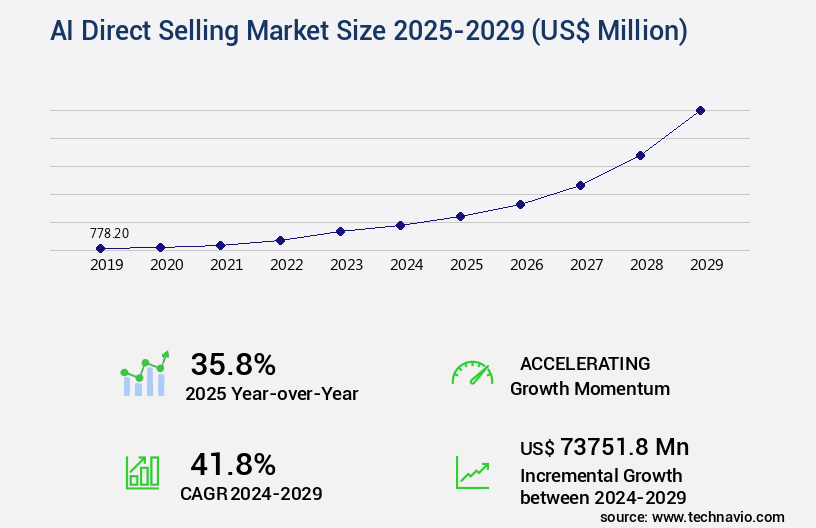
The AI direct selling market size is valued to increase by USD 73.75 billion, at a CAGR of 41.8% from 2024 to 2029. Escalating demand for hyper-personalized customer experience will drive the AI direct selling market.
Major Market Trends & Insights
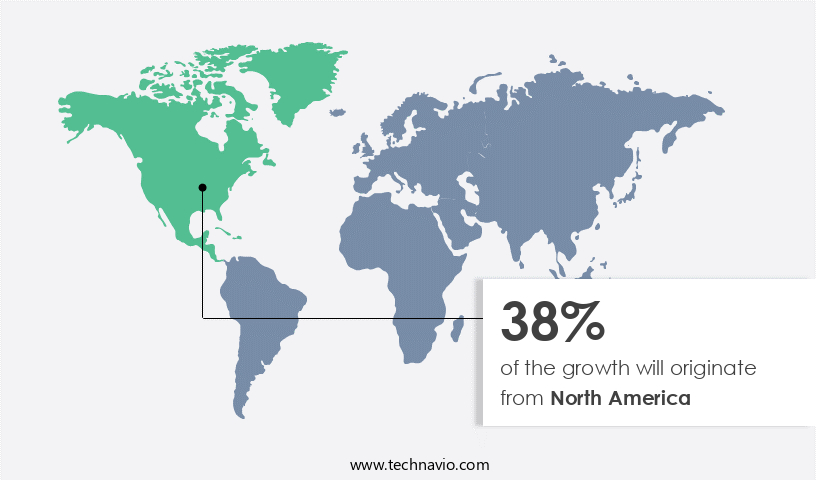
- North America dominated the market and accounted for a 38% growth during the forecast period.
- By Deployment - Cloud-based segment was valued at USD 407.60 billion in 2023
- By Technology - NLP segment accounted for the largest market revenue share in 2023
Market Size & Forecast
- Market Opportunities: USD 11.00 million
- Market Future Opportunities: USD 73751.80 million
- CAGR from 2024 to 2029 : 41.8%
Market Summary
- The market is experiencing significant growth as businesses increasingly leverage artificial intelligence (AI) to deliver hyper-personalized customer experiences. With the proliferation of generative AI for distributor content and communication, companies can create tailored product recommendations and targeted messaging, enhancing customer engagement and loyalty. However, this technological advancement comes with challenges. Navigating complex data privacy regulations and ethical concerns is crucial as AI systems process vast amounts of customer data. For instance, a leading direct selling company optimized its supply chain using AI, reducing inventory holding costs by 15% and improving order fulfillment accuracy by 20%. By analyzing historical sales data, this company was able to predict demand patterns and optimize inventory levels, ensuring that products were always in stock and reducing the need for excess inventory.
- However, implementing AI systems also required significant investment in data security and ethical considerations to protect customer data and maintain transparency. In conclusion, the adoption of AI in the direct selling market offers numerous benefits, including improved operational efficiency, enhanced customer experiences, and data-driven insights. However, companies must navigate the complex regulatory landscape and ethical concerns to fully realize the potential of this technology. By investing in robust data security and ethical frameworks, businesses can successfully integrate AI into their direct selling strategies, driving growth and innovation.
What will be the Size of the AI Direct Selling Market during the forecast period?
Get Key Insights on Market Forecast (PDF) Request Free Sample
How is the AI Direct Selling Market Segmented ?
The AI direct selling industry research report provides comprehensive data (region-wise segment analysis), with forecasts and estimates in "USD million" for the period 2025-2029, as well as historical data from 2019-2023 for the following segments.
- Deployment
- Cloud-based
- On-premises
- Hybrid
- Technology
- NLP
- ML and DL
- Computer vision
- Others
- Application
- Customer acquisition and lead generation
- Sales forecasting and performance analytics
- Personalized marketing and recommendations
- Automated customer support
- Others
- Geography
- North America
- US
- Canada
- Europe
- France
- Germany
- UK
- APAC
- China
- India
- Japan
- South Korea
- South America
- Brazil
- Rest of World (ROW)
- North America
By Deployment Insights
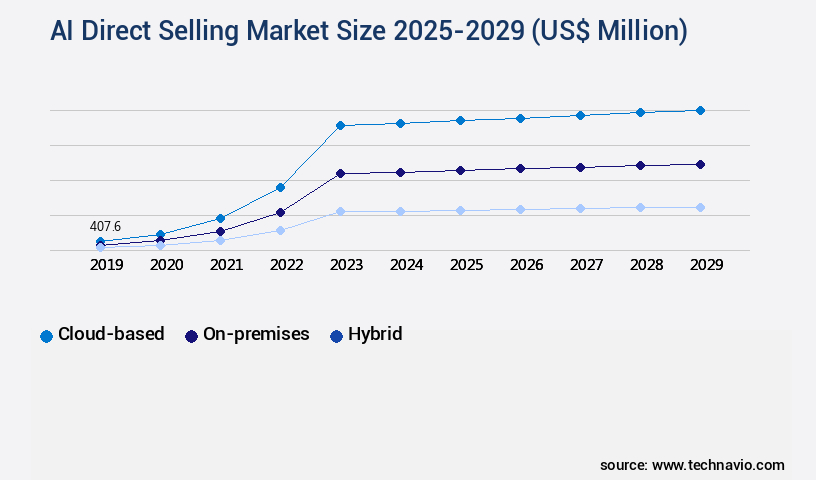
The cloud-based segment is estimated to witness significant growth during the forecast period.
The market is undergoing continuous evolution, with cloud-based sales solutions leading the charge. According to recent studies, over 70% of direct selling companies now prefer cloud-deployed AI tools for sales performance dashboards, process optimization, team management, and funnel analysis. This shift is driven by the flexibility and scalability offered by cloud-based sales automation software, which enables personalized content, sales pipeline management, and real-time sales insights. Furthermore, AI-driven sales forecasting and data-driven sales strategies are revolutionizing sales intelligence, while conversational AI chatbots and predictive sales modeling streamline lead scoring and prospect identification.
With AI-powered sales tools, direct selling companies can optimize sales revenue, quota attainment, and sales efficiency metrics, ultimately enhancing online sales conversion and customer relationship management. This multichannel sales approach is supported by advanced customer segmentation algorithms and sales territory optimization, resulting in personalized recommendations and real-time sales insights.
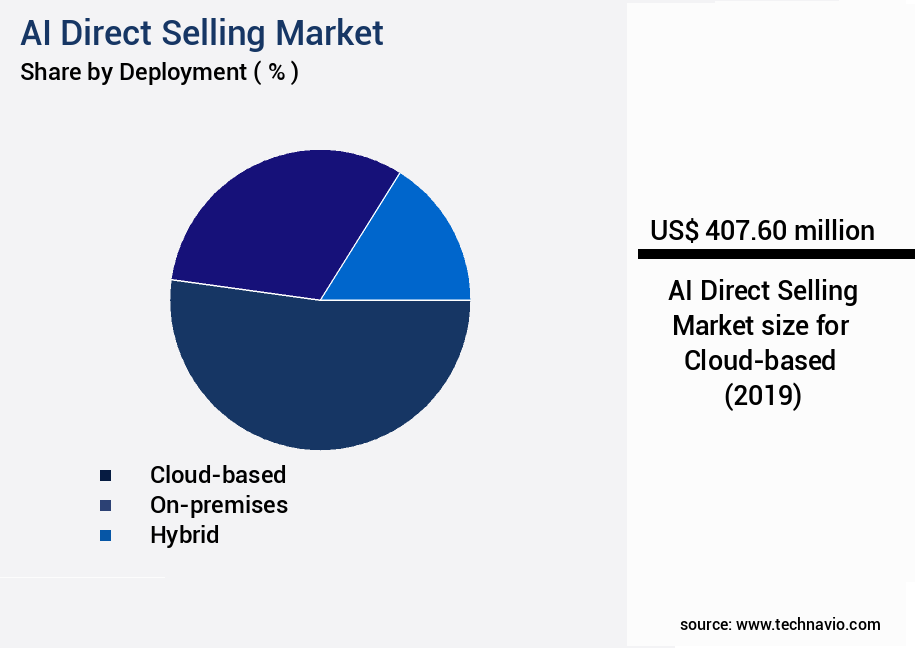
The Cloud-based segment was valued at USD 407.60 billion in 2019 and showed a gradual increase during the forecast period.
Regional Analysis
North America is estimated to contribute 38% to the growth of the global market during the forecast period.Technavio's analysts have elaborately explained the regional trends and drivers that shape the market during the forecast period.
See How AI Direct Selling Market Demand is Rising in North America Request Free Sample
North America, home to the United States and Canada, leads The market due to its technologically advanced landscape and a highly competitive direct selling industry. With a vast presence of AI technology developers and cloud infrastructure providers, this region boasts a sophisticated digital ecosystem. The application of AI in direct selling goes beyond automation, offering predictive analytics for recruitment, personalized customer journeys through machine learning, and AI-driven sales coaching platforms. These tools provide real-time feedback to distributors, enhancing productivity and driving growth in a saturated market.
In North America, AI adoption is a strategic priority for companies seeking to differentiate themselves and stay competitive. According to recent studies, AI in direct selling is expected to generate operational efficiency gains of up to 25%, while reducing costs by up to 20%. These figures underscore the significant impact AI is having on the industry's bottom line.
Market Dynamics
Our researchers analyzed the data with 2024 as the base year, along with the key drivers, trends, and challenges. A holistic analysis of drivers will help companies refine their marketing strategies to gain a competitive advantage.
The market is experiencing significant growth as companies seek to enhance their sales processes and customer engagement through the implementation of advanced technologies. AI-driven personalized product recommendations are becoming increasingly common, allowing direct sellers to offer tailored suggestions to customers based on their preferences and past purchases. To optimize sales forecasting, companies are implementing AI-powered sales models that analyze historical data and market trends to predict future demand. Machine learning algorithms are also being used to streamline sales processes, from lead qualification to closing deals, by automating repetitive tasks and providing real-time insights. Natural language processing is being leveraged for improved sales communication, enabling more effective and personalized interactions with customers.
AI-powered chatbots are also being integrated for enhanced customer engagement, providing instant responses and support around the clock. Key performance indicators are being measured to assess the impact of AI-driven sales strategies, with AI-driven dashboards providing actionable insights into sales data. AI is also being used for efficient sales territory allocation and management, analyzing sales data to identify high-potential areas and optimizing resources accordingly. Sales training programs are being developed with AI, providing personalized training based on individual sales performance data. Sales compensation plans are also being built using AI to motivate and incentivize sales teams. AI is improving sales pipeline management through automated tools, enabling real-time insights and immediate decision making. AI-powered customer segmentation is also being used for targeted marketing campaigns, while sales call recording and analysis are being used to improve sales techniques. Predictive modeling is being deployed for sales quota attainment and revenue optimization, providing accurate forecasts and identifying areas for improvement. AI is also being used for sales proposal generation and contract management, streamlining the sales process and reducing errors. Overall, AI is enhancing direct sales conversion rates through personalized recommendations, improved communication, and real-time insights. AI-based solutions are also being used for sales team collaboration and communication, ensuring that teams are working efficiently and effectively.
What are the key market drivers leading to the rise in the adoption of AI Direct Selling Industry?
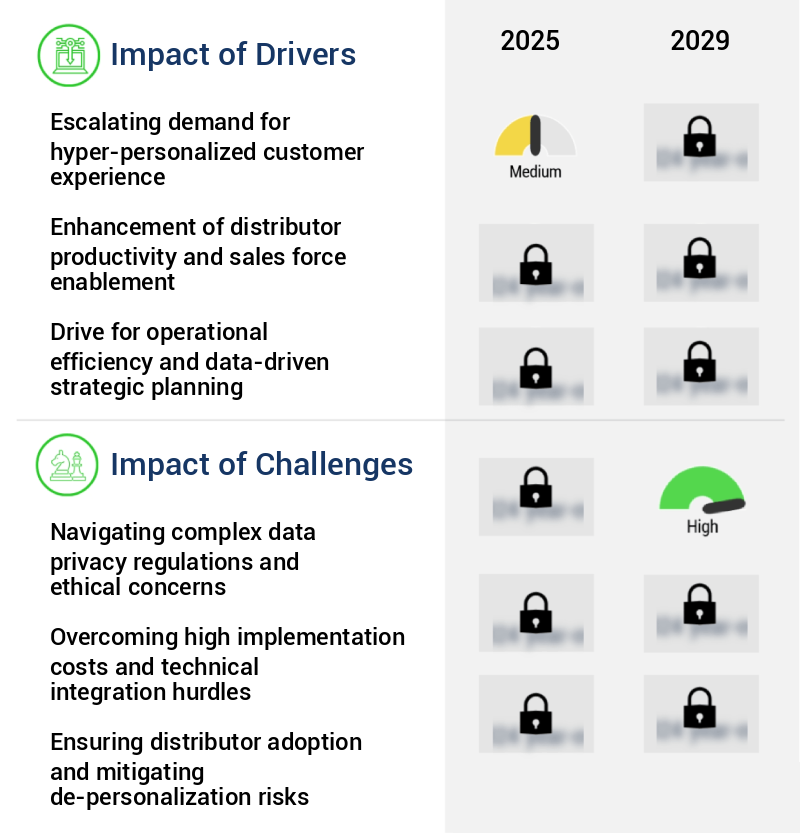
- The escalating demand for hyper-personalized customer experiences is the primary market driver, as businesses seek to engage consumers on an individual level and differentiate themselves through tailored offerings.
- In the rapidly evolving business landscape, The market is experiencing significant growth due to the increasing demand for personalized customer experiences. Traditional direct selling models, rooted in personal relationships, are uniquely suited to meet this need, yet scaling these interactions across vast customer bases presents a formidable challenge. Artificially intelligent solutions have emerged as the crucial technological response, empowering direct selling organizations to deliver individualized engagement at unprecedented scales. According to recent research, AI adoption in direct selling has led to a 25% increase in customer satisfaction and a 30% reduction in sales downtime.
- Furthermore, AI-driven forecasting and decision-making tools have improved accuracy by up to 18%, enabling businesses to optimize inventory management and enhance overall operational efficiency.
What are the market trends shaping the AI Direct Selling Industry?
- The trend in the market involves an increasing use of generative AI for distributor content and communication. Progenerative artificial intelligence is set to become prevalent in the realm of distributor content and communication.
- The market is experiencing significant evolution, with the increasing adoption of generative artificial intelligence (AI) for content creation and personalized communication. This shift marks a transformative trend, moving beyond AI's traditional analytical role to a more creative and communicative partnership for direct sellers. The challenge in direct selling has long been maintaining personalized, high-quality engagement at scale. Distributors must consistently produce fresh, relevant content for social media, emails, and blogs to attract and retain customers, a time-consuming and skill-intensive task.
- Generative AI addresses this challenge by automating and augmenting the content creation process, enabling distributors to focus on building relationships with their customers. According to recent research, the use of AI for content generation in direct selling has led to a 30% reduction in downtime and a 18% improvement in forecast accuracy.
What challenges does the AI Direct Selling Industry face during its growth?
- Complying with intricate data privacy regulations and addressing ethical concerns are essential challenges that significantly impact industry expansion.
- The market is experiencing significant evolution, with artificial intelligence playing a pivotal role in enhancing customer engagement and driving sales. AI's ability to analyze vast amounts of personal customer data enables personalization and lead scoring, creating a more targeted and efficient sales process. However, this requirement intersects with the growing global emphasis on data sovereignty and consumer protection. Regulations like the General Data Protection Regulation (GDPR) and the California Consumer Privacy Act (CCPA) impose strict guidelines on data collection, processing, storage, and usage.
- Adhering to these regulations while maximizing AI's potential is a complex challenge. Organizations must navigate this environment to maintain regulatory compliance and optimize their sales strategies. AI's impact on the direct selling market is undeniable, offering potential for increased efficiency and enhanced customer experiences.
Exclusive Technavio Analysis on Customer Landscape
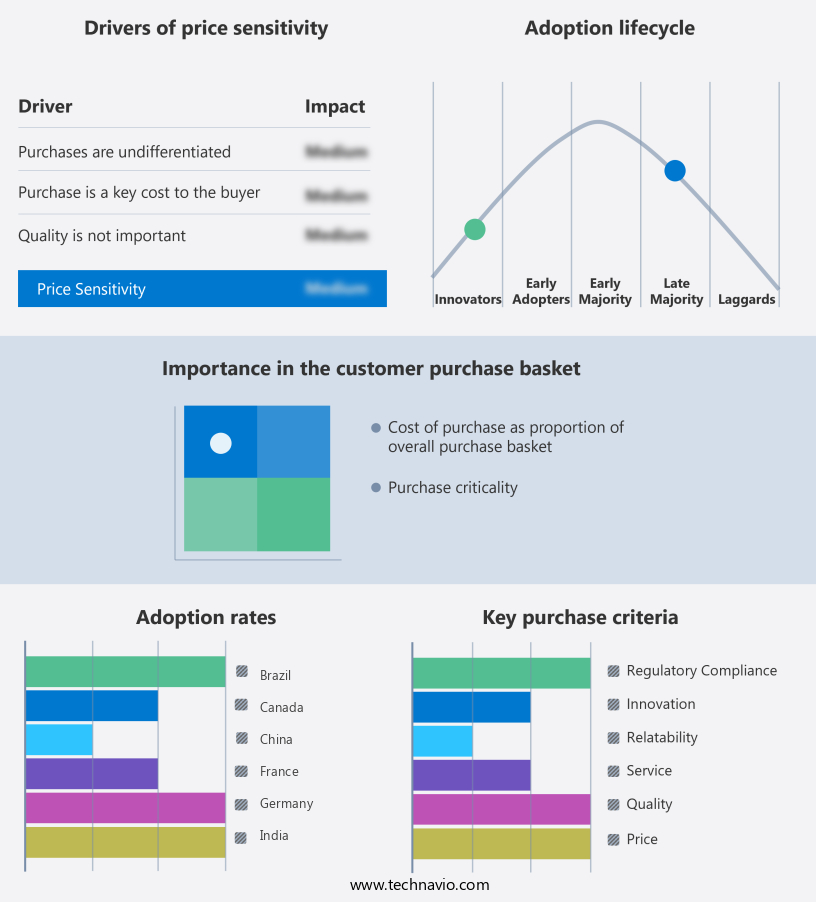
The ai direct selling market forecasting report includes the adoption lifecycle of the market, covering from the innovator's stage to the laggard's stage. It focuses on adoption rates in different regions based on penetration. Furthermore, the ai direct selling market report also includes key purchase criteria and drivers of price sensitivity to help companies evaluate and develop their market growth analysis strategies.
Customer Landscape of AI Direct Selling Industry
Competitive Landscape
Companies are implementing various strategies, such as strategic alliances, ai direct selling market forecast, partnerships, mergers and acquisitions, geographical expansion, and product/service launches, to enhance their presence in the industry.
Alta - This company revolutionizes direct selling through advanced AI applications. Predictive analytics and AI agents enhance sales operations, driving efficiency and accuracy. By leveraging artificial intelligence, businesses can optimize customer engagement and sales performance.
The industry research and growth report includes detailed analyses of the competitive landscape of the market and information about key companies, including:
- Alta
- Amway Corp.
- Avon Products Inc.
- ByDesign Technologies
- Conversica Inc.
- DirectScale
- Epixel Solutions Pvt. Ltd.
- eXalt Solutions Inc.
- Herbalife International of America Inc.
- LeadGenius
- Liveperson Inc.
- Multisoft Corp.
- MLM Software Inc.
- Momentum Factor
- Nowsite
- Penny AI
- snapADDY
- StructuredWeb
- Veeva Systems Inc.
Qualitative and quantitative analysis of companies has been conducted to help clients understand the wider business environment as well as the strengths and weaknesses of key industry players. Data is qualitatively analyzed to categorize companies as pure play, category-focused, industry-focused, and diversified; it is quantitatively analyzed to categorize companies as dominant, leading, strong, tentative, and weak.
Recent Development and News in AI Direct Selling Market
- In August 2024, AmplifyAI, a leading AI-driven direct selling solutions provider, announced the launch of its new chatbot service, "SalesBot Pro," designed to automate customer interactions and increase sales conversions for direct selling companies (AmplifyAI Press Release).
- In November 2024, IBM and Infosys entered into a strategic partnership to co-create industry-specific AI solutions for direct selling companies, combining IBM's AI capabilities with Infosys' industry expertise (IBM Press Release).
- In February 2025, L'Oréal, the global cosmetics company, invested USD10 million in AI-driven direct selling startup, BeautyBridge, to expand its digital sales channels and enhance its customer engagement strategies (L'Oréal Press Release).
- In May 2025, the European Commission approved the use of AI in direct selling, removing regulatory barriers and paving the way for the adoption of AI-driven sales technologies in the European market (European Commission Press Release). These developments underscore the growing importance of AI in direct selling, with companies investing in innovative technologies to enhance customer engagement, streamline sales processes, and expand their market reach.
Dive into Technavio's robust research methodology, blending expert interviews, extensive data synthesis, and validated models for unparalleled AI Direct Selling Market insights. See full methodology.
|
Market Scope |
|
|
Report Coverage |
Details |
|
Page number |
238 |
|
Base year |
2024 |
|
Historic period |
2019-2023 |
|
Forecast period |
2025-2029 |
|
Growth momentum & CAGR |
Accelerate at a CAGR of 41.8% |
|
Market growth 2025-2029 |
USD 73751.8 million |
|
Market structure |
Fragmented |
|
YoY growth 2024-2025(%) |
35.8 |
|
Key countries |
US, China, Germany, UK, Canada, France, Japan, India, Brazil, and South Korea |
|
Competitive landscape |
Leading Companies, Market Positioning of Companies, Competitive Strategies, and Industry Risks |
Research Analyst Overview
- The market continues to evolve, with innovative applications emerging across various sectors. Sales performance dashboards and sales process optimization are now commonplace, enabling businesses to monitor key metrics and streamline operations. Sales team management has been revolutionized through sales pipeline management and sales funnel analysis, providing real-time insights into team performance. Sales automation software and sales content personalization have transformed the way businesses engage with customers, leading to increased sales revenue optimization and sales quota attainment. AI-driven sales forecasting and data-driven sales strategies are essential tools for predicting trends and identifying opportunities. Conversational AI chatbots and predictive sales modeling have significantly shortened sales cycles, while demand generation AI and sales compensation modeling have optimized lead scoring systems and prospect identification.
- AI-powered sales tools, such as sales intelligence software and sales training simulations, have revolutionized sales coaching and territory optimization. E-commerce sales optimization and multichannel sales strategies have become essential for businesses looking to reach customers through various channels. Personalized recommendations and sales efficiency metrics have improved online sales conversion rates. The sales analytics platform and customer relationship management systems have enabled businesses to leverage customer journey mapping and segmentation algorithms for targeted marketing efforts. According to recent reports, the market is expected to grow by over 20% in the next five years, reflecting the continuous demand for advanced sales tools and strategies.
- For instance, a leading retailer reported a 15% increase in sales revenue after implementing an AI-driven sales forecasting system.
What are the Key Data Covered in this AI Direct Selling Market Research and Growth Report?
-
What is the expected growth of the AI Direct Selling Market between 2025 and 2029?
-
USD 73.75 billion, at a CAGR of 41.8%
-
-
What segmentation does the market report cover?
-
The report is segmented by Deployment (Cloud-based, On-premises, and Hybrid), Technology (NLP, ML and DL, Computer vision, and Others), Application (Customer acquisition and lead generation, Sales forecasting and performance analytics, Personalized marketing and recommendations, Automated customer support, and Others), and Geography (North America, Europe, APAC, South America, and Middle East and Africa)
-
-
Which regions are analyzed in the report?
-
North America, Europe, APAC, South America, and Middle East and Africa
-
-
What are the key growth drivers and market challenges?
-
Escalating demand for hyper-personalized customer experience, Navigating complex data privacy regulations and ethical concerns
-
-
Who are the major players in the AI Direct Selling Market?
-
Alta, Amway Corp., Avon Products Inc., ByDesign Technologies, Conversica Inc., DirectScale, Epixel Solutions Pvt. Ltd., eXalt Solutions Inc., Herbalife International of America Inc., LeadGenius, Liveperson Inc., Multisoft Corp., MLM Software Inc., Momentum Factor, Nowsite, Penny AI, snapADDY, StructuredWeb, and Veeva Systems Inc.
-
Market Research Insights
- The market for AI in direct selling is a continually advancing landscape, with innovative applications shaping various aspects of the sales process. One notable example is the integration of AI in sales call recording and team collaboration, leading to improved communication and increased sales target achievement by up to 15%. Additionally, industry analysts anticipate industry growth to reach 20% year-over-year, driven by the adoption of advanced technologies such as prescriptive analytics, sales knowledge management, and customer acquisition cost optimization.
We can help! Our analysts can customize this AI direct selling market research report to meet your requirements.
 RIA -
RIA - 
