AI Ethics And Governance Solutions Market Analysis, Size, and Forecast 2026-2030: North America (US, Canada, and Mexico), Europe (Germany, UK, and France), APAC (Japan, South Korea, and China), Middle East and Africa (Saudi Arabia, UAE, and South Africa), South America (Brazil and Argentina), and Rest of World (ROW)

AI Ethics And Governance Solutions Market Analysis, Size, and Forecast 2026-2030:
North America (US, Canada, and Mexico), Europe (Germany, UK, and France), APAC (Japan, South Korea, and China), Middle East and Africa (Saudi Arabia, UAE, and South Africa), South America (Brazil and Argentina), and Rest of World (ROW)

Published: Apr 2026 300 Pages SKU: IRTNTR80670

Market Overview at a Glance

$4.29 B
Market Opportunity
36%
CAGR 2025 - 2030
35.8%
North America Growth
$340.3 Mn
Regulatory compliance segment 2024

AI Ethics And Governance Solutions Market Size 2026-2030

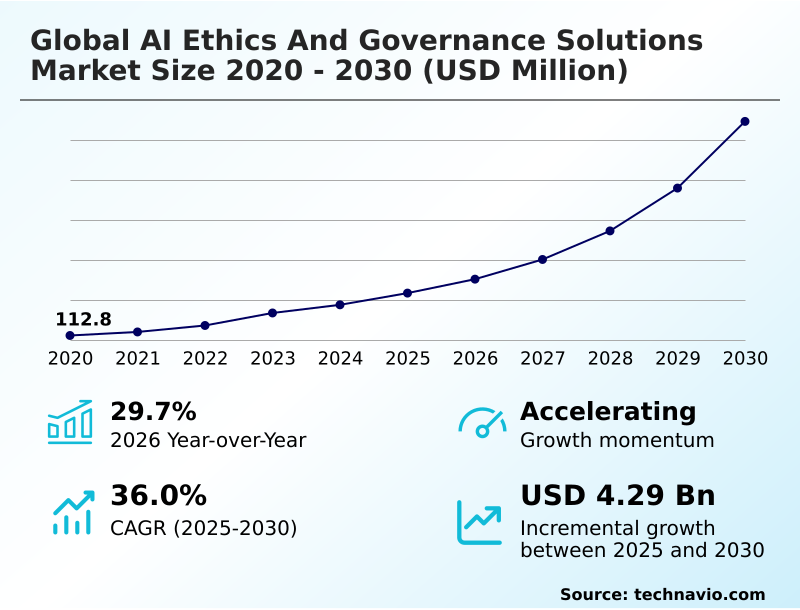
The ai ethics and governance solutions market size is valued to increase by USD 4.29 billion, at a CAGR of 36% from 2025 to 2030. Acceleration of global regulatory enforcement will drive the ai ethics and governance solutions market.

Major Market Trends & Insights

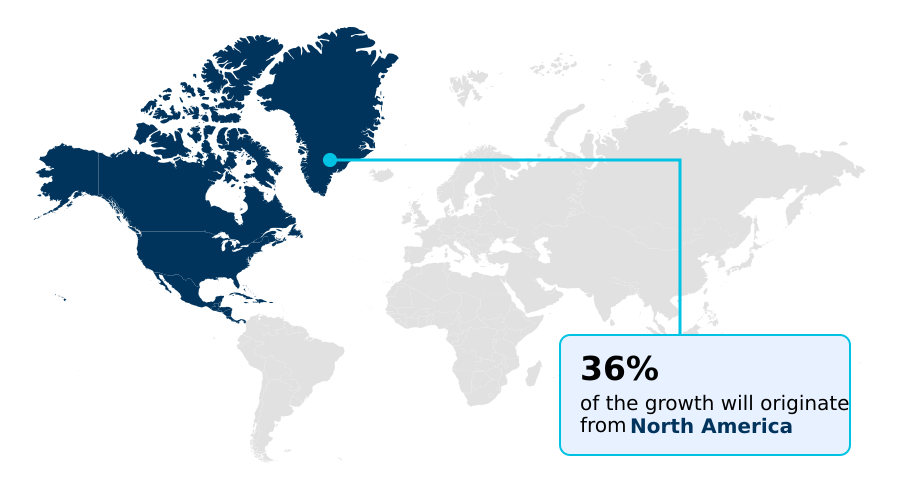
  • North America dominated the market and accounted for a 35.8% growth during the forecast period.
  • By Type - Regulatory compliance segment was valued at USD 340.3 million in 2024
  • By Deployment - Cloud-based segment accounted for the largest market revenue share in 2024

Market Size & Forecast

  • Market Opportunities: USD 5.35 billion
  • Market Future Opportunities: USD 4.29 billion
  • CAGR from 2025 to 2030 : 36%

Market Summary

  • The AI ethics and governance solutions market is rapidly maturing as organizations move from theoretical principles to operationalizing accountability and transparency design. This transition is driven by the proliferation of high-risk artificial intelligence systems and the need for a defensible regulatory posture in the face of mandatory regulatory enforcement.
  • A key trend is the shift toward agentic AI oversight, which demands real-time behavioral monitoring and robust autonomous governance systems. For instance, in financial services, automated governance platforms are used to conduct continuous risk assessments of algorithmic trading models, ensuring model integrity throughout its lifecycle and mitigating algorithmic bias to prevent discriminatory outcomes.
  • However, the industry faces challenges, including the black box model problem in complex, multi-layered neural networks, which hinders model explainability and accountability. Furthermore, a fragmented regulatory landscape complicates the pursuit of universal AI safety and requires modular adaptable platforms to manage divergent reporting standards and maintain a holistic system integrity across borders.

What will be the Size of the AI Ethics And Governance Solutions Market during the forecast period?

Get Key Insights on Market Forecast (PDF) Get Free Sample

How is the AI Ethics And Governance Solutions Market Segmented?

The ai ethics and governance solutions industry research report provides comprehensive data (region-wise segment analysis), with forecasts and estimates in "USD million" for the period 2026-2030, as well as historical data from 2020-2024 for the following segments.
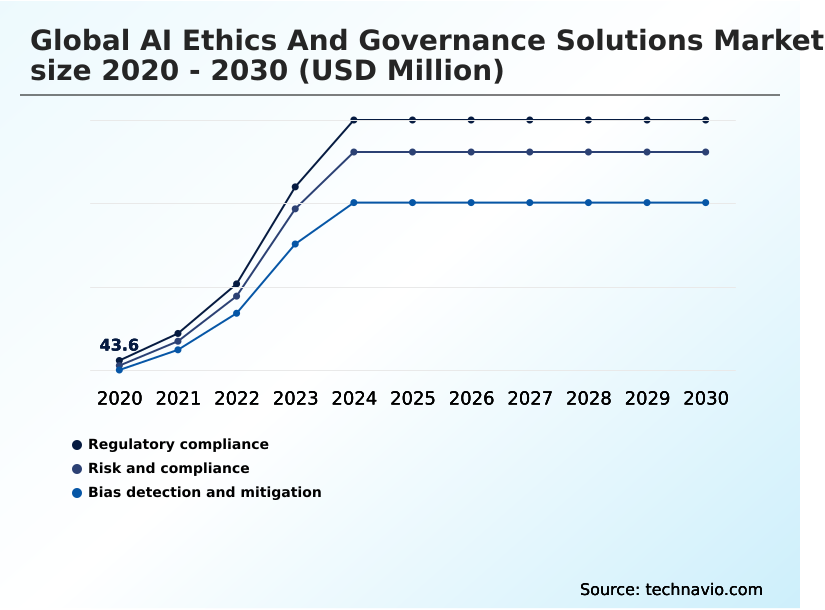
  • Type
    • Regulatory compliance
    • Risk and compliance
    • Bias detection and mitigation
  • Deployment
    • Cloud-based
    • Hybrid
    • On-premises
  • End-user
    • BFSI
    • Healthcare
    • Government and defense
  • Geography
    • North America
      • US
      • Canada
      • Mexico
    • Europe
      • Germany
      • UK
      • France
    • APAC
      • Japan
      • South Korea
      • China
    • Middle East and Africa
      • Saudi Arabia
      • UAE
      • South Africa
    • South America
      • Brazil
      • Argentina
    • Rest of World (ROW)

By Type Insights

The regulatory compliance segment is estimated to witness significant growth during the forecast period.

The market's regulatory compliance segment is driven by the shift toward mandatory regulatory enforcement. Organizations now require a defensible regulatory posture, especially when dealing with extraterritorial regulations and a fragmented regulatory landscape.

To manage this, firms are adopting automated governance platforms that facilitate a risk-based compliance approach. These platforms provide auditable governance frameworks and enable rigorous conformity assessments, which are critical for high-risk systems.

By using integrated governance solutions with automated auditing and monitoring, enterprises can ensure consistent policy enforcement and real-time ethical validation.

This approach streamlines adherence to divergent reporting standards, with some firms reporting a 40% reduction in time spent on audit preparation through such rigorous oversight mechanisms.

Get Free Sample

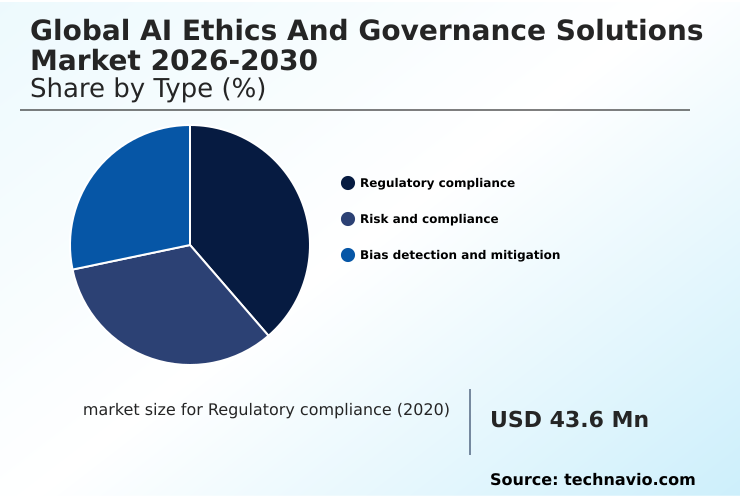
The Regulatory compliance segment was valued at USD 340.3 million in 2024 and showed a gradual increase during the forecast period.

Get Free Sample

Regional Analysis

North America is estimated to contribute 35.8% to the growth of the global market during the forecast period.Technavio’s analysts have elaborately explained the regional trends and drivers that shape the market during the forecast period.

See How AI Ethics And Governance Solutions Market Demand is Rising in North America Get Free Sample

The geographic landscape is increasingly defined by the development of regional governance frameworks and localized governance frameworks to address data sovereignty.

While North America leads with 35.8% of the incremental growth, regions like APAC are rapidly developing standards to ensure AI is trained on representative local datasets, reducing reliance on global foundation models.

Europe's mandatory regulatory enforcement, driven by the EU AI Act, necessitates rigorous conformity assessments and a defensible regulatory posture against extraterritorial regulations.

Achieving unified global governance remains a challenge, but the demand for auditable governance frameworks and global interoperability standards is pushing vendors to ensure consistent policy enforcement.

This drive for accountability and transparency design helps organizations maintain corporate trust management across jurisdictions.

Market Dynamics

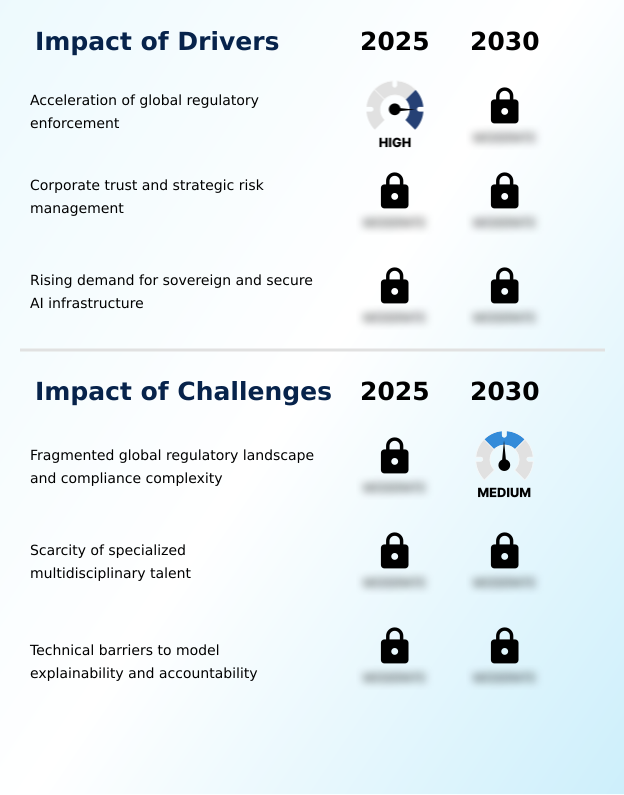
Our researchers analyzed the data with 2025 as the base year, along with the key drivers, trends, and challenges. A holistic analysis of drivers will help companies refine their marketing strategies to gain a competitive advantage.

  • Strategic imperatives for enterprises now revolve around ensuring compliance with EU AI Act and similar global mandates, which necessitates mitigating bias in generative AI models. A key focus is managing risk in agentic AI systems, a task that involves building accountability into AI system design.
  • Many are developing sovereign AI governance infrastructure to address concerns over managing data sovereignty in AI deployments. This includes implementing real-time behavioral monitoring for agents, which is essential for frameworks for agentic AI risk mitigation.
  • The convergence of cybersecurity and AI ethics is now a board-level topic, with firms using tools for automated red-teaming of models and securing AI supply chains from attacks. Addressing fragmented global regulatory landscapes remains a significant hurdle, forcing companies to find ways of navigating divergent AI reporting standards globally.
  • This is complicated by the need for continuous monitoring for AI model drift. Firms are investing heavily in automated compliance for high-risk AI systems to maintain corporate trust with AI governance. Compared to manual processes, which often have error rates exceeding 15%, automated solutions bring that figure down to single digits.
  • Establishing localized AI governance frameworks is also a priority, often requiring governance solutions for hybrid cloud environments. However, the industry continues to struggle with overcoming technical barriers in model explainability, a challenge linked to bridging the talent gap in AI ethics, which is critical for interpreting the outputs of these complex systems.

What are the key market drivers leading to the rise in the adoption of AI Ethics And Governance Solutions Industry?

  • The acceleration of global regulatory enforcement is a primary driver compelling organizations to adopt comprehensive AI ethics and governance solutions.

  • Demand is fueled by the widespread deployment of generative and agentic AI, which elevates the need for robust oversight of high-risk artificial intelligence systems.
  • Organizations are implementing ongoing post-market monitoring and comprehensive audit trails and transparency reports within their machine learning pipelines, achieving a 60% improvement in documenting accountability and transparency design.
  • The push for sovereign AI infrastructure and secure governance environments is another major driver, emphasizing localized data control and data residency requirements.
  • Companies adopting a unified control plane to manage the model integrity lifecycle report a 40% decrease in incidents of unauthorized data egress prevention.
  • This focus on data privacy breach prevention and adherence to internal ethical standards helps support domestic AI capabilities.

What are the market trends shaping the AI Ethics And Governance Solutions Industry?

  • A key market trend is the emergence of agentic AI oversight. This shift necessitates autonomous governance solutions capable of monitoring dynamic, goal-oriented systems.

  • The market is defined by a decisive shift toward autonomous governance systems and agentic AI oversight. This evolution necessitates solutions for real-time behavioral monitoring and identity management for autonomous agents, with early adopters improving incident response times by 35%.
  • The convergence of cybersecurity and AI ethics is a dominant trend, as securing AI supply chain security becomes integral to maintaining corporate trust management. Organizations are implementing runtime security for AI and automated red-teaming to ensure a holistic system integrity, reducing vulnerabilities by up to 50%.
  • This proactive self-regulation, supported by responsible innovation frameworks, is critical for multi-agent systems orchestration and effective agentic risk mitigation.

What challenges does the AI Ethics And Governance Solutions Industry face during its growth?

  • A fragmented global regulatory landscape and the resulting compliance complexity present a significant challenge to the growth of the AI ethics and governance solutions market.

  • A primary challenge is the black box model problem inherent in non-linear AI systems and multi-layered neural networks, which complicates model explainability and accountability. The scarcity of specialized multidisciplinary talent, with demand outstripping supply by over 3 to 1 in key sectors, exacerbates the issue. While automated explainability tools offer some relief, achieving interpretable machine learning remains difficult.
  • Furthermore, ensuring universal AI safety requires constant model drift and re-validation, alongside effective algorithmic bias mitigation and Western-centric bias avoidance. Enterprises are also investing heavily in adversarial attack defense and prompt injection countermeasures, yet effective implementation requires a level of human capital in AI ethics that remains scarce, hindering efforts to achieve a centralized global risk view.

Exclusive Technavio Analysis on Customer Landscape

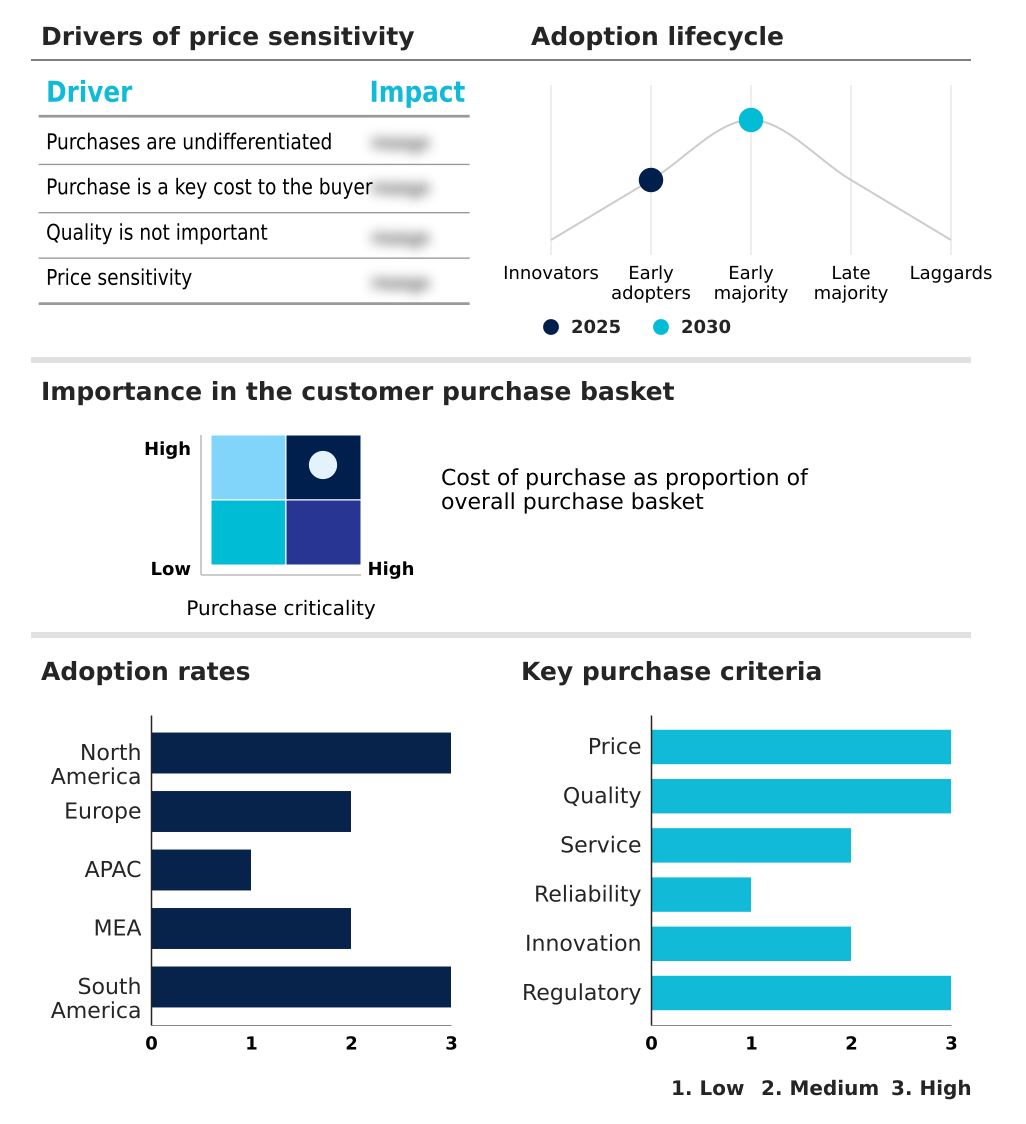
The ai ethics and governance solutions market forecasting report includes the adoption lifecycle of the market, covering from the innovator’s stage to the laggard’s stage. It focuses on adoption rates in different regions based on penetration. Furthermore, the ai ethics and governance solutions market report also includes key purchase criteria and drivers of price sensitivity to help companies evaluate and develop their market growth analysis strategies.

Customer Landscape of AI Ethics And Governance Solutions Industry

Competitive Landscape

Companies are implementing various strategies, such as strategic alliances, ai ethics and governance solutions market forecast, partnerships, mergers and acquisitions, geographical expansion, and product/service launches, to enhance their presence in the industry.

Accenture Plc - Delivers enterprise-grade AI ethics and governance solutions, including responsible AI services and strategic frameworks for digital transformation.

The industry research and growth report includes detailed analyses of the competitive landscape of the market and information about key companies, including:

  • Accenture Plc
  • ArthurAI Inc.
  • Credo AI
  • Deloitte Touche Tohmatsu Ltd.
  • DXC Technology Co.
  • Ernst and Young Global Ltd.
  • Fiddler AI
  • Google LLC
  • H2O.ai Inc.
  • IBM Corp.
  • Infosys Ltd.
  • Microsoft Corp.
  • Monitaur Inc.
  • NTT DATA Corp.
  • OneTrust LLC
  • Oracle Corp.
  • Palantir Technologies Inc.
  • PricewaterhouseCoopers LLP
  • Salesforce Inc.
  • SAS Institute Inc.

Qualitative and quantitative analysis of companies has been conducted to help clients understand the wider business environment as well as the strengths and weaknesses of key industry players. Data is qualitatively analyzed to categorize companies as pure play, category-focused, industry-focused, and diversified; it is quantitatively analyzed to categorize companies as dominant, leading, strong, tentative, and weak.

Recent Development and News in Ai ethics and governance solutions market

  • In October, 2024, IBM Corp. released a study emphasizing that organizations dedicating over 10% of their AI budget to ethics see approximately 30% higher operating profits from AI initiatives, underscoring the strong business case for trust and governance.
  • In January, 2025, IBM Corp. launched its Sovereign Core, a specialized software suite designed to help enterprises and government agencies build and manage secure, AI-ready environments while keeping data and workloads within specific geographic regions.
  • In March, 2025, Credo AI was recognized for its innovations in applied AI governance, particularly its efforts in automating compliance mapping against emerging international standards such as ISO 42001 and the NIST AI Risk Management Framework.
  • In April, 2025, Microsoft Corp. announced the introduction of its open-source Agent Governance Toolkit, a middleware layer designed to provide runtime security and real-time policy enforcement for AI agents interacting with external tools and systems.

Dive into Technavio’s robust research methodology, blending expert interviews, extensive data synthesis, and validated models for unparalleled AI Ethics And Governance Solutions Market insights. See full methodology.

Market Scope
Page number 300
Base year 2025
Historic period 2020-2024
Forecast period 2026-2030
Growth momentum & CAGR Accelerate at a CAGR of 36%
Market growth 2026-2030 USD 4292.2 million
Market structure Fragmented
YoY growth 2025-2026(%) 29.7%
Key countries US, Canada, Mexico, Germany, UK, France, Italy, Spain, The Netherlands, Japan, South Korea, China, India, Australia, Indonesia, Saudi Arabia, UAE, South Africa, Israel, Turkey, Brazil, Argentina and Chile
Competitive landscape Leading Companies, Market Positioning of Companies, Competitive Strategies, and Industry Risks

Request Free Sample

Research Analyst Overview

  • The market is characterized by a fundamental shift toward operationalizing ethical oversight through automated governance platforms. This is no longer a discretionary effort but a core component of risk management, particularly for high-risk artificial intelligence systems. For board-level consideration, the trend of agentic AI oversight introduces new liabilities, requiring real-time behavioral monitoring and robust runtime security for AI.
  • Organizations are now implementing rigorous conformity assessments and auditable governance frameworks to navigate complex regulations. This involves establishing consistent policy enforcement and ongoing post-market monitoring across all machine learning pipelines. Enterprises that have integrated these rigorous oversight mechanisms report a 30% faster resolution of compliance-related incidents.
  • The demand for sovereign AI infrastructure also reflects a strategic move to maintain model integrity lifecycle and control. From bias detection and explainability to automated red-teaming and AI supply chain security, the focus is on creating interpretable machine learning systems that are secure and transparent by design.

What are the Key Data Covered in this AI Ethics And Governance Solutions Market Research and Growth Report?

  • What is the expected growth of the AI Ethics And Governance Solutions Market between 2026 and 2030?

    • USD 4.29 billion, at a CAGR of 36%

  • What segmentation does the market report cover?

    • The report is segmented by Type (Regulatory compliance, Risk and compliance, and Bias detection and mitigation), Deployment (Cloud-based, Hybrid, and On-premises), End-user (BFSI, Healthcare, and Government and defense) and Geography (North America, Europe, APAC, Middle East and Africa, South America)

  • Which regions are analyzed in the report?

    • North America, Europe, APAC, Middle East and Africa and South America

  • What are the key growth drivers and market challenges?

    • Acceleration of global regulatory enforcement, Fragmented global regulatory landscape and compliance complexity

  • Who are the major players in the AI Ethics And Governance Solutions Market?

    • Accenture Plc, ArthurAI Inc., Credo AI, Deloitte Touche Tohmatsu Ltd., DXC Technology Co., Ernst and Young Global Ltd., Fiddler AI, Google LLC, H2O.ai Inc., IBM Corp., Infosys Ltd., Microsoft Corp., Monitaur Inc., NTT DATA Corp., OneTrust LLC, Oracle Corp., Palantir Technologies Inc., PricewaterhouseCoopers LLP, Salesforce Inc. and SAS Institute Inc.

Market Research Insights

  • The market dynamics are shaped by a move toward proactive self-regulation, with organizations adopting responsible innovation frameworks to build corporate trust management. This shift is critical as the deployment of generative and agentic AI increases operational risks. Companies implementing integrated governance solutions have seen a 40% reduction in incidents related to unauthorized data egress prevention, demonstrating a clear ROI.
  • However, a significant barrier remains the shortage of human capital in AI ethics, where skilled professionals are outnumbered by open positions by a ratio of 5 to 1 in some sectors. This talent gap challenges the ability of firms to maintain a robust ethical posture and accountability and transparency design, despite technologies that can improve compliance efficiency by over 50%.

We can help! Our analysts can customize this ai ethics and governance solutions market research report to meet your requirements.

Get in touch

1. Executive Summary

1.1 Market overview

Executive Summary - Chart on Market Overview
Executive Summary - Data Table on Market Overview
Executive Summary - Chart on Global Market Characteristics
Executive Summary - Chart on Market by Geography
Executive Summary - Chart on Market Segmentation by Type
Executive Summary - Chart on Market Segmentation by Deployment
Executive Summary - Chart on Market Segmentation by End-user
Executive Summary - Chart on Incremental Growth
Executive Summary - Data Table on Incremental Growth
Executive Summary - Chart on Company Market Positioning

2. Technavio Analysis

2.1 Analysis of price sensitivity, lifecycle, customer purchase basket, adoption rates, and purchase criteria

2.2 Criticality of inputs and Factors of differentiation

Chart on Overview on criticality of inputs and factors of differentiation

2.3 Factors of disruption

Chart on Overview on factors of disruption

2.4 Impact of drivers and challenges

Chart on Impact of drivers and challenges in 2025 and 2030

3. Market Landscape

3.1 Market ecosystem

Chart on Parent Market
Data Table on - Parent Market

3.2 Market characteristics

Chart on Market characteristics analysis

3.3 Value chain analysis

Chart on Value chain analysis

4. Market Sizing

4.1 Market definition

Data Table on Offerings of companies included in the market definition

4.2 Market segment analysis

Market segments

4.3 Market size 2025

4.4 Market outlook: Forecast for 2025-2030

Chart on Global - Market size and forecast 2025-2030 ($ million)
Data Table on Global - Market size and forecast 2025-2030 ($ million)
Chart on Global Market: Year-over-year growth 2025-2030 (%)
Data Table on Global Market: Year-over-year growth 2025-2030 (%)

5. Historic Market Size

5.1 Global AI Ethics And Governance Solutions Market 2020 - 2024

Historic Market Size - Data Table on Global AI Ethics And Governance Solutions Market 2020 - 2024 ($ million)

5.2 Type segment analysis 2020 - 2024

Historic Market Size - Type Segment 2020 - 2024 ($ million)

5.3 Deployment segment analysis 2020 - 2024

Historic Market Size - Deployment Segment 2020 - 2024 ($ million)

5.4 End-user segment analysis 2020 - 2024

Historic Market Size - End-user Segment 2020 - 2024 ($ million)

5.5 Geography segment analysis 2020 - 2024

Historic Market Size - Geography Segment 2020 - 2024 ($ million)

5.6 Country segment analysis 2020 - 2024

Historic Market Size - Country Segment 2020 - 2024 ($ million)

6. Qualitative Analysis

6.1 Impact of geopolitical conflict for global AI ethics and governance solutions market

7. Five Forces Analysis

7.1 Five forces summary

Five forces analysis - Comparison between 2025 and 2030

7.2 Bargaining power of buyers

Bargaining power of buyers - Impact of key factors 2025 and 2030

7.3 Bargaining power of suppliers

Bargaining power of suppliers - Impact of key factors in 2025 and 2030

7.4 Threat of new entrants

Threat of new entrants - Impact of key factors in 2025 and 2030

7.5 Threat of substitutes

Threat of substitutes - Impact of key factors in 2025 and 2030

7.6 Threat of rivalry

Threat of rivalry - Impact of key factors in 2025 and 2030

7.7 Market condition

Chart on Market condition - Five forces 2025 and 2030

8. Market Segmentation by Type

8.1 Market segments

Chart on Type - Market share 2025-2030 (%)
Data Table on Type - Market share 2025-2030 (%)

8.2 Comparison by Type

Chart on Comparison by Type
Data Table on Comparison by Type

8.3 Regulatory compliance - Market size and forecast 2025-2030

Chart on Regulatory compliance - Market size and forecast 2025-2030 ($ million)
Data Table on Regulatory compliance - Market size and forecast 2025-2030 ($ million)
Chart on Regulatory compliance - Year-over-year growth 2025-2030 (%)
Data Table on Regulatory compliance - Year-over-year growth 2025-2030 (%)

8.4 Risk and compliance - Market size and forecast 2025-2030

Chart on Risk and compliance - Market size and forecast 2025-2030 ($ million)
Data Table on Risk and compliance - Market size and forecast 2025-2030 ($ million)
Chart on Risk and compliance - Year-over-year growth 2025-2030 (%)
Data Table on Risk and compliance - Year-over-year growth 2025-2030 (%)

8.5 Bias detection and mitigation - Market size and forecast 2025-2030

Chart on Bias detection and mitigation - Market size and forecast 2025-2030 ($ million)
Data Table on Bias detection and mitigation - Market size and forecast 2025-2030 ($ million)
Chart on Bias detection and mitigation - Year-over-year growth 2025-2030 (%)
Data Table on Bias detection and mitigation - Year-over-year growth 2025-2030 (%)

8.6 Market opportunity by Type

Market opportunity by Type ($ million)
Data Table on Market opportunity by Type ($ million)

9. Market Segmentation by Deployment

9.1 Market segments

Chart on Deployment - Market share 2025-2030 (%)
Data Table on Deployment - Market share 2025-2030 (%)

9.2 Comparison by Deployment

Chart on Comparison by Deployment
Data Table on Comparison by Deployment

9.3 Cloud-based - Market size and forecast 2025-2030

Chart on Cloud-based - Market size and forecast 2025-2030 ($ million)
Data Table on Cloud-based - Market size and forecast 2025-2030 ($ million)
Chart on Cloud-based - Year-over-year growth 2025-2030 (%)
Data Table on Cloud-based - Year-over-year growth 2025-2030 (%)

9.4 Hybrid - Market size and forecast 2025-2030

Chart on Hybrid - Market size and forecast 2025-2030 ($ million)
Data Table on Hybrid - Market size and forecast 2025-2030 ($ million)
Chart on Hybrid - Year-over-year growth 2025-2030 (%)
Data Table on Hybrid - Year-over-year growth 2025-2030 (%)

9.5 On-premises - Market size and forecast 2025-2030

Chart on On-premises - Market size and forecast 2025-2030 ($ million)
Data Table on On-premises - Market size and forecast 2025-2030 ($ million)
Chart on On-premises - Year-over-year growth 2025-2030 (%)
Data Table on On-premises - Year-over-year growth 2025-2030 (%)

9.6 Market opportunity by Deployment

Market opportunity by Deployment ($ million)
Data Table on Market opportunity by Deployment ($ million)

10. Market Segmentation by End-user

10.1 Market segments

Chart on End-user - Market share 2025-2030 (%)
Data Table on End-user - Market share 2025-2030 (%)

10.2 Comparison by End-user

Chart on Comparison by End-user
Data Table on Comparison by End-user

10.3 BFSI - Market size and forecast 2025-2030

Chart on BFSI - Market size and forecast 2025-2030 ($ million)
Data Table on BFSI - Market size and forecast 2025-2030 ($ million)
Chart on BFSI - Year-over-year growth 2025-2030 (%)
Data Table on BFSI - Year-over-year growth 2025-2030 (%)

10.4 Healthcare - Market size and forecast 2025-2030

Chart on Healthcare - Market size and forecast 2025-2030 ($ million)
Data Table on Healthcare - Market size and forecast 2025-2030 ($ million)
Chart on Healthcare - Year-over-year growth 2025-2030 (%)
Data Table on Healthcare - Year-over-year growth 2025-2030 (%)

10.5 Government and defense - Market size and forecast 2025-2030

Chart on Government and defense - Market size and forecast 2025-2030 ($ million)
Data Table on Government and defense - Market size and forecast 2025-2030 ($ million)
Chart on Government and defense - Year-over-year growth 2025-2030 (%)
Data Table on Government and defense - Year-over-year growth 2025-2030 (%)

10.6 Market opportunity by End-user

Market opportunity by End-user ($ million)
Data Table on Market opportunity by End-user ($ million)

11. Customer Landscape

11.1 Customer landscape overview

Analysis of price sensitivity, lifecycle, customer purchase basket, adoption rates, and purchase criteria

12. Geographic Landscape

12.1 Geographic segmentation

Chart on Market share by geography 2025-2030 (%)
Data Table on Market share by geography 2025-2030 (%)

12.2 Geographic comparison

Chart on Geographic comparison
Data Table on Geographic comparison

12.3 North America - Market size and forecast 2025-2030

Chart on North America - Market size and forecast 2025-2030 ($ million)
Data Table on North America - Market size and forecast 2025-2030 ($ million)
Chart on North America - Year-over-year growth 2025-2030 (%)
Data Table on North America - Year-over-year growth 2025-2030 (%)
Chart on Regional Comparison - North America
Data Table on Regional Comparison - North America

12.3.1 US - Market size and forecast 2025-2030

Chart on US - Market size and forecast 2025-2030 ($ million)
Data Table on US - Market size and forecast 2025-2030 ($ million)
Chart on US - Year-over-year growth 2025-2030 (%)
Data Table on US - Year-over-year growth 2025-2030 (%)

12.3.2 Canada - Market size and forecast 2025-2030

Chart on Canada - Market size and forecast 2025-2030 ($ million)
Data Table on Canada - Market size and forecast 2025-2030 ($ million)
Chart on Canada - Year-over-year growth 2025-2030 (%)
Data Table on Canada - Year-over-year growth 2025-2030 (%)

12.3.3 Mexico - Market size and forecast 2025-2030

Chart on Mexico - Market size and forecast 2025-2030 ($ million)
Data Table on Mexico - Market size and forecast 2025-2030 ($ million)
Chart on Mexico - Year-over-year growth 2025-2030 (%)
Data Table on Mexico - Year-over-year growth 2025-2030 (%)

12.4 Europe - Market size and forecast 2025-2030

Chart on Europe - Market size and forecast 2025-2030 ($ million)
Data Table on Europe - Market size and forecast 2025-2030 ($ million)
Chart on Europe - Year-over-year growth 2025-2030 (%)
Data Table on Europe - Year-over-year growth 2025-2030 (%)
Chart on Regional Comparison - Europe
Data Table on Regional Comparison - Europe

12.4.1 Germany - Market size and forecast 2025-2030

Chart on Germany - Market size and forecast 2025-2030 ($ million)
Data Table on Germany - Market size and forecast 2025-2030 ($ million)
Chart on Germany - Year-over-year growth 2025-2030 (%)
Data Table on Germany - Year-over-year growth 2025-2030 (%)

12.4.2 UK - Market size and forecast 2025-2030

Chart on UK - Market size and forecast 2025-2030 ($ million)
Data Table on UK - Market size and forecast 2025-2030 ($ million)
Chart on UK - Year-over-year growth 2025-2030 (%)
Data Table on UK - Year-over-year growth 2025-2030 (%)

12.4.3 France - Market size and forecast 2025-2030

Chart on France - Market size and forecast 2025-2030 ($ million)
Data Table on France - Market size and forecast 2025-2030 ($ million)
Chart on France - Year-over-year growth 2025-2030 (%)
Data Table on France - Year-over-year growth 2025-2030 (%)

12.4.4 Italy - Market size and forecast 2025-2030

Chart on Italy - Market size and forecast 2025-2030 ($ million)
Data Table on Italy - Market size and forecast 2025-2030 ($ million)
Chart on Italy - Year-over-year growth 2025-2030 (%)
Data Table on Italy - Year-over-year growth 2025-2030 (%)

12.4.5 Spain - Market size and forecast 2025-2030

Chart on Spain - Market size and forecast 2025-2030 ($ million)
Data Table on Spain - Market size and forecast 2025-2030 ($ million)
Chart on Spain - Year-over-year growth 2025-2030 (%)
Data Table on Spain - Year-over-year growth 2025-2030 (%)

12.4.6 The Netherlands - Market size and forecast 2025-2030

Chart on The Netherlands - Market size and forecast 2025-2030 ($ million)
Data Table on The Netherlands - Market size and forecast 2025-2030 ($ million)
Chart on The Netherlands - Year-over-year growth 2025-2030 (%)
Data Table on The Netherlands - Year-over-year growth 2025-2030 (%)

12.5 APAC - Market size and forecast 2025-2030

Chart on APAC - Market size and forecast 2025-2030 ($ million)
Data Table on APAC - Market size and forecast 2025-2030 ($ million)
Chart on APAC - Year-over-year growth 2025-2030 (%)
Data Table on APAC - Year-over-year growth 2025-2030 (%)
Chart on Regional Comparison - APAC
Data Table on Regional Comparison - APAC

12.5.1 Japan - Market size and forecast 2025-2030

Chart on Japan - Market size and forecast 2025-2030 ($ million)
Data Table on Japan - Market size and forecast 2025-2030 ($ million)
Chart on Japan - Year-over-year growth 2025-2030 (%)
Data Table on Japan - Year-over-year growth 2025-2030 (%)

12.5.2 South Korea - Market size and forecast 2025-2030

Chart on South Korea - Market size and forecast 2025-2030 ($ million)
Data Table on South Korea - Market size and forecast 2025-2030 ($ million)
Chart on South Korea - Year-over-year growth 2025-2030 (%)
Data Table on South Korea - Year-over-year growth 2025-2030 (%)

12.5.3 China - Market size and forecast 2025-2030

Chart on China - Market size and forecast 2025-2030 ($ million)
Data Table on China - Market size and forecast 2025-2030 ($ million)
Chart on China - Year-over-year growth 2025-2030 (%)
Data Table on China - Year-over-year growth 2025-2030 (%)

12.5.4 India - Market size and forecast 2025-2030

Chart on India - Market size and forecast 2025-2030 ($ million)
Data Table on India - Market size and forecast 2025-2030 ($ million)
Chart on India - Year-over-year growth 2025-2030 (%)
Data Table on India - Year-over-year growth 2025-2030 (%)

12.5.5 Australia - Market size and forecast 2025-2030

Chart on Australia - Market size and forecast 2025-2030 ($ million)
Data Table on Australia - Market size and forecast 2025-2030 ($ million)
Chart on Australia - Year-over-year growth 2025-2030 (%)
Data Table on Australia - Year-over-year growth 2025-2030 (%)

12.5.6 Indonesia - Market size and forecast 2025-2030

Chart on Indonesia - Market size and forecast 2025-2030 ($ million)
Data Table on Indonesia - Market size and forecast 2025-2030 ($ million)
Chart on Indonesia - Year-over-year growth 2025-2030 (%)
Data Table on Indonesia - Year-over-year growth 2025-2030 (%)

12.6 Middle East and Africa - Market size and forecast 2025-2030

Chart on Middle East and Africa - Market size and forecast 2025-2030 ($ million)
Data Table on Middle East and Africa - Market size and forecast 2025-2030 ($ million)
Chart on Middle East and Africa - Year-over-year growth 2025-2030 (%)
Data Table on Middle East and Africa - Year-over-year growth 2025-2030 (%)
Chart on Regional Comparison - Middle East and Africa
Data Table on Regional Comparison - Middle East and Africa

12.6.1 Saudi Arabia - Market size and forecast 2025-2030

Chart on Saudi Arabia - Market size and forecast 2025-2030 ($ million)
Data Table on Saudi Arabia - Market size and forecast 2025-2030 ($ million)
Chart on Saudi Arabia - Year-over-year growth 2025-2030 (%)
Data Table on Saudi Arabia - Year-over-year growth 2025-2030 (%)

12.6.2 UAE - Market size and forecast 2025-2030

Chart on UAE - Market size and forecast 2025-2030 ($ million)
Data Table on UAE - Market size and forecast 2025-2030 ($ million)
Chart on UAE - Year-over-year growth 2025-2030 (%)
Data Table on UAE - Year-over-year growth 2025-2030 (%)

12.6.3 South Africa - Market size and forecast 2025-2030

Chart on South Africa - Market size and forecast 2025-2030 ($ million)
Data Table on South Africa - Market size and forecast 2025-2030 ($ million)
Chart on South Africa - Year-over-year growth 2025-2030 (%)
Data Table on South Africa - Year-over-year growth 2025-2030 (%)

12.6.4 Israel - Market size and forecast 2025-2030

Chart on Israel - Market size and forecast 2025-2030 ($ million)
Data Table on Israel - Market size and forecast 2025-2030 ($ million)
Chart on Israel - Year-over-year growth 2025-2030 (%)
Data Table on Israel - Year-over-year growth 2025-2030 (%)

12.6.5 Turkey - Market size and forecast 2025-2030

Chart on Turkey - Market size and forecast 2025-2030 ($ million)
Data Table on Turkey - Market size and forecast 2025-2030 ($ million)
Chart on Turkey - Year-over-year growth 2025-2030 (%)
Data Table on Turkey - Year-over-year growth 2025-2030 (%)

12.7 South America - Market size and forecast 2025-2030

Chart on South America - Market size and forecast 2025-2030 ($ million)
Data Table on South America - Market size and forecast 2025-2030 ($ million)
Chart on South America - Year-over-year growth 2025-2030 (%)
Data Table on South America - Year-over-year growth 2025-2030 (%)
Chart on Regional Comparison - South America
Data Table on Regional Comparison - South America

12.7.1 Brazil - Market size and forecast 2025-2030

Chart on Brazil - Market size and forecast 2025-2030 ($ million)
Data Table on Brazil - Market size and forecast 2025-2030 ($ million)
Chart on Brazil - Year-over-year growth 2025-2030 (%)
Data Table on Brazil - Year-over-year growth 2025-2030 (%)

12.7.2 Argentina - Market size and forecast 2025-2030

Chart on Argentina - Market size and forecast 2025-2030 ($ million)
Data Table on Argentina - Market size and forecast 2025-2030 ($ million)
Chart on Argentina - Year-over-year growth 2025-2030 (%)
Data Table on Argentina - Year-over-year growth 2025-2030 (%)

12.7.3 Chile - Market size and forecast 2025-2030

Chart on Chile - Market size and forecast 2025-2030 ($ million)
Data Table on Chile - Market size and forecast 2025-2030 ($ million)
Chart on Chile - Year-over-year growth 2025-2030 (%)
Data Table on Chile - Year-over-year growth 2025-2030 (%)

12.8 Market opportunity by geography

Market opportunity by geography ($ million)
Data Tables on Market opportunity by geography ($ million)

13. Drivers, Challenges, and Opportunity

13.1 Market drivers

Acceleration of global regulatory enforcement
Corporate trust and strategic risk management
Rising demand for sovereign and secure AI infrastructure

13.2 Market challenges

Fragmented global regulatory landscape and compliance complexity
Scarcity of specialized multidisciplinary talent
Technical barriers to model explainability and accountability

13.3 Impact of drivers and challenges

Impact of drivers and challenges in 2025 and 2030

13.4 Market opportunities

Emergence of agentic AI oversight and autonomous governance
Globalization of sovereign AI and regional governance frameworks
Convergence of cybersecurity and AI ethics

14. Competitive Landscape

14.1 Overview

14.2

Overview on criticality of inputs and factors of differentiation

14.3 Landscape disruption

Overview on factors of disruption

14.4 Industry risks

Impact of key risks on business

15. Competitive Analysis

15.1 Companies profiled

Companies covered

15.2 Company ranking index

15.3 Market positioning of companies

Matrix on companies position and classification

15.4 Accenture Plc

Accenture Plc - Overview
Accenture Plc - Business segments
Accenture Plc - Key news
Accenture Plc - Key offerings
Accenture Plc - Segment focus
SWOT

15.5 Deloitte Touche Tohmatsu Ltd.

Deloitte Touche Tohmatsu Ltd. - Overview
Deloitte Touche Tohmatsu Ltd. - Business segments
Deloitte Touche Tohmatsu Ltd. - Key offerings
Deloitte Touche Tohmatsu Ltd. - Segment focus
SWOT

15.6 DXC Technology Co.

DXC Technology Co. - Overview
DXC Technology Co. - Business segments
DXC Technology Co. - Key news
DXC Technology Co. - Key offerings
DXC Technology Co. - Segment focus
SWOT

15.7 Ernst and Young Global Ltd.

Ernst and Young Global Ltd. - Overview
Ernst and Young Global Ltd. - Product / Service
Ernst and Young Global Ltd. - Key offerings
SWOT

15.8 Google LLC

Google LLC - Overview
Google LLC - Product / Service
Google LLC - Key offerings
SWOT

15.9 IBM Corp.

IBM Corp. - Overview
IBM Corp. - Business segments
IBM Corp. - Key news
IBM Corp. - Key offerings
IBM Corp. - Segment focus
SWOT

15.10 Infosys Ltd.

Infosys Ltd. - Overview
Infosys Ltd. - Business segments
Infosys Ltd. - Key offerings
Infosys Ltd. - Segment focus
SWOT

15.11 Microsoft Corp.

Microsoft Corp. - Overview
Microsoft Corp. - Business segments
Microsoft Corp. - Key news
Microsoft Corp. - Key offerings
Microsoft Corp. - Segment focus
SWOT

15.12 NTT DATA Corp.

NTT DATA Corp. - Overview
NTT DATA Corp. - Business segments
NTT DATA Corp. - Key offerings
NTT DATA Corp. - Segment focus
SWOT

15.13 OneTrust LLC

OneTrust LLC - Overview
OneTrust LLC - Product / Service
OneTrust LLC - Key offerings
SWOT

15.14 Oracle Corp.

Oracle Corp. - Overview
Oracle Corp. - Business segments
Oracle Corp. - Key news
Oracle Corp. - Key offerings
Oracle Corp. - Segment focus
SWOT

15.15 Palantir Technologies Inc.

Palantir Technologies Inc. - Overview
Palantir Technologies Inc. - Business segments
Palantir Technologies Inc. - Key offerings
Palantir Technologies Inc. - Segment focus
SWOT

15.16 PricewaterhouseCoopers LLP

PricewaterhouseCoopers LLP - Overview
PricewaterhouseCoopers LLP - Product / Service
PricewaterhouseCoopers LLP - Key offerings
SWOT

15.17 Salesforce Inc.

Salesforce Inc. - Overview
Salesforce Inc. - Business segments
Salesforce Inc. - Key news
Salesforce Inc. - Key offerings
Salesforce Inc. - Segment focus
SWOT

15.18 SAS Institute Inc.

SAS Institute Inc. - Overview
SAS Institute Inc. - Product / Service
SAS Institute Inc. - Key offerings
SWOT

16. Appendix

16.1 Scope of the report

Market definition
Objectives
Notes and caveats

16.2 Inclusions and exclusions checklist

Inclusions checklist
Exclusions checklist

16.3 Currency conversion rates for US$

16.4 Research methodology

16.5 Data procurement

Information sources

16.6 Data validation

16.7 Validation techniques employed for market sizing

16.8 Data synthesis

16.9 360 degree market analysis

16.10 List of abbreviations

Research Methodology

Technavio presents a detailed picture of the market by way of study, synthesis, and summation of data from multiple sources. The analysts have presented the various facets of the market with a particular focus on identifying the key industry influencers. The data thus presented is comprehensive, reliable, and the result of extensive research, both primary and secondary.

INFORMATION SOURCES

Primary sources

  • Manufacturers and suppliers
  • Channel partners
  • Industry experts
  • Strategic decision makers

Secondary sources

  • Industry journals and periodicals
  • Government data
  • Financial reports of key industry players
  • Historical data
  • Press releases

DATA ANALYSIS

Data Synthesis

  • Collation of data
  • Estimation of key figures
  • Analysis of derived insights

Data Validation

  • Triangulation with data models
  • Reference against proprietary databases
  • Corroboration with industry experts

REPORT WRITING

Qualitative

  • Market drivers
  • Market challenges
  • Market trends
  • Five forces analysis

Quantitative

  • Market size and forecast
  • Market segmentation
  • Geographical insights
  • Competitive landscape

Interested in this report?

Get your sample now to see our research methodology and insights!

Download Now

Frequently Asked Questions

AI Ethics And Governance Solutions market growth will increase by USD 4292.2 million during 2026-2030.

The AI Ethics And Governance Solutions market is expected to grow at a CAGR of 36% during 2026-2030.

AI Ethics And Governance Solutions market is segmented by Type (Regulatory compliance, Risk and compliance, Bias detection and mitigation) Deployment (Cloud-based, Hybrid, On-premises) End-user (BFSI, Healthcare, Government and defense)

Accenture Plc, ArthurAI Inc., Credo AI, Deloitte Touche Tohmatsu Ltd., DXC Technology Co., Ernst and Young Global Ltd., Fiddler AI, Google LLC, H2O.ai Inc., IBM Corp., Infosys Ltd., Microsoft Corp., Monitaur Inc., NTT DATA Corp., OneTrust LLC, Oracle Corp., Palantir Technologies Inc., PricewaterhouseCoopers LLP, Salesforce Inc., SAS Institute Inc. are a few of the key vendors in the AI Ethics And Governance Solutions market.

North America will register the highest growth rate of 35.8% among the other regions. Therefore, the AI Ethics And Governance Solutions market in North America is expected to garner significant business opportunities for the vendors during the forecast period.

US, Canada, Mexico, Germany, UK, France, Italy, Spain, The Netherlands, Japan, South Korea, China, India, Australia, Indonesia, Saudi Arabia, UAE, South Africa, Israel, Turkey, Brazil, Argentina, Chile

  • Acceleration of global regulatory enforcement is the driving factor this market.

The AI Ethics And Governance Solutions market vendors should focus on grabbing business opportunities from the Type segment as it accounted for the largest market share in the base year.
RIA - Research AI Assistant
Ask RIA