AI Ethics In Business Market Analysis, Size, and Forecast 2025-2029: North America (US, Canada, and Mexico), Europe (Germany, UK, and France), APAC (China, Japan, and India), Middle East and Africa (Saudi Arabia, UAE, and South Africa), South America (Brazil, Argentina, and Colombia), and Rest of World (ROW)

AI Ethics In Business Market Analysis, Size, and Forecast 2025-2029:
North America (US, Canada, and Mexico), Europe (Germany, UK, and France), APAC (China, Japan, and India), Middle East and Africa (Saudi Arabia, UAE, and South Africa), South America (Brazil, Argentina, and Colombia), and Rest of World (ROW)

Published: Dec 2025 313 Pages SKU: IRTNTR81111

Market Overview at a Glance

$1.64 B
Market Opportunity
29.5%
CAGR 2024 - 2029
38.6%
North America Growth
$291.6 Mn
Software segment 2023

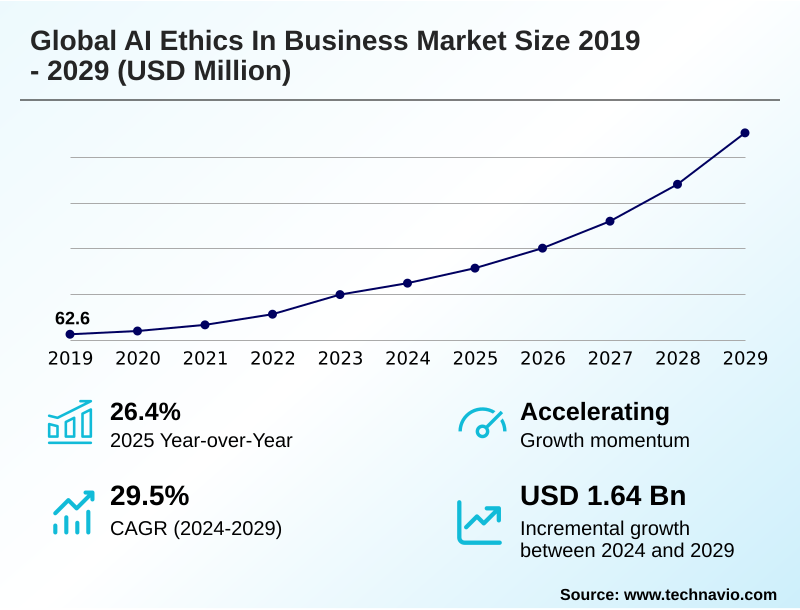
AI Ethics In Business Market Size 2025-2029

The ai ethics in business market size is valued to increase by USD 1.64 billion, at a CAGR of 29.5% from 2024 to 2029. Increasingly stringent regulatory and compliance mandates will drive the ai ethics in business market.

Major Market Trends & Insights

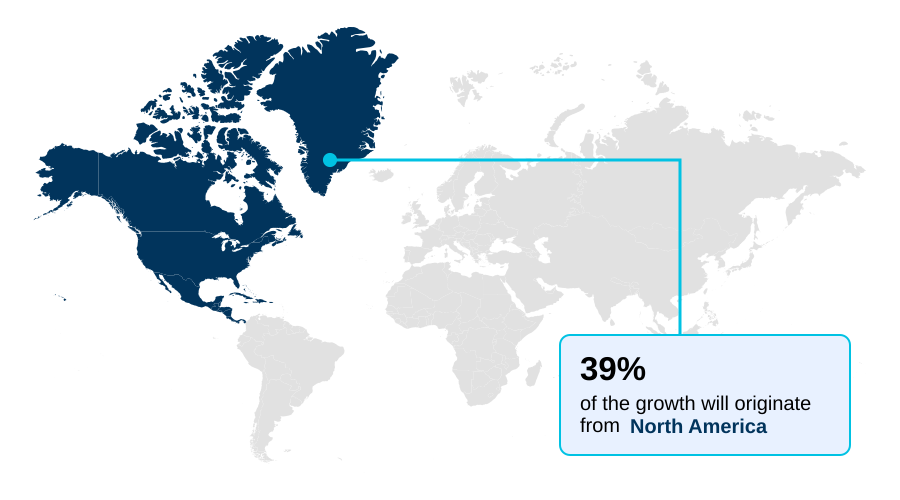
  • North America dominated the market and accounted for a 38.6% growth during the forecast period.
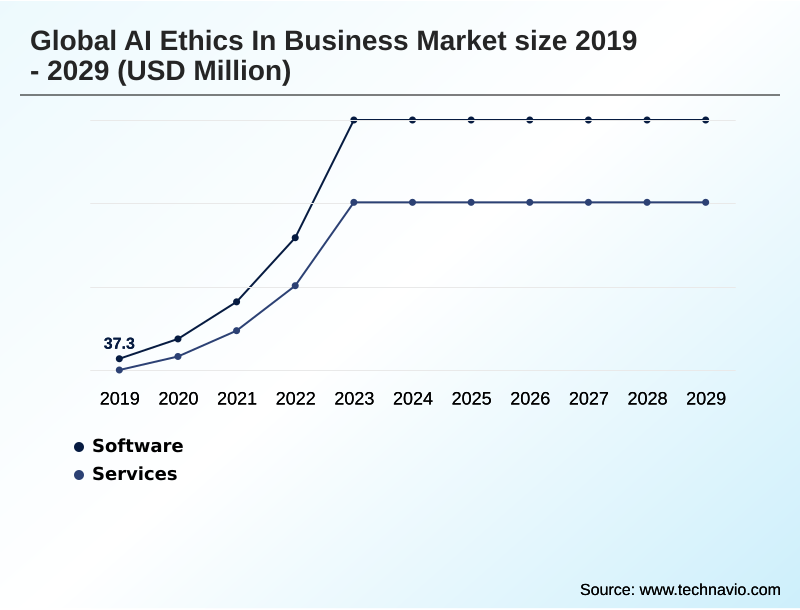
  • By Component - Software segment was valued at USD 291.6 million in 2023
  • By Deployment - Cloud based segment accounted for the largest market revenue share in 2023

Market Size & Forecast

  • Market Opportunities: USD 2.20 billion
  • Market Future Opportunities: USD 1.64 billion
  • CAGR from 2024 to 2029 : 29.5%

Market Summary

  • The ai ethics in business market is rapidly evolving from a niche concern into a critical business function, driven by mounting regulatory pressure and the immense reputational risk of algorithmic failures.
  • As organizations integrate artificial intelligence into core operations, the need for robust AI governance platforms and a clear ethical AI framework becomes paramount to ensure fairness, transparency, and algorithmic accountability. This involves a shift toward proactive ethical governance, moving beyond high-level principles to the practical implementation of responsible MLOps, AI auditing services, and continuous AI model monitoring.
  • For instance, in financial services, deploying a credit scoring model requires rigorous fairness audits and model validation to prevent discriminatory outcomes, which can lead to severe legal penalties. The challenge is magnified by the complexity of black box models and generative AI risks, such as model hallucinations and data privacy breaches.
  • Consequently, investment in explainable AI (XAI), AI guardrails, and tools for regulatory compliance monitoring is no longer optional but essential for sustainable innovation and maintaining enterprise brand equity in the ai ethics in business market.

What will be the Size of the AI Ethics In Business Market during the forecast period?

Get Key Insights on Market Forecast (PDF) Request Free Sample

How is the AI Ethics In Business Market Segmented?

The ai ethics in business industry research report provides comprehensive data (region-wise segment analysis), with forecasts and estimates in "USD million" for the period 2025-2029, as well as historical data from 2019-2023 for the following segments.

  • Component
    • Software
    • Services
  • Deployment
    • Cloud based
    • On premises
    • Hybrid
  • Application
    • Legal and compliance
    • Finance and risk management
    • HR and talent management
    • Product development
    • Others
  • Geography
    • North America
      • US
      • Canada
      • Mexico
    • Europe
      • Germany
      • UK
      • France
    • APAC
      • China
      • Japan
      • India
    • Middle East and Africa
      • Saudi Arabia
      • UAE
      • South Africa
    • South America
      • Brazil
      • Argentina
      • Colombia
    • Rest of World (ROW)

By Component Insights

The software segment is estimated to witness significant growth during the forecast period.

The software segment provides the operational backbone for implementing responsible AI principles at scale. It includes a diverse array of tools such as AI governance platforms for centralized portfolio management and automated AI risk assessment.

Essential software categories focus on bias detection and mitigation, using fairness metrics to analyze datasets and model outputs.

Explainable AI (XAI) software addresses the black box problem, generating human-understandable logic for algorithmic decisions, which is critical for model interpretability and building trust.

The proliferation of large language models (LLMs) has spurred demand for specialized AI guardrails and trust layers, with some tools improving bias detection by over 25%.

These AI compliance solutions for managing generative AI risks and ensuring data governance are becoming indispensable for enterprises seeking to innovate responsibly.

Request Free Sample

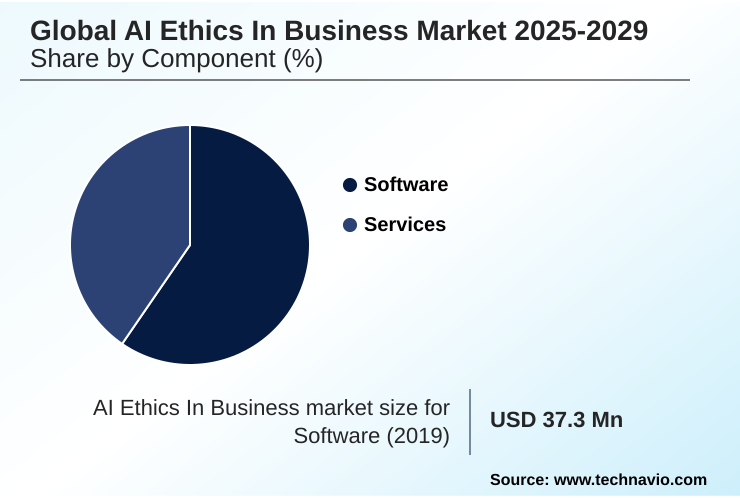
The Software segment was valued at USD 291.6 million in 2023 and showed a gradual increase during the forecast period.

Request Free Sample

Regional Analysis

North America is estimated to contribute 38.6% to the growth of the global market during the forecast period.Technavio’s analysts have elaborately explained the regional trends and drivers that shape the market during the forecast period.

See How AI Ethics In Business Market Demand is Rising in North America Request Free Sample

The global landscape is characterized by distinct regional approaches to AI ethics.

North America, which accounts for 38.6% of the market's incremental growth, is largely driven by private sector innovation and influential, though voluntary, standards like the NIST AI Risk Management Framework.

This contrasts with Europe, where the legally binding EU AI Act creates a compliance-focused market, mandating conformity assessments and stringent data governance.

The US market alone, valued at USD 196.8 million in 2024, sees companies adopt proactive ethical governance and AI risk assessment strategies to manage liability.

Meanwhile, the APAC region presents a fragmented picture, with China implementing state-led regulations targeting content moderation technology and Singapore promoting industry-led tools for ethical AI by design. This divergence necessitates adaptable AI systems oversight and ethical guardrails for multinational operations.

Market Dynamics

Our researchers analyzed the data with 2024 as the base year, along with the key drivers, trends, and challenges. A holistic analysis of drivers will help companies refine their marketing strategies to gain a competitive advantage.

  • Successfully navigating the AI ethics landscape requires a comprehensive strategy that moves beyond theory to concrete action. The role of explainable AI in business is crucial for demystifying complex models and building stakeholder trust. As organizations develop an AI ethics framework, a key challenge is securing budget for AI governance platforms, which are essential for managing a portfolio of models.
  • The benefits of ethical AI for businesses are substantial, including enhanced brand reputation and reduced legal risk, yet many struggle with measuring ROI of ethical AI investments. Best practices for responsible AI implementation include integrating ethics into AI product development from the outset and establishing clear AI governance for enterprise applications.
  • Given the intricacies of the field, there are significant challenges of operationalizing AI ethics principles, particularly in high-stakes areas like finance, which demands the precise application of fairness metrics to financial algorithms. Companies must develop strategies for mitigating algorithmic bias and ensuring compliance with AI ethics regulations, which is complicated by the need for navigating fragmented AI regulatory frameworks.
  • Key activities include demonstrating compliance with AI auditing mandates and implementing tools for AI lifecycle governance. The rise of generative AI introduces further complexity, necessitating the use of AI guardrails for generative models and new methods for managing risks of AI model hallucinations.
  • This focus on practical application extends to specific business functions, highlighting the role of AI ethics in HR talent management and the need for developing transparent AI for customer service.

What are the key market drivers leading to the rise in the adoption of AI Ethics In Business Industry?

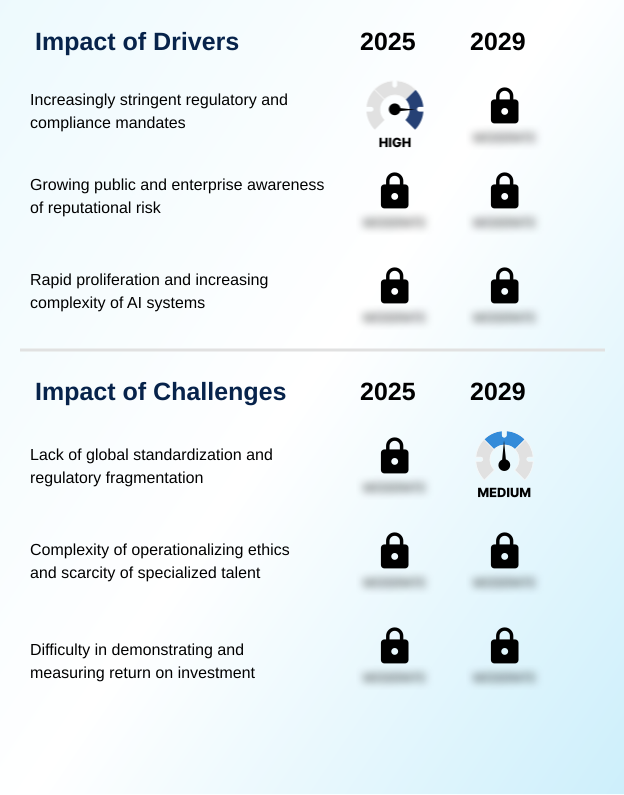
  • Increasingly stringent regulatory frameworks and compliance mandates are a key driver propelling the market's growth.

  • The market is powerfully driven by the rapid proliferation of AI across industries and the escalating complexity of deployed models, particularly large-scale deep learning systems.
  • This velocity of adoption expands enterprise risk management exposure to a new class of risks that traditional software testing cannot address, creating urgent demand for specialized AI ethics solutions.
  • The integration of large language models (LLMs) has introduced a new spectrum of challenges, such as the need for AI safety and security, that organizations are not fully equipped to handle.
  • The development of AI guardrails, which can prevent harmful interactions by over 95%, is a direct response.
  • This driver is amplified by industry acknowledgments that the increasing capability of models, including those from AI safety research, requires a corresponding increase in the sophistication of ethical oversight and enterprise brand equity.

What are the market trends shaping the AI Ethics In Business Industry?

  • A defining market trend is the emergence of specialized governance frameworks and tools. These are designed to address the unique and complex risks introduced by generative AI.

  • A dominant market trend is the move toward the practical operationalization of responsible AI, embedding ethical considerations directly into the AI lifecycle. This involves adopting concrete AI governance structures and standardized frameworks, making responsible AI adoption a measurable and auditable AI process.
  • Organizations are shifting from high-level corporate AI ethics principles to using tools that enable rigorous model monitoring and management, improving project success rates by over 15%. This trend is underscored by broad industry collaborations focused on developing best practices for AI principles implementation.
  • The formalization of roles like Chief AI Ethics Officers and the creation of dedicated teams for AI systems oversight signifies a maturing market where demonstrable accountability is a primary objective. Companies adopting these practices see a 20% faster alignment with emerging regulatory standards.

What challenges does the AI Ethics In Business Industry face during its growth?

  • The lack of global standardization and increasing regulatory fragmentation present a key challenge affecting the industry's growth trajectory.

  • A primary market challenge is the significant scarcity of qualified talent with the requisite hybrid skill set spanning technology, ethics, and regulation. This talent gap hinders the ability of enterprises to build competent in-house AI governance teams, leading to a heavy reliance on external consultants and AI ethics initiatives.
  • Organizations find it difficult to translate abstract concepts like fairness and accountability into scalable technical processes, a problem magnified by the opaque nature of black box models, where achieving full model interpretability remains a hurdle.
  • This skills shortage affects both buyers and sellers, with some firms reporting that project timelines are extended by up to 25% due to a lack of specialized staff. While upskilling programs are underway, developing the nuanced expertise needed for effective AI risk management and demonstrating a clear AI value proposition is a long-term endeavor that currently constrains market growth.

Exclusive Technavio Analysis on Customer Landscape

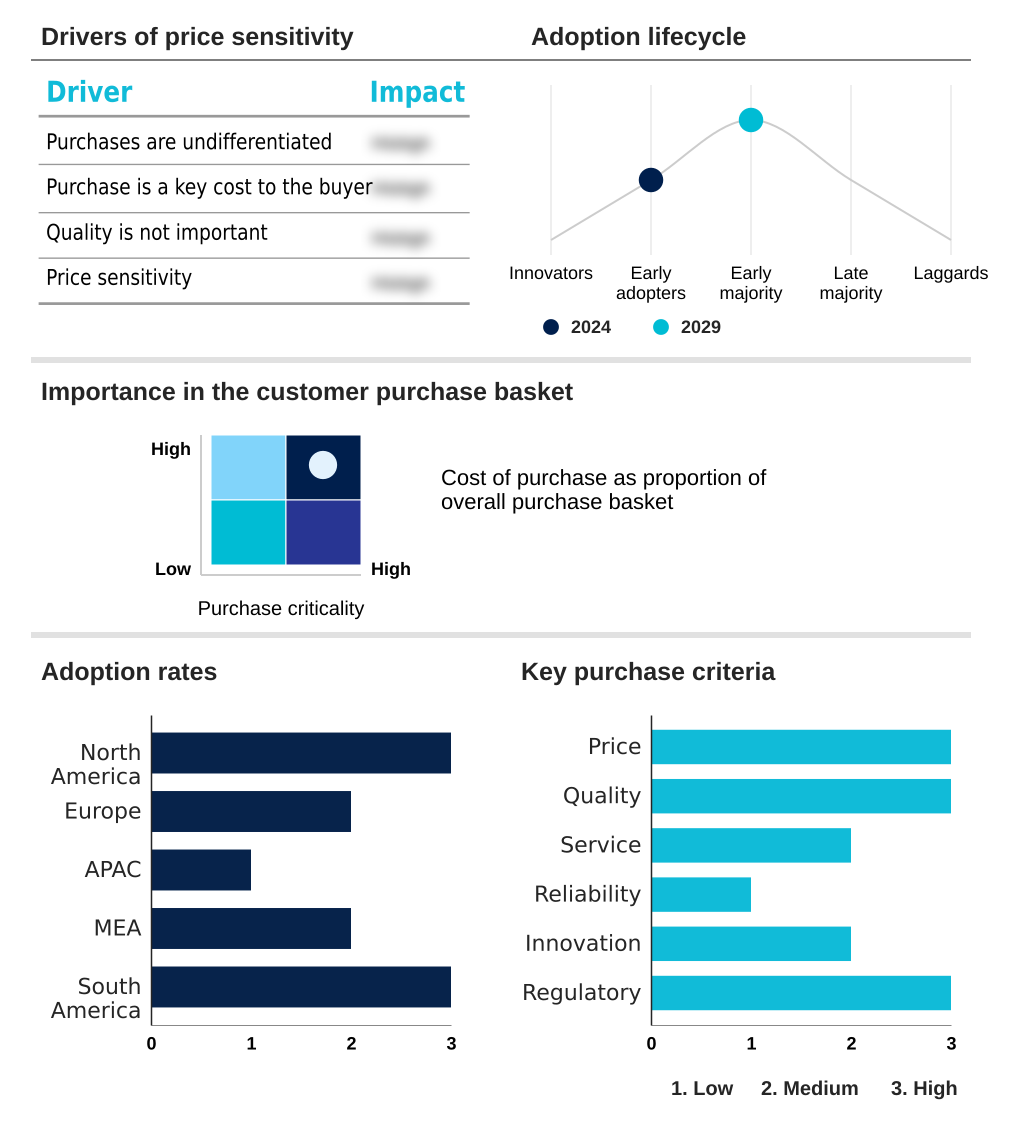
The ai ethics in business market forecasting report includes the adoption lifecycle of the market, covering from the innovator’s stage to the laggard’s stage. It focuses on adoption rates in different regions based on penetration. Furthermore, the ai ethics in business market report also includes key purchase criteria and drivers of price sensitivity to help companies evaluate and develop their market growth analysis strategies.

Customer Landscape of AI Ethics In Business Industry

Competitive Landscape

Companies are implementing various strategies, such as strategic alliances, ai ethics in business market forecast, partnerships, mergers and acquisitions, geographical expansion, and product/service launches, to enhance their presence in the industry.

Accenture PLC - Key market offerings include AI governance platforms, specialized consulting for regulatory compliance, and tools for bias detection, transparency, and model validation across the AI lifecycle.

The industry research and growth report includes detailed analyses of the competitive landscape of the market and information about key companies, including:

  • Accenture PLC
  • Amazon Web Services Inc.
  • Anthropic
  • Boston Consulting Group Inc.
  • Credo AI
  • DataRobot Inc.
  • Deloitte Touche Tohmatsu Ltd.
  • Ernst and Young Global Ltd.
  • Fairly AI
  • Google LLC
  • Holistic AI Inc
  • IBM Corp.
  • McKinsey and Co.
  • Meta Platforms Inc.
  • Microsoft Corp.
  • OpenAI
  • PricewaterhouseCoopers LLP
  • Salesforce Inc.
  • SAP SE

Qualitative and quantitative analysis of companies has been conducted to help clients understand the wider business environment as well as the strengths and weaknesses of key industry players. Data is qualitatively analyzed to categorize companies as pure play, category-focused, industry-focused, and diversified; it is quantitatively analyzed to categorize companies as dominant, leading, strong, tentative, and weak.

Recent Development and News in Ai ethics in business market

  • In September, 2024, Microsoft Corp. announced the launch of its 'Azure AI Compliance Suite,' a new service designed to help organizations automate documentation and reporting to meet the stringent requirements of the EU AI Act for high-risk systems.
  • In November, 2024, IBM Corp. and Deloitte Touche Tohmatsu Ltd. formed a strategic alliance to offer an integrated solution combining ethical AI strategy consulting with IBM's watsonx.governance software platform, targeting regulated industries.
  • In February, 2025, Salesforce Inc. acquired a specialized AI explainability startup for an undisclosed sum, planning to integrate advanced model interpretation capabilities directly into its Einstein Trust Layer to enhance algorithmic transparency for customers.
  • In May, 2025, Anthropic announced it had secured a new round of funding focused on advancing its constitutional AI approach, specifically for developing safer and more steerable models for enterprise applications in finance and healthcare.

Dive into Technavio’s robust research methodology, blending expert interviews, extensive data synthesis, and validated models for unparalleled AI Ethics In Business Market insights. See full methodology.

Market Scope
Page number 313
Base year 2024
Historic period 2019-2023
Forecast period 2025-2029
Growth momentum & CAGR Accelerate at a CAGR of 29.5%
Market growth 2025-2029 USD 1639.5 million
Market structure Fragmented
YoY growth 2024-2025(%) 26.4%
Key countries US, Canada, Mexico, Germany, UK, France, The Netherlands, Italy, Spain, China, Japan, India, South Korea, Australia, Indonesia, Saudi Arabia, UAE, South Africa, Israel, Turkey, Brazil, Argentina and Colombia
Competitive landscape Leading Companies, Market Positioning of Companies, Competitive Strategies, and Industry Risks

Request Free Sample

Research Analyst Overview

  • The market is rapidly maturing as organizations shift focus from abstract principles to the tangible operationalization of ethical AI. This transition is defined by the adoption of AI governance platforms and a concrete ethical AI framework to manage the entire AI lifecycle governance process.
  • Boardrooms now recognize that responsible MLOps, incorporating continuous AI model monitoring and rigorous model validation, is a strategic imperative. The complexity of large language models (LLMs) and their associated generative AI risks, such as model hallucinations and data privacy breaches, has made AI guardrails and robust data governance essential.
  • Businesses are leveraging privacy-enhancing technologies and explainable AI (XAI) to address the opacity of black box models and ensure algorithmic transparency. This proactive stance, driven by the need for regulatory compliance monitoring and AI value alignment, can improve audit efficiency by over 30%.
  • Key activities include fairness audits, red teaming exercises, and leveraging a hybrid skill set within an AI ethics committee to ensure AI system robustness, manage model risk management, and maintain data sovereignty. This focus is critical for achieving algorithmic accountability and mitigating risks from automated employment decision tools.

What are the Key Data Covered in this AI Ethics In Business Market Research and Growth Report?

  • What is the expected growth of the AI Ethics In Business Market between 2025 and 2029?

    • USD 1.64 billion, at a CAGR of 29.5%

  • What segmentation does the market report cover?

    • The report is segmented by Component (Software, and Services), Deployment (Cloud based, On premises, and Hybrid), Application (Legal and compliance, Finance and risk management, HR and talent management, Product development, and Others) and Geography (North America, Europe, APAC, Middle East and Africa, South America)

  • Which regions are analyzed in the report?

    • North America, Europe, APAC, Middle East and Africa and South America

  • What are the key growth drivers and market challenges?

    • Increasingly stringent regulatory and compliance mandates, Lack of global standardization and regulatory fragmentation

  • Who are the major players in the AI Ethics In Business Market?

    • Accenture PLC, Amazon Web Services Inc., Anthropic, Boston Consulting Group Inc., Credo AI, DataRobot Inc., Deloitte Touche Tohmatsu Ltd., Ernst and Young Global Ltd., Fairly AI, Google LLC, Holistic AI Inc, IBM Corp., McKinsey and Co., Meta Platforms Inc., Microsoft Corp., OpenAI, PricewaterhouseCoopers LLP, Salesforce Inc. and SAP SE

Market Research Insights

  • Market dynamics are shaped by a decisive pivot toward proactive ethical governance and the practical implementation of AI principles. This shift is driven by a heightened awareness of AI's societal implications and the need for operational resilience. Organizations are adopting an auditable AI process to demonstrate AI due diligence, with mature firms reporting a 15% higher rate of consumer trust.
  • The complex AI regulatory landscape compels investment in AI compliance solutions and responsible innovation frameworks. Establishing robust AI governance structures and an AI model audit practice has proven to reduce compliance-related incidents by up to 20%.
  • The focus on an ethical AI value proposition and sustainable innovation is reinforced by the need for verifiable AI assessments, which can improve project success rates by more than 10% through early risk identification and alignment with corporate AI ethics principles.

We can help! Our analysts can customize this ai ethics in business market research report to meet your requirements.

Get in touch

1. Executive Summary

1.1 Market overview

Executive Summary - Chart on Market Overview
Executive Summary - Data Table on Market Overview
Executive Summary - Chart on Global Market Characteristics
Executive Summary - Chart on Market by Geography
Executive Summary - Chart on Market Segmentation by Component
Executive Summary - Chart on Market Segmentation by Deployment
Executive Summary - Chart on Market Segmentation by Application
Executive Summary - Chart on Incremental Growth
Executive Summary - Data Table on Incremental Growth
Executive Summary - Chart on Company Market Positioning

2. Technavio Analysis

2.1 Analysis of price sensitivity, lifecycle, customer purchase basket, adoption rates, and purchase criteria

2.2 Criticality of inputs and Factors of differentiation

Chart on Overview on criticality of inputs and factors of differentiation

2.3 Factors of disruption

Chart on Overview on factors of disruption

2.4 Impact of drivers and challenges

Chart on Impact of drivers and challenges in 2024 and 2029

3. Market Landscape

3.1 Market ecosystem

Chart on Parent Market
Data Table on - Parent Market

3.2 Market characteristics

Chart on Market characteristics analysis

3.3 Value chain analysis

Chart on Value chain analysis

4. Market Sizing

4.1 Market definition

Data Table on Offerings of companies included in the market definition

4.2 Market segment analysis

Market segments

4.3 Market size 2024

4.4 Market outlook: Forecast for 2024-2029

Chart on Global - Market size and forecast 2024-2029 ($ million)
Data Table on Global - Market size and forecast 2024-2029 ($ million)
Chart on Global Market: Year-over-year growth 2024-2029 (%)
Data Table on Global Market: Year-over-year growth 2024-2029 (%)

5. Historic Market Size

5.1 Global AI Ethics In Business Market 2019 - 2023

Historic Market Size - Data Table on Global AI Ethics In Business Market 2019 - 2023 ($ million)

5.2 Component segment analysis 2019 - 2023

Historic Market Size - Component Segment 2019 - 2023 ($ million)

5.3 Deployment segment analysis 2019 - 2023

Historic Market Size - Deployment Segment 2019 - 2023 ($ million)

5.4 Application segment analysis 2019 - 2023

Historic Market Size - Application Segment 2019 - 2023 ($ million)

5.5 Geography segment analysis 2019 - 2023

Historic Market Size - Geography Segment 2019 - 2023 ($ million)

5.6 Country segment analysis 2019 - 2023

Historic Market Size - Country Segment 2019 - 2023 ($ million)

6. Five Forces Analysis

6.1 Five forces summary

Five forces analysis - Comparison between 2024 and 2029

6.2 Bargaining power of buyers

Bargaining power of buyers - Impact of key factors 2024 and 2029

6.3 Bargaining power of suppliers

Bargaining power of suppliers - Impact of key factors in 2024 and 2029

6.4 Threat of new entrants

Threat of new entrants - Impact of key factors in 2024 and 2029

6.5 Threat of substitutes

Threat of substitutes - Impact of key factors in 2024 and 2029

6.6 Threat of rivalry

Threat of rivalry - Impact of key factors in 2024 and 2029

6.7 Market condition

Chart on Market condition - Five forces 2024 and 2029

7. Market Segmentation by Component

7.1 Market segments

Chart on Component - Market share 2024-2029 (%)
Data Table on Component - Market share 2024-2029 (%)

7.2 Comparison by Component

Chart on Comparison by Component
Data Table on Comparison by Component

7.3 Software - Market size and forecast 2024-2029

Chart on Software - Market size and forecast 2024-2029 ($ million)
Data Table on Software - Market size and forecast 2024-2029 ($ million)
Chart on Software - Year-over-year growth 2024-2029 (%)
Data Table on Software - Year-over-year growth 2024-2029 (%)

7.4 Services - Market size and forecast 2024-2029

Chart on Services - Market size and forecast 2024-2029 ($ million)
Data Table on Services - Market size and forecast 2024-2029 ($ million)
Chart on Services - Year-over-year growth 2024-2029 (%)
Data Table on Services - Year-over-year growth 2024-2029 (%)

7.5 Market opportunity by Component

Market opportunity by Component ($ million)
Data Table on Market opportunity by Component ($ million)

8. Market Segmentation by Deployment

8.1 Market segments

Chart on Deployment - Market share 2024-2029 (%)
Data Table on Deployment - Market share 2024-2029 (%)

8.2 Comparison by Deployment

Chart on Comparison by Deployment
Data Table on Comparison by Deployment

8.3 Cloud based - Market size and forecast 2024-2029

Chart on Cloud based - Market size and forecast 2024-2029 ($ million)
Data Table on Cloud based - Market size and forecast 2024-2029 ($ million)
Chart on Cloud based - Year-over-year growth 2024-2029 (%)
Data Table on Cloud based - Year-over-year growth 2024-2029 (%)

8.4 On premises - Market size and forecast 2024-2029

Chart on On premises - Market size and forecast 2024-2029 ($ million)
Data Table on On premises - Market size and forecast 2024-2029 ($ million)
Chart on On premises - Year-over-year growth 2024-2029 (%)
Data Table on On premises - Year-over-year growth 2024-2029 (%)

8.5 Hybrid - Market size and forecast 2024-2029

Chart on Hybrid - Market size and forecast 2024-2029 ($ million)
Data Table on Hybrid - Market size and forecast 2024-2029 ($ million)
Chart on Hybrid - Year-over-year growth 2024-2029 (%)
Data Table on Hybrid - Year-over-year growth 2024-2029 (%)

8.6 Market opportunity by Deployment

Market opportunity by Deployment ($ million)
Data Table on Market opportunity by Deployment ($ million)

9. Market Segmentation by Application

9.1 Market segments

Chart on Application - Market share 2024-2029 (%)
Data Table on Application - Market share 2024-2029 (%)

9.2 Comparison by Application

Chart on Comparison by Application
Data Table on Comparison by Application

9.3 Legal and compliance - Market size and forecast 2024-2029

Chart on Legal and compliance - Market size and forecast 2024-2029 ($ million)
Data Table on Legal and compliance - Market size and forecast 2024-2029 ($ million)
Chart on Legal and compliance - Year-over-year growth 2024-2029 (%)
Data Table on Legal and compliance - Year-over-year growth 2024-2029 (%)

9.4 Finance and risk management - Market size and forecast 2024-2029

Chart on Finance and risk management - Market size and forecast 2024-2029 ($ million)
Data Table on Finance and risk management - Market size and forecast 2024-2029 ($ million)
Chart on Finance and risk management - Year-over-year growth 2024-2029 (%)
Data Table on Finance and risk management - Year-over-year growth 2024-2029 (%)

9.5 HR and talent management - Market size and forecast 2024-2029

Chart on HR and talent management - Market size and forecast 2024-2029 ($ million)
Data Table on HR and talent management - Market size and forecast 2024-2029 ($ million)
Chart on HR and talent management - Year-over-year growth 2024-2029 (%)
Data Table on HR and talent management - Year-over-year growth 2024-2029 (%)

9.6 Product development - Market size and forecast 2024-2029

Chart on Product development - Market size and forecast 2024-2029 ($ million)
Data Table on Product development - Market size and forecast 2024-2029 ($ million)
Chart on Product development - Year-over-year growth 2024-2029 (%)
Data Table on Product development - Year-over-year growth 2024-2029 (%)

9.7 Others - Market size and forecast 2024-2029

Chart on Others - Market size and forecast 2024-2029 ($ million)
Data Table on Others - Market size and forecast 2024-2029 ($ million)
Chart on Others - Year-over-year growth 2024-2029 (%)
Data Table on Others - Year-over-year growth 2024-2029 (%)

9.8 Market opportunity by Application

Market opportunity by Application ($ million)
Data Table on Market opportunity by Application ($ million)

10. Customer Landscape

10.1 Customer landscape overview

Analysis of price sensitivity, lifecycle, customer purchase basket, adoption rates, and purchase criteria

11. Geographic Landscape

11.1 Geographic segmentation

Chart on Market share by geography 2024-2029 (%)
Data Table on Market share by geography 2024-2029 (%)

11.2 Geographic comparison

Chart on Geographic comparison
Data Table on Geographic comparison

11.3 North America - Market size and forecast 2024-2029

Chart on North America - Market size and forecast 2024-2029 ($ million)
Data Table on North America - Market size and forecast 2024-2029 ($ million)
Chart on North America - Year-over-year growth 2024-2029 (%)
Data Table on North America - Year-over-year growth 2024-2029 (%)
Chart on Regional Comparison - North America
Data Table on Regional Comparison - North America

11.3.1 US - Market size and forecast 2024-2029

Chart on US - Market size and forecast 2024-2029 ($ million)
Data Table on US - Market size and forecast 2024-2029 ($ million)
Chart on US - Year-over-year growth 2024-2029 (%)
Data Table on US - Year-over-year growth 2024-2029 (%)

11.3.2 Canada - Market size and forecast 2024-2029

Chart on Canada - Market size and forecast 2024-2029 ($ million)
Data Table on Canada - Market size and forecast 2024-2029 ($ million)
Chart on Canada - Year-over-year growth 2024-2029 (%)
Data Table on Canada - Year-over-year growth 2024-2029 (%)

11.3.3 Mexico - Market size and forecast 2024-2029

Chart on Mexico - Market size and forecast 2024-2029 ($ million)
Data Table on Mexico - Market size and forecast 2024-2029 ($ million)
Chart on Mexico - Year-over-year growth 2024-2029 (%)
Data Table on Mexico - Year-over-year growth 2024-2029 (%)

11.4 Europe - Market size and forecast 2024-2029

Chart on Europe - Market size and forecast 2024-2029 ($ million)
Data Table on Europe - Market size and forecast 2024-2029 ($ million)
Chart on Europe - Year-over-year growth 2024-2029 (%)
Data Table on Europe - Year-over-year growth 2024-2029 (%)
Chart on Regional Comparison - Europe
Data Table on Regional Comparison - Europe

11.4.1 Germany - Market size and forecast 2024-2029

Chart on Germany - Market size and forecast 2024-2029 ($ million)
Data Table on Germany - Market size and forecast 2024-2029 ($ million)
Chart on Germany - Year-over-year growth 2024-2029 (%)
Data Table on Germany - Year-over-year growth 2024-2029 (%)

11.4.2 UK - Market size and forecast 2024-2029

Chart on UK - Market size and forecast 2024-2029 ($ million)
Data Table on UK - Market size and forecast 2024-2029 ($ million)
Chart on UK - Year-over-year growth 2024-2029 (%)
Data Table on UK - Year-over-year growth 2024-2029 (%)

11.4.3 France - Market size and forecast 2024-2029

Chart on France - Market size and forecast 2024-2029 ($ million)
Data Table on France - Market size and forecast 2024-2029 ($ million)
Chart on France - Year-over-year growth 2024-2029 (%)
Data Table on France - Year-over-year growth 2024-2029 (%)

11.4.4 The Netherlands - Market size and forecast 2024-2029

Chart on The Netherlands - Market size and forecast 2024-2029 ($ million)
Data Table on The Netherlands - Market size and forecast 2024-2029 ($ million)
Chart on The Netherlands - Year-over-year growth 2024-2029 (%)
Data Table on The Netherlands - Year-over-year growth 2024-2029 (%)

11.4.5 Italy - Market size and forecast 2024-2029

Chart on Italy - Market size and forecast 2024-2029 ($ million)
Data Table on Italy - Market size and forecast 2024-2029 ($ million)
Chart on Italy - Year-over-year growth 2024-2029 (%)
Data Table on Italy - Year-over-year growth 2024-2029 (%)

11.4.6 Spain - Market size and forecast 2024-2029

Chart on Spain - Market size and forecast 2024-2029 ($ million)
Data Table on Spain - Market size and forecast 2024-2029 ($ million)
Chart on Spain - Year-over-year growth 2024-2029 (%)
Data Table on Spain - Year-over-year growth 2024-2029 (%)

11.5 APAC - Market size and forecast 2024-2029

Chart on APAC - Market size and forecast 2024-2029 ($ million)
Data Table on APAC - Market size and forecast 2024-2029 ($ million)
Chart on APAC - Year-over-year growth 2024-2029 (%)
Data Table on APAC - Year-over-year growth 2024-2029 (%)
Chart on Regional Comparison - APAC
Data Table on Regional Comparison - APAC

11.5.1 China - Market size and forecast 2024-2029

Chart on China - Market size and forecast 2024-2029 ($ million)
Data Table on China - Market size and forecast 2024-2029 ($ million)
Chart on China - Year-over-year growth 2024-2029 (%)
Data Table on China - Year-over-year growth 2024-2029 (%)

11.5.2 Japan - Market size and forecast 2024-2029

Chart on Japan - Market size and forecast 2024-2029 ($ million)
Data Table on Japan - Market size and forecast 2024-2029 ($ million)
Chart on Japan - Year-over-year growth 2024-2029 (%)
Data Table on Japan - Year-over-year growth 2024-2029 (%)

11.5.3 India - Market size and forecast 2024-2029

Chart on India - Market size and forecast 2024-2029 ($ million)
Data Table on India - Market size and forecast 2024-2029 ($ million)
Chart on India - Year-over-year growth 2024-2029 (%)
Data Table on India - Year-over-year growth 2024-2029 (%)

11.5.4 South Korea - Market size and forecast 2024-2029

Chart on South Korea - Market size and forecast 2024-2029 ($ million)
Data Table on South Korea - Market size and forecast 2024-2029 ($ million)
Chart on South Korea - Year-over-year growth 2024-2029 (%)
Data Table on South Korea - Year-over-year growth 2024-2029 (%)

11.5.5 Australia - Market size and forecast 2024-2029

Chart on Australia - Market size and forecast 2024-2029 ($ million)
Data Table on Australia - Market size and forecast 2024-2029 ($ million)
Chart on Australia - Year-over-year growth 2024-2029 (%)
Data Table on Australia - Year-over-year growth 2024-2029 (%)

11.5.6 Indonesia - Market size and forecast 2024-2029

Chart on Indonesia - Market size and forecast 2024-2029 ($ million)
Data Table on Indonesia - Market size and forecast 2024-2029 ($ million)
Chart on Indonesia - Year-over-year growth 2024-2029 (%)
Data Table on Indonesia - Year-over-year growth 2024-2029 (%)

11.6 Middle East and Africa - Market size and forecast 2024-2029

Chart on Middle East and Africa - Market size and forecast 2024-2029 ($ million)
Data Table on Middle East and Africa - Market size and forecast 2024-2029 ($ million)
Chart on Middle East and Africa - Year-over-year growth 2024-2029 (%)
Data Table on Middle East and Africa - Year-over-year growth 2024-2029 (%)
Chart on Regional Comparison - Middle East and Africa
Data Table on Regional Comparison - Middle East and Africa

11.6.1 Saudi Arabia - Market size and forecast 2024-2029

Chart on Saudi Arabia - Market size and forecast 2024-2029 ($ million)
Data Table on Saudi Arabia - Market size and forecast 2024-2029 ($ million)
Chart on Saudi Arabia - Year-over-year growth 2024-2029 (%)
Data Table on Saudi Arabia - Year-over-year growth 2024-2029 (%)

11.6.2 UAE - Market size and forecast 2024-2029

Chart on UAE - Market size and forecast 2024-2029 ($ million)
Data Table on UAE - Market size and forecast 2024-2029 ($ million)
Chart on UAE - Year-over-year growth 2024-2029 (%)
Data Table on UAE - Year-over-year growth 2024-2029 (%)

11.6.3 South Africa - Market size and forecast 2024-2029

Chart on South Africa - Market size and forecast 2024-2029 ($ million)
Data Table on South Africa - Market size and forecast 2024-2029 ($ million)
Chart on South Africa - Year-over-year growth 2024-2029 (%)
Data Table on South Africa - Year-over-year growth 2024-2029 (%)

11.6.4 Israel - Market size and forecast 2024-2029

Chart on Israel - Market size and forecast 2024-2029 ($ million)
Data Table on Israel - Market size and forecast 2024-2029 ($ million)
Chart on Israel - Year-over-year growth 2024-2029 (%)
Data Table on Israel - Year-over-year growth 2024-2029 (%)

11.6.5 Turkey - Market size and forecast 2024-2029

Chart on Turkey - Market size and forecast 2024-2029 ($ million)
Data Table on Turkey - Market size and forecast 2024-2029 ($ million)
Chart on Turkey - Year-over-year growth 2024-2029 (%)
Data Table on Turkey - Year-over-year growth 2024-2029 (%)

11.7 South America - Market size and forecast 2024-2029

Chart on South America - Market size and forecast 2024-2029 ($ million)
Data Table on South America - Market size and forecast 2024-2029 ($ million)
Chart on South America - Year-over-year growth 2024-2029 (%)
Data Table on South America - Year-over-year growth 2024-2029 (%)
Chart on Regional Comparison - South America
Data Table on Regional Comparison - South America

11.7.1 Brazil - Market size and forecast 2024-2029

Chart on Brazil - Market size and forecast 2024-2029 ($ million)
Data Table on Brazil - Market size and forecast 2024-2029 ($ million)
Chart on Brazil - Year-over-year growth 2024-2029 (%)
Data Table on Brazil - Year-over-year growth 2024-2029 (%)

11.7.2 Argentina - Market size and forecast 2024-2029

Chart on Argentina - Market size and forecast 2024-2029 ($ million)
Data Table on Argentina - Market size and forecast 2024-2029 ($ million)
Chart on Argentina - Year-over-year growth 2024-2029 (%)
Data Table on Argentina - Year-over-year growth 2024-2029 (%)

11.7.3 Colombia - Market size and forecast 2024-2029

Chart on Colombia - Market size and forecast 2024-2029 ($ million)
Data Table on Colombia - Market size and forecast 2024-2029 ($ million)
Chart on Colombia - Year-over-year growth 2024-2029 (%)
Data Table on Colombia - Year-over-year growth 2024-2029 (%)

11.8 Market opportunity by geography

Market opportunity by geography ($ million)
Data Tables on Market opportunity by geography ($ million)

12. Drivers, Challenges, and Opportunity

12.1 Market drivers

Increasingly stringent regulatory and compliance mandates
Growing public and enterprise awareness of reputational risk
Rapid proliferation and increasing complexity of AI systems

12.2 Market challenges

Lack of global standardization and regulatory fragmentation
Complexity of operationalizing ethics and scarcity of specialized talent
Difficulty in demonstrating and measuring return on investment

12.3 Impact of drivers and challenges

Impact of drivers and challenges in 2024 and 2029

12.4 Market opportunities

Emergence of specialized governance for generative AI
Shift from high level principles to practical operationalization
Formalization of AI auditing and third party certification

13. Competitive Landscape

13.1 Overview

13.2

Overview on criticality of inputs and factors of differentiation

13.3 Landscape disruption

Overview on factors of disruption

13.4 Industry risks

Impact of key risks on business

14. Competitive Analysis

14.1 Companies profiled

Companies covered

14.2 Company ranking index

14.3 Market positioning of companies

Matrix on companies position and classification

14.4 Accenture PLC

Accenture PLC - Overview
Accenture PLC - Business segments
Accenture PLC - Key news
Accenture PLC - Key offerings
Accenture PLC - Segment focus
SWOT

14.5 Amazon Web Services Inc.

Amazon Web Services Inc. - Overview
Amazon Web Services Inc. - Product / Service
Amazon Web Services Inc. - Key news
Amazon Web Services Inc. - Key offerings
SWOT

14.6 Anthropic

Anthropic - Overview
Anthropic - Product / Service
Anthropic - Key offerings
SWOT

14.7 Boston Consulting Group Inc.

Boston Consulting Group Inc. - Overview
Boston Consulting Group Inc. - Product / Service
Boston Consulting Group Inc. - Key offerings
SWOT

14.8 Credo AI

Credo AI - Overview
Credo AI - Product / Service
Credo AI - Key offerings
SWOT

14.9 Deloitte Touche Tohmatsu Ltd.

Deloitte Touche Tohmatsu Ltd. - Overview
Deloitte Touche Tohmatsu Ltd. - Business segments
Deloitte Touche Tohmatsu Ltd. - Key offerings
Deloitte Touche Tohmatsu Ltd. - Segment focus
SWOT

14.10 Google LLC

Google LLC - Overview
Google LLC - Product / Service
Google LLC - Key offerings
SWOT

14.11 Holistic AI Inc

Holistic AI Inc - Overview
Holistic AI Inc - Product / Service
Holistic AI Inc - Key offerings
SWOT

14.12 IBM Corp.

IBM Corp. - Overview
IBM Corp. - Business segments
IBM Corp. - Key news
IBM Corp. - Key offerings
IBM Corp. - Segment focus
SWOT

14.13 McKinsey and Co.

McKinsey and Co. - Overview
McKinsey and Co. - Product / Service
McKinsey and Co. - Key offerings
SWOT

14.14 Meta Platforms Inc.

Meta Platforms Inc. - Overview
Meta Platforms Inc. - Business segments
Meta Platforms Inc. - Key offerings
Meta Platforms Inc. - Segment focus
SWOT

14.15 Microsoft Corp.

Microsoft Corp. - Overview
Microsoft Corp. - Business segments
Microsoft Corp. - Key news
Microsoft Corp. - Key offerings
Microsoft Corp. - Segment focus
SWOT

14.16 OpenAI

OpenAI - Overview
OpenAI - Product / Service
OpenAI - Key offerings
SWOT

14.17 Salesforce Inc.

Salesforce Inc. - Overview
Salesforce Inc. - Product / Service
Salesforce Inc. - Key news
Salesforce Inc. - Key offerings
SWOT

14.18 SAP SE

SAP SE - Overview
SAP SE - Business segments
SAP SE - Key news
SAP SE - Key offerings
SAP SE - Segment focus
SWOT

15. Appendix

15.1 Scope of the report

Market definition
Objectives
Notes and caveats

15.2 Inclusions and exclusions checklist

Inclusions checklist
Exclusions checklist

15.3 Currency conversion rates for US$

15.4 Research methodology

15.5 Data procurement

Information sources

15.6 Data validation

15.7 Validation techniques employed for market sizing

15.8 Data synthesis

15.9 360 degree market analysis

15.10 List of abbreviations

Research Methodology

Technavio presents a detailed picture of the market by way of study, synthesis, and summation of data from multiple sources. The analysts have presented the various facets of the market with a particular focus on identifying the key industry influencers. The data thus presented is comprehensive, reliable, and the result of extensive research, both primary and secondary.

INFORMATION SOURCES

Primary sources

  • Manufacturers and suppliers
  • Channel partners
  • Industry experts
  • Strategic decision makers

Secondary sources

  • Industry journals and periodicals
  • Government data
  • Financial reports of key industry players
  • Historical data
  • Press releases

DATA ANALYSIS

Data Synthesis

  • Collation of data
  • Estimation of key figures
  • Analysis of derived insights

Data Validation

  • Triangulation with data models
  • Reference against proprietary databases
  • Corroboration with industry experts

REPORT WRITING

Qualitative

  • Market drivers
  • Market challenges
  • Market trends
  • Five forces analysis

Quantitative

  • Market size and forecast
  • Market segmentation
  • Geographical insights
  • Competitive landscape

Interested in this report?

Get your sample now to see our research methodology and insights!

Download Now

Frequently Asked Questions

AI Ethics In Business market growth will increase by USD 1639.5 million during 2025-2029.

The AI Ethics In Business market is expected to grow at a CAGR of 29.5% during 2025-2029.

AI Ethics In Business market is segmented by Component (Software, Services) Deployment (Cloud based, On premises, Hybrid) Application (Legal and compliance, Finance and risk management, HR and talent management, Product development, Others)

Accenture PLC, Amazon Web Services Inc., Anthropic, Boston Consulting Group Inc., Credo AI, DataRobot Inc., Deloitte Touche Tohmatsu Ltd., Ernst and Young Global Ltd., Fairly AI, Google LLC, Holistic AI Inc, IBM Corp., McKinsey and Co., Meta Platforms Inc., Microsoft Corp., OpenAI, PricewaterhouseCoopers LLP, Salesforce Inc., SAP SE are a few of the key vendors in the AI Ethics In Business market.

North America will register the highest growth rate of 38.6% among the other regions. Therefore, the AI Ethics In Business market in North America is expected to garner significant business opportunities for the vendors during the forecast period.

US, Canada, Mexico, Germany, UK, France, The Netherlands, Italy, Spain, China, Japan, India, South Korea, Australia, Indonesia, Saudi Arabia, UAE, South Africa, Israel, Turkey, Brazil, Argentina, Colombia

  • Increasingly stringent regulatory and compliance mandates is the driving factor this market.

The AI Ethics In Business market vendors should focus on grabbing business opportunities from the Component segment as it accounted for the largest market share in the base year.